Survey on Various Unsupervised
Learning Techniques for Anomaly Detection
Ms. Ashwini Athawale
1, Mrs. Deepali M. Gohil
2
Department of Computer Science and Software Engineering,D. Y. Patil college of Engineering, Akurdi, Pune, India1 Assistant Professor, Department of Computer Science and Software Engineering, D. Y. Patil college of Engineering,
Akurdi, Pune, India2
ABSTRACT: Anomaly detection is the process of identifying unexpected items or events in datasets, which differ from the norm. In contrast to standard classification tasks, anomaly detection is often applied on unlabelled data, taking only the internal structure of the dataset into account. This challenge is known as unsupervised anomaly detection and is addressed in many practical applications, for example in network intrusion detection, fraud detection as well as in the life science and medical domain. Dozens of algorithms have been proposed inthis area, but unfortunately the research community still lacks a comparative universal evaluation as well as common publicly available datasets. In this survey, benefits and drawbacks of various unsupervised learning techniques are discussed and some suggestions are made on choosing the suitable techniques to detect anomalies. Unsupervised learning is a type of learning algorithm used to draw inferences from datasets consisting of input data without labelled responses. These learning methods are used to find the hidden patterns or grouping in data. Various techniques has grouped from different categories to differentiate between normal and anomalous behaviour of the data used by various application to detect the fraudulent activities. The anomaly detection also provides better threat intelligence and optimize the accuracy of alerts.
KEYWORDS: Anomaly detection, unsupervised Learning.
I. INTRODUCTION
In recent days industry has evolved into a highly-supervised industry, where operational security and safety are present and act as foundational values. Each and every information has to be monitored to avoid undesired events and to prevent possible attacks and abnormal behaviour. As external threats are increasing most of the system suffers from anomalies which leads to false information. Constant monitoring has to be done to avoid data loss. Anomaly detection is very important, where the nature of the data can be observed constantly. Anomaly detection provides better threat intelligence and optimize the accuracy of alerts. Safety and security of data is augmented. Anomaly detection has to be done with greater scale and speed so that the safety and security of the data can be augmented. Machine Learning has four normal classes of utilizations: grouping, foreseeing next esteem, peculiarity recognition, and finding structure. Among them, Anomaly discovery identifies information focuses in information that does not fit well with whatever remains of the information. It has an extensive variety of uses, for example, misrepresentation location, observation, finding, information clean-up, and prescient support. In most situations, the data is created by one or more generating processes, which are not only representing activities in the system but also observations on entity collections. When the generating process behaves unusually, it creates anomalies or outliers. Thus, an anomaly often contains valuable information about abnormal characteristics of the systems and elements that impacts the generation process.
Unsupervised learning
II. TYPES OF ANOMALIES
Anomalies or outliers are broadly categorized as follows:
Point anomalies- A solitary example of information is odd if it's too far-removed from the rest. Nearly all unsupervised anomaly detection algorithm are based on this type.
Contextual Anomalies- An information is irregular in a particular setting, yet not generally oddity if happen at certain time or certain area.
Collective anomalies- A collection of related information is anomalous with respect to the entire data.
Normalization
At the point when a dataset was pre-processed with the end goal that it speaks to a point inconsistency discovery issue, the last advance before the unsupervised anomaly detection algorithm is normalization. With the distinctive kinds of information, standardization should be performed by considering foundation learning into account. Min-max normalization is a typical normalization method, where every feature is normalized into a common interval [0,1] and standardizing, where each feature is transformed such that its mean is zero and its standard deviation is one In handy application min-max normalization is regularly utilized, now and then straightforward normalization can likewise be contra-profitable. Let’s assume we have a categorical binary feature converted to [0, 1] and a numerical value measuring a length normalized to [0, 1]. Since the categorical binary feature brings about separations being it is possible that one or zero, it impacts the outcome as the numerical value. This is the reason, why foundation data is likewise essential during standardization to maintain a strategic distance from these errors in the standardization procedure.
III. RELATEDWORK
From the base of our paper, we mainly present unsupervised learning techniques for anomaly detection. Various categories of anomaly detection techniques are discussed. As we all know there is no ideal algorithm, each one have their own benefits and drawback. In [19] the authors summarize a structured and comprehensive overview of the research on anomaly detection. In [20] the unsupervised learning techniques are discussed and experimented with the results. In [21] Principal Component Analysis (PCA) and Fuzzy Adaptive Resonance Theory (Fuzzy ART) are applied to reduce the high dimensional data vectors and distance between a vector and its projection. In the LOF algorithm [22][23], it solves the problem of mining the local outliers. The COF algorithm [24] improves the effectiveness of an existing local outlier factor (LOF) scheme when a pattern itself has similar neighbourhood density as an outlier. In [25] anomaly is detected using k means clustering technique, and experimented with different k values. K-Means [26] clustering method is first applied to the normal training instances to partition it into ‘k’ clusters using Euclidean distance similarity. Using this technique anomaly scores are extracted, these anomaly scores are used find the final anomaly scores. This paper [27] illustrates how to use apriority algorithm in intrusion detection systems to create an automatic firewall rules generator to detect novel anomaly attack.
IV. UNSUPERVISED ANOMALY DETECTIONALGORITHMS
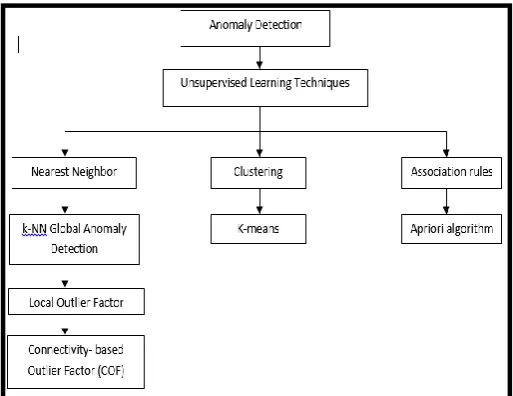
Unsupervised anomaly detection algorithms can be roughly categorized into the following main groups [15] as illustrated in Fig 1: (A) Nearest-neighbour based techniques
Fig 1. A taxonomy of unsupervised anomaly detection algorithms comprising of four main groups. Note that CMGOS can be categorized in two groups: It is a clustering-based algorithm as well as estimating a subspace of each cluster.
Fig 2. System Design of Unsupervised Anomaly Detection
V. CONTEXT AWARE IN ANOMALY DETECTION
(A) NEAREST-NEIGHBOR BASED TECHNIQUES
- k-NN Global Anomaly Detection
The k-nearest neighbours (k-NN) global anomaly detection algorithm is a is a straight forward method for detecting anomalies, not to be mistaken with k-nearest neighbour classification. As the name already says it concentrates on the global anomalies and not able to detect the local anomalies. K-nearest neighbour has to be find for each record in the dataset. Anomaly score is calculated using the distance of the kth- nearest neighbour or the average distance to all the k- nearest neighbours. The first method is referred as kth-NN and the latter method as k-NN. K-NN is the preferable method in most of the applications. The absolute value of the score is depend on
be in the range 10 < k < 50. In classification k is possible to determine using cross validation, where in unsupervised anomaly detection there is no such technique to determine due
to missing labels. For that reason, many different values for k and average in order to get a fair evaluation when comparing algorithms.
- Local Outlier Factor (LOF)
The local outlier factor is the most well-known local anomaly detection algorithm and pioneered the idea of local anomalies.
The idea of LOF is carried out by the nearest neighbour based algorithm. The LOF is calculated using the following steps.
1. The k-nearest-neighbors must be found for each record x. If there should arise an occurrence of separation tie of the kth neighbor, more than k neighbors are utilized.
2. Utilizing this k-nearest neighbors Nk, the nearby thickness for a record is evaluated by calculating the Local Reachability Density (LRD)
3. At long last, the LOF score is computed by comparing the LRD of a record and the LRDs of its k neighbors. The LOF score is therefore fundamentally a ratio of local densities. This results in the nice property of LOF, that common place events, which densities are as vast as the densities of their neighbours, get a score of around 1.0. Inconsistencies, which have a low nearby thickness, will bring about greater scores. It is also cleared that why this algorithm is local. Obviously, global anomalies also can be recognized since they additionally have a low LRD when contrasting and their neighbours. It is critical to take note of that in abnormality discovery assignments, where local outliers are not of intrigue, this calculation will produce a great deal of false alarms as we discovered amid our assessment. The setting of k is indispensable for this algorithm. Other than the author of this algorithm propose an ensemble procedure for figuring LOF. Scores for various k's up to an upper bound are registered and afterward, the greatest of these scores is taken. Other than registering the LOF score for a solitary k, we additionally consider this methodology in our assessment, alluding to it as LOF-UB (upper bound). For comparison reasons, strategy has been used by setting different upper bounds and averages the obtained results.
- Connectivity- Based Outlier Factor
The connectivity based anomaly factor is like LOF, however the density estimation for the records is performed in an unexpected way. In LOF, the k-nearest neighbours are chosen in light of the Euclidean distance. This in a roundabout way expect, that the information is disseminated circularly around the example. On the off chance that this supposition is disregarded, for instance if highlights have a direct straight connection, the density estimation is erroneous. COF needs to remunerate this inadequacy and appraisals the nearby density of the area utilizing a briefest way approach, called the binding separation. Numerically, this anchoring separation is the base of the entirety of all separations associating all k neighbours and the occurrence. For basic cases, where high lights are clearly connected, this density estimation approach performs significantly more precise. The round thickness estimation of LOF can't distinguish the special case, however COF succeeded by interfacing the common records with each other for surveying the local density.
(B) CLUSTERING BASED METHODS
- K- means Clustering
Distance=argmins D (xi, cj)
Where,
xiIs Distance between instance and
cj. Is cluster centre
The iteration is stopped when none of the cluster assignment changes. Average of all the points is taken as centroid. The clusters are populated by the following steps,
i. For each point in the cluster, the nearest point is the current centroid. ii. Assign the points and update the locations of the centroid.
iii. The points are reassigned to their closest centroid.
Steps ii and iii are repeated until convergence, convergence points do not move between clusters and centroid stabilize. The K is selected by trying different K, looking at the change in the average distance to centroid, as K increases. Various procedures exists for validating K, including cross-validation, information criteria, the information theoretic jump strategy, the silhouette technique, and the G-means algorithm. Also, observing the appropriation of information focuses crosswise over gatherings gives knowledge on splitting the data for every K.
(C) ASSOCIATION RULES
- Apriori Algorithm
Association rule finds all frequent itemsets and generate strong association rules from the frequent itemsets. Apriori algorithm is mining frequent itemsets for Boolean association rules. The Apriori algorithm is an unsupervised algorithm used to find frequent itemsets. Apriori utilizes a "bottom up" approach, where visit subsets are broadened one thing at any given moment. Apriori algorithm works on its two basic principles, first that if an itemset occurs often then all subset of itemset happens habitually and other is that if an itemset happens occasionally then all superset has rarely events.
Fig.3 Overall process of Apriori algorithm
Apriori property:
Apriori property is used to reduce the search space.
All nonempty subset of frequent items must be also frequent. Anti-monotone in the sense that if a set cannot pass a test, all its supper sets will fail the same test as well.
Reducing the search space to avoid finding of each Lk requires one full scan of the database (Lk set of frequent k-item sets)
If an itemset I does not satisfy the minimum support threshold min_sup, the I is not frequent, P(I) <min_sup
If an item A is added to the item set I, then the resulting item set cannot occur more frequent than I, therefore I
∪ A is not frequent, P(I ∪ A) <min_sup.Apriori algorithm works well for the large dataset.
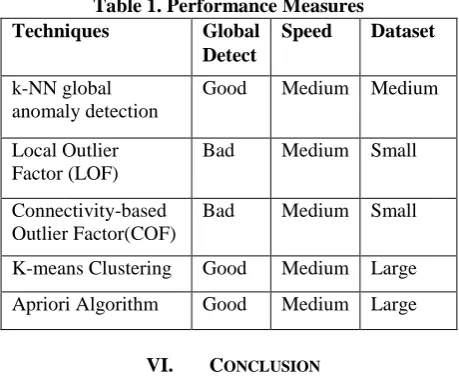
Table 1. Performance Measures Techniques Global
Detect
Speed Dataset
k-NN global anomaly detection
Good Medium Medium
Local Outlier Factor (LOF)
Bad Medium Small
Connectivity-based Outlier Factor(COF)
Bad Medium Small
K-means Clustering Good Medium Large
Apriori Algorithm Good Medium Large
VI. CONCLUSION
This survey focuses on various unsupervised anomaly detection techniques. As per the table 1. The techniques pertaining to nearest neighbour approach predicts both the local and global anomalies in the data. The high variance in clustering-based algorithms is very likely due to the non-deterministic nature of the underlying k-means clustering algorithm. For larger dataset clustering based algorithms are the better choice, where computation is faster. Nearest neighbour works well for most of the scenario. As a nutshell, this survey suggests that the choice of the algorithm must be solely based on the dataset considered for the application.
REFERENCES
1. Grubbs FE. Procedures for Detecting Outlying Observations in Samples. Technometrics. 1969; 11 (1):1–21. doi:
0.1080/00401706.1969.10490657
2. Portnoy L, Eskin E, Stolfo S. Intrusion Detection with Unlabeled Data Using Clustering. In: In Proceedings of ACM CSS Workshop on Data
Mining Applied to Security (DMSA-2001); 2001. p. 5–8.
3. Garcia-Teodoro P, Diaz-Verdejo JE, Macia-Fernandez G, Vazquez E. Anomaly-based network intrusion detection: Techniques, systems and
challenges. Computers and Security. 2009; 28:18–28. doi: 10.1016/j.cose.2008.08.003
4. Yeung DY, Ding Y. Host-Based Intrusion Detection Using Dynamic and Static Behavioral Models. Pattern Recognition. 2003; 36:229–243.
doi: 10.1016/S0031-3203(02)00026-2
5. Phua C, Lee V, Smith-Miles K, Gayler R. A Comprehensive Survey of Data Mining-based Fraud Detection Research. Clayton School of
Information Technology, Monash University; 2005.
6. Thiprungsri S, Vasarhelyi MA. Cluster Analysis for Anomaly Detection in Accounting Data: An Audit Approach. International Journal of
7. Bolton RJ, Hand DJ. Unsupervised Profiling Methods for Fraud Detection. Statistical Science. 2002; 17 (3):235–255.Sigholm J, Raciti M. Best-Effort Data Leakage Prevention in Inter-Organizational Tactical MANETs. In: Proceedings of IEEE Military Communications Conference (MILCOM 2012). IEEE Computer Society press 2012.
8. Lin J, Keogh E, Fu A, Herle HV. Approximations to Magic: Finding unusual Medical Time Series. In: In 18th IEEE Symposium on
Computer-Based Medical Systems (CBMS). IEEE Computer Society Press; 2005. p. 23–24.
9. Basharat A, Gritai A, Shah M. Learning Object Motion Patterns for Anomaly Detection and Improved Object Detection. In: Computer Vision
and Pattern Recognition. (CVPR 2008). IEEE Conference on. IEEE Computer Society Press; 2008. p. 1–8.
10. Goldstein M, Uchida S. Behavior Analysis Using Unsupervised Anomaly Detection. In: The 10th Joint Workshop on Machine Perception and
Robotics (MPR 2014). Online; 2014.
11. Pawling A, Chawla N, Madey G. Anomaly Detection in a Mobile Communication Network. Computational & Mathematical Organization
Theory. 2007; 13:407–422. doi: 10.1007/s10588-007-9018-7
12. Gebhardt J, Goldstein M, Shafait F, Dengel A. Document Authentication using Printing Technique Features and Unsupervised Anomaly
Detection. In: Proceedings of the 12th International Conference on Document Analysis and Recognition (ICDAR 2013). IEEE Computer Society Press; 2013. p. 479–483.
13. Martin RA, Schwabacher M, Oza NC, Srivastava AN. Comparison of Unsupervised Anomaly Detection Methods for Systems Health
Management Using Space Shuttle. In: Proceedings of the Joint Army Navy NASA Air Force Conference on Propulsion; 2007.
14. Siddharth S Rautaray and Anupam Agrawal. Vision based hand gesture recognition for human computer interaction: a survey. Arti_cial
Intelligence Review, 43(1):1-54, 2015.
15. Chandola V, Banerjee A, Kumar V. Anomaly Detection: A Survey. ACM Computing Surveys. 2009; 41 (3):1–58. doi:
10.1145/1541880.1541882
16. Hodge VJ, Austin J. A Survey of Outlier Detection Methodologies. Artificial Intelligence Review. 2004; 22(2):85–126. doi:
10.1023/B:AIRE.0000045502.10941.a9
17. Pimentel MAF, Clifton DA, Clifton L, Tarassenko L. A Review of Novelty Detection. Signal Processing. 2014; 99:215–249. doi:
10.1016/j.sigpro.2013.12.026
18. VarunChandola, Arindam Banerjee and Vipin Kumar. 2009. Anomaly Detection: A Survey To Appear in ACM Computing Surveys.09.Weiwei
Chen and Fangang Kong. 2017.
19. A Novel Unsupervised Anomaly Detection Approach for Intrusion Detection System. IEEE 3rd International Conference on Big Data Security
on Cloud.Abdul Samad bin Haji Ismail, Abdul Hanan Abdullah, Kamalrulnizam bin Abu Bak, MdAsri bin Ngadi, DahliyusmantoDah lan and WitchaChimphlee. 2008.
20. A Novel Method for Unsupervised Anomaly Detection using Unlabelled Data. International Conference on Computational Sciences and Its
Applications ICCSA.Peiguo Fu and Xiaohui Hu. 2016.
21. Biased-Sampling of Density-based Local Outlier Detection Algorithm. 12th International Conference on Natural Computation, Fuzzy Systems
and Knowledge Discovery (ICNC-FSKD).Tao Wang, Wenbo Zhang, Jun Wei and Hua Zhong. 2012.
22. Workload-Aware Online Anomaly Detection in Enterprise Applications with Local Outlier Factor. IEEE 36th International Conference on
Computer Software and Applications.ian Tang, Zhixiang Chen, Ada Wai-chee Fu and David W. Cheung. 2002.
23. Enhancing Effectiveness of Outlier Detections for Low Density Patterns.Springer-Verlag Berlin Heidelberg.R. Kumari, Sheetanshu, M.K.
Singh, R. Jha and N.K. Singh. 2016.
24. Anomaly Detection in Network Traffic using K mean clustering. 3rd Int’l Conf. on Recent Advances in Information
Technology.RAIT.VasserYasami, SiavashKhorsandi, Saadat Pour Mozaffari and ArashJalalian. 2018
25. An Unsupervised Network Anomaly Detection Approach by K-MeansClustering& ID3 Algorithms. IEEE.EhsanSaboori, ShafighParsazad and
YasamanSanatkhani,. 2010.
26. Automatic Firewall rules generator for Anomaly Detection Systems with Apriori Algorithm. 3rd International Conference on Advanced