ABSTRACT
RIDER, ROBIN LYNN. The Effect of Multi-Representational Methods on Students' Knowledge of Function Concepts in Developmental College Mathematics. (Under the direction of Hollylynne Stohl and Lee V. Stiff)
The purpose of this study was to investigate the potential benefits of a multi-representational curriculum on students’ understanding of and connections among graphical, tabular, and symbolic representations of algebraic concepts.
The participants of the study were 313 college students enrolled in developmental college algebra at two southern universities. This study utilized a quasi-experimental design in which instructors at one university (control) taught the course from a traditional algebraic perspective while instructors at the other
university (treatment) taught the course from a functional approach simultaneously introducing multiple representations.
The effect of a multi-representational curriculum on student success and representational preference was assessed with a pretests and posttests of five problems, each with three representations; graphic, tabular, and symbolic. The problems were chosen because of their prevalence in most developmental college algebra curricula. Although both curricula were successful in increasing student achievement, students from the multi-representational curriculum scored significantly higher and were significantly more adept in using representational methods other than algebraic to solve the problems.
THE EFFECT OF MULTI-REPRESENTATIONAL METHODS ON STUDENTS' KNOWLEDGE OF FUNCTION CONCEPTS IN
DEVELOPMENTAL COLLEGE MATHEMATICS by
ROBIN LYNN RIDER
A dissertation submitted to the Graduate Faculty of North Carolina State University
in partial fulfillment of the requirements for the Degree of
Doctor of Philosophy
MATHEMATICS EDUCATION Raleigh
2004
APPROVED BY:
Dr. Hollylynne Stohl
Co-chair of Advisory Committee
Dr. Lee V. Stiff
Co-chair of Advisory Committee
DEDICATION
This dissertation is dedicated to all my students. You have believed in me, inspired me, and touched my life forever. It was
a privilege to be your teacher.
BIOGRAPHY
Robin Lynn Rider was born in Millinocket, Maine on September 23, 1963, the daughter of Richard William Angotti, Sr. and Ruth Lane Jewell. After graduating from Stearns High School, Millinocket, Maine, in June of 1980, she ventured into the career world until moving to North Carolina and in 1984, entering the East Carolina University college transfer program at Carteret Technical College in Morehead City, North Carolina. She transferred to East Carolina University in Greenville, North Carolina in the fall of 1986 and received the degree of Bachelor of Science in
Mathematics, Magna Cum Laude, in 1988. In the fall of that same year, she began her graduate work at East Carolina University, receiving the degree of Master of Arts in Education in August 1990.
Upon graduation, Robin taught for two years as a lecturer in the Department of Mathematics at East Carolina University. In the fall of 1992, Robin began a career as a public high school teacher in rural eastern North Carolina. She earned National Board Certification in 1998 and entered the Ph.D. program in Mathematics Education at North Carolina State University in the fall of 2001, where her research efforts have focused on the use of multi-representational methods in developmental college mathematics.
Robin Rider is currently a faculty member at East Carolina University, where she is the Assistant Director of the Center for Science, Mathematics, and Technology Education, a position she has held since March 2003. While her primary
she has also had the opportunity to teach undergraduate and co-teach graduate level courses in Mathematics Education.
ACKNOWLEDGEMENTS
An old Chinese proverb says, “the journey is the reward”. For me, my journey through graduate school has been the reward of a lifetime; the degree is just a bonus. On this journey, I have been rewarded with incredible growth in my knowledge, reflection on my character, and insight into friendships. God has blessed my time and my effort is so many ways other than just the attainment of a degree, and I thank Him daily.
None of this would have been possible if it had not been for the friendship, guidance, professionalism, time, and advisement of Dr. Hollylynne Stohl. Her incredible drive and acumen as my advisor and her faithfulness as my friend have taught me about the kind of mentor I want to be. She is an incredible human being and it has been a privilege to work with her.
I would also like thank the rest of my committee: Dr. Lee Stiff, who has given me the right amount of encouragement and guidance while giving me plenty of space to find my own way; Dr. Jason Osborne, who has always believed in me and has taught me so much about statistics by asking the right questions and, with plenty of wait time, letting me come up with the answers on my own; and Dr. Ron Tzur, who has pushed me to reach higher levels than I ever thought I could attain. It has been a privilege to be a student of each one of you. I owe you a great debt of gratitude.
me, encouraged me, listened to me cry, and have been totally supportive. Thanks for seeing in me what I did not see in myself.
My students taught me that every child could learn but that it was up to me as the teacher to find the right way to get it across to them. I thank them for everything they taught me about teaching from multiple perspectives.
I also want to thank all my colleagues at D. H. Conley High School in Greenville, North Carolina. You have fanned the flames of my desire to make a difference in the lives of professional teachers. You have inspired me, accepted me, and shown me unconditional love. Special thanks to all my friends who are past or present faculty in the math department who all taught me aspects of how to be a great math teacher.
My friends and colleagues at East Carolina University have been invaluable to me as I have completed this degree. I would like to thank my boss Dr. Karen Dawkins and my dean Dr. Marilyn Sheerer for their endless support and for giving me a job. I would like to thank my “girls” at the center, Shelley Leach, Dionna Manning, and Sandy Martin, for having patience to listen to me complain and help me through the tears as I finished this dissertation. I couldn’t have done it without you. I would also like to thank Dr. Linda James and Dr. Sunday Ajose, my colleagues in the
Department of Mathematics and Science Education for their advice and to Dr. Said E. Said, my teacher, my mentor, and my friend for instilling in me a love of statistics.
provide me with students to interview. Without their help and cooperation, this wouldn’t have been possible.
I want to thank my officemates and fellow graduate students at North Carolina State University, who were always there for me, through the good and bad of
graduate school. Being in Raleigh and away from the emotional support of my family, they became my family. To Eleanor Pusey, I will remember our lunch talks for the rest of my life. To my African connection, Kwaku Adu-Gyamfi, who inspired me to make a difference globally, I can’t wait to visit him in Ghana when he works on his dissertation. To Paula Johnson, who shared her apartment with me and kept me balanced. To Mark Anderson, whose faith in God and in my teaching advice always amazed me. Finally, thanks to C. E. Davis, Maria Droujkova, and Michele Longest for standing by me.
None of this would have been possible if it hadn’t been for my parents, Richard Angotti and Ruth Jewell. They gave me the intelligence and raised me with the character to be able to finish this degree and be proud of what I accomplished. I also owe a debt to my father and mother-in-law, Jim and Sue Rider for their support and encouragement.
my brother-in-law Dr. Mike Bossé for listening and understanding of what I was going through. I especially want to thank Mike for all the reading he did, advice he gave me, and mentoring he did, which has helped to make me a better researcher.
Thanks to my North Carolina connection: Jesse, Roy, and Billy Jewell, for always reminding me where my roots were. They kept me grounded. In addition, to my best and dearest friend Susan Childress and her husband Mark. Susan, you have always believed in me, even when I was dragging you through the woods of
Shenandoah. I will always be there for you.
Finally, I would like to thank my immediate family. My husband, best friend and soul mate, Dinh Rider, who gave me the encouragement, unconditional love, and support to pursue this degree. To my wonderful son, Patrick, who provided me with other things to worry about so I wouldn’t be stressed over graduate school. I don’t know too many other 19-year-olds who would let their mom move in with them and three roommates.
TABLE OF CONTENTS
LIST OF TABLES……… xii
LIST OF FIGURES………...…… xiv
CHAPTER 1 – Introduction…...…………...………. 1
Importance of Multiple Representations……….. 5
Functions... 6
Reform of Developmental College Mathematics... 9
Technology... 10
Problem Statement... 11
CHAPTER 2 – Review of Literature... 14
Research on Multiple Representations of Functions... 15
Connections Among Representations... 20
Student Preference for Representations... 25
Research on Teaching Practices... 28
Graphing Calculators... 28
Impact of Teacher Understanding and Teaching Practices on Reform Curriculum... 31
Changing Assessment Practices... 35
Constructivist Mathematics Teaching... 36
Conceptual Framework... 38
Questions and Specific Hypothesis... 45
Curricular Impact... 46
Student Understanding... 47
CHAPTER 3 – Methodology... 49
Pilot Study... 49
Current Study... 52
Instructional Support at University 1... 53
Instructional Support at University 2... 54
Part I: Quantitative Methods... 56
Test Instrument... 56
Participants... 57
Data Analysis... 58
Part II: Qualitative Methods... 61
Design of Protocol... 61
Data Collection... 62
Hypothesis... 68
Possible Constraints... 69
CHAPTER 4 – Results... 70
Part I: Quantitative Methods... 71
Overall Results... 72
Results by Question... 81
Measures of Success... 84
Measures of Flexibility... 86
Question 1... 87
Question 2... 87
Question 3... 88
Question 4... 90
Question 5... 91
Summary... 91
Part II: Qualitative Methods... 93
Examples of Analysis... 94
Example 1: Student 6, Problem 2... 94
Example 2: Student 8, Problem 5... 98
Overall Summary of Results... 102
Analysis of Interview Data by Question... 104
Question 1... 104
Question 2... 107
Question 3... 111
Question 4... 114
Question 5... 118
Classification of Individual Students... 121
CHAPTER 5 – Summary, Conclusions, Discussion, and Recommendations. 123
Summary and Conclusions... 124
Research Question 1... 125
Research Question 2... 127
Research Question 3... 128
Research Question 4... 129
Research Question 5... 130
Overall Conclusions... 131
Discussion... 133
Discussion of the Use of Multiple Representations... 133
Discussion of the Use of the SOLO Taxonomy... 137
Recommendations... 139
Future Research Considerations... 140
Toward a Theory... 141
Final Thoughts... 145
REFERENCES... 147
APPENDICES... 160
Appendix A – Test Instrument... 161
Appendix B – Syllabus of Concepts Taught at University 1... 166
Appendix C – Syllabus of Concepts Taught at University 2... 168
Appendix D – Rubric for Grading Pretests and Posttests... 170
Appendix E - Interview Protocol... 172
LIST OF TABLES
Page
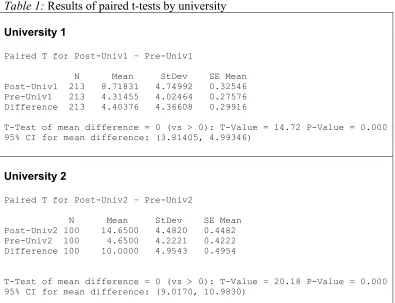
Table 1 Results of paired t-tests by University... 75
Table 2 Minitab results of two-sample t-tests comparing universities... 78
Table 3 Concordant and discordant pairs of representations at
University 1... 80
Table 4 Concordant and discordant pairs of representations at
University 2... 80
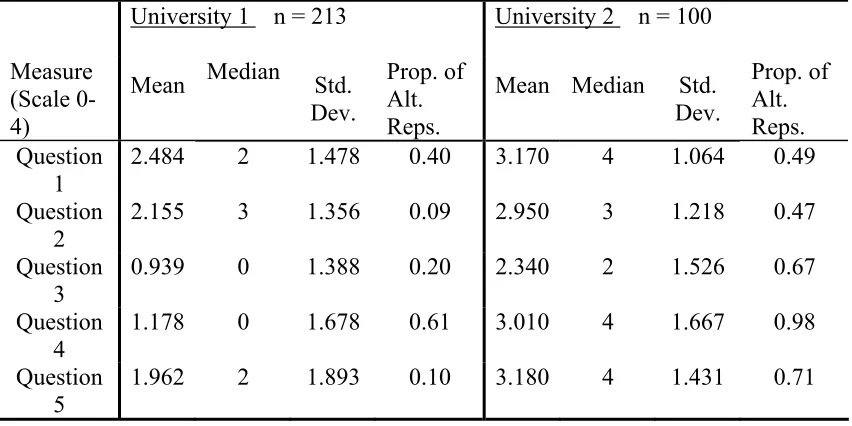
Table 5 General descriptive statistics of pretest scores by question... 83
Table 6 General descriptive statistics of posttest scores by question... 83
Table 7 Results of Wilcoxon signed rank test for University 1
by question... 84
Table 8 Results of Wilcoxon signed rank test for University 2
by question... 85
Table 9 ANOVA results for regression of proportions of alternate representations used vs. average score by problem for control
group (University 1)... 92
Table 10 ANOVA results for regression of proportions of alternate representations used vs. average score by problem for treatment
group (University 2)... 92
Table 11 Summary results for University 1 – Problem 1 – Slope and
y-intercept of a linear function...106
Table 12 Summary results for University 2 – Problem 1 – Slope and
y-intercept of a linear function...107
Table 13 Summary results for University 1 – Problem 2 – Solving a
system of linear equations...109
Table 14 Summary results for University 2 – Problem 2 – Solving a
Table 15 Summary results for University 1 – Problem 3 – Factoring a
polynomial...112
Table 16 Summary results for University 2 – Problem 3 – Factoring a
polynomial...113
Table 17 Summary results for University 1 – Problem 4 – Identifying a
function...116
Table 18 Summary results for University 2 – Problem 4 – Identifying a
function...117
Table 19 Summary results for University 1 – Problem 5 – Solving a
quadratic equation with rational zeros...119
Table 20 Summary results for University 2 – Problem 5 – Solving a
quadratic equation with rational zeros...120
Table 21 SOLO Taxonomy rubric for question 1 – Finding the slope
and y-intercept of a line...174-175
Table 22 SOLO Taxonomy rubric for question 2 – Solving a system
of equations...176-177
Table 23 SOLO Taxonomy rubric for question 3 – Factoring a
polynomial...178-179
Table 24 SOLO Taxonomy rubric for question 4 – Identifying a
function...180-181
Table 25 SOLO Taxonomy rubric for question 5 – Solving a quadratic
LIST OF FIGURES
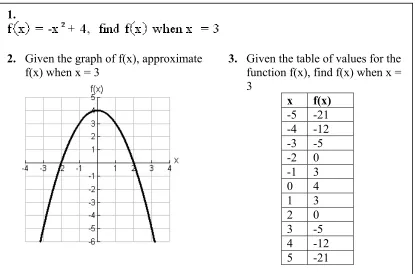
Page Figure 1 An example of a question presented in 3 different forms
using multiple representations of functions...3
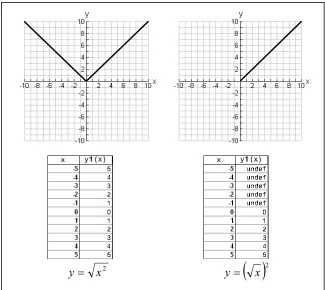
Figure 2 Multiple representations of two square root functions...19
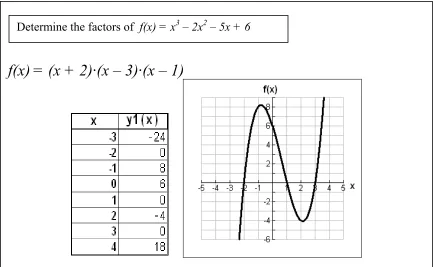
Figure 3 An example of utilizing multiple representations to highlight connections when teaching the Factor Theorem...21
Figure 4 Webs of linked representations of a quadratic function...41
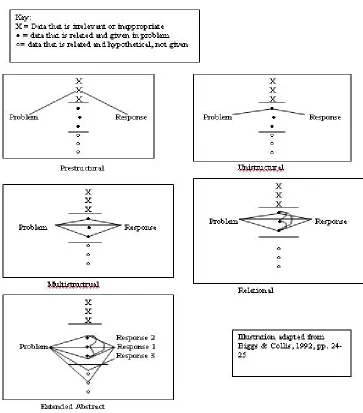
Figure 5 The levels of the SOLO Taxonomy...44
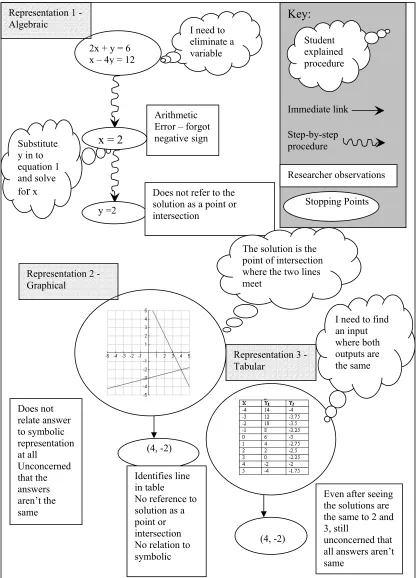
Figure 6 Concept diagram of student’s response...64
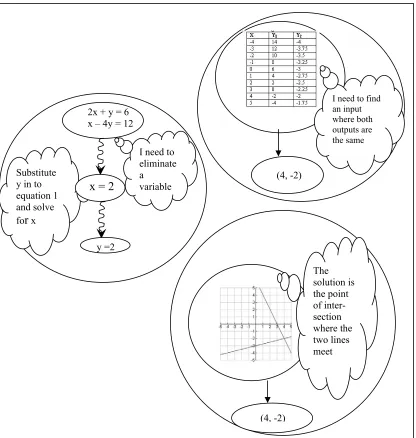
Figure 7 Three unconnected representations...65
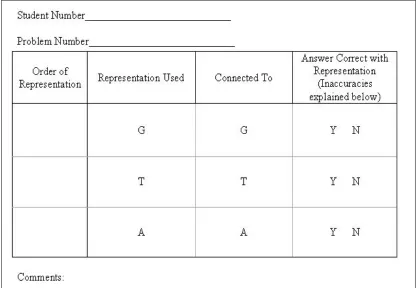
Figure 8 Student summary sheet...66
Figure 9 Normal probability plot of the differences in pretest and posttest scores for University 1...73
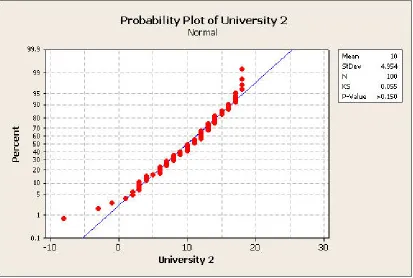
Figure 10 Normal probability plot of the differences in pretest and posttest scores for University 2...73
Figure 11 Concept diagram for Student 6, Problem 2, and Representation 1 .... 95
Figure 12 Summary sheet for Student 6, Problem 2...98
Figure 13 Concept diagram for Student 8, Problem 5, and Representation 1...99
Figure 14 Concept diagram for Student 8, Problem 5, and Representation 2....100
Figure 15 Concept diagram for Student 8, Problem 5, and Representation 3....100
Figure 16 Summary sheet for Student 8, Problem 5...101
Figure 17 Boxplots of student levels on the SOLO Taxonomy by school and question...103
Figure 19 An example of a zoomed out lens on student understanding
CHAPTER 1 Introduction
Traditionally, pre-college algebra and developmental college algebra are taught with an emphasis on algebraic manipulation. Individual concepts are taught in isolation with little connection to each other. Skemp (1987) describes this type of understanding as instrumental and characterizes it as “rules without reasons” (p. 153). Although students and teachers who understand content instrumentally can perform a procedure and produce a correct answer, they may not truly understand the how or why of what they are doing. Skemp contrasts this type of understanding with relational understanding which he characterizes as “knowing both what to do and why” (p. 153). Almost a decade after the release of national curriculum reforms at both the pre-college and college levels which advocate moving away from teaching only manipulation skills to a more robust and connected understanding of algebra (National Council of Teachers of Mathematics, NCTM, 1989; Cohen, 1995), the majority of pre-college and developmental college algebra courses still employ a traditional approach which promotes instrumental understanding.
visualization of the function, without much further exploration of that graphical representation. Students taught in this way may perceive algebra as a study of equations, made up of rules and procedures which need to be memorized (Boaler, 1998).
In science classrooms, by contrast, a student’s experience can be quite different from a traditional mathematics classroom. Science students are often asked to interpret graphs and tables of data. Rarely does a science teacher present students with an equation. The teacher may give the students a graph of population based on time and ask the students to determine the population at three years. Essentially, the concept is the same as in the case of the traditional mathematics example: finding an output value from a given input value. The representation of the problem presented to the students is different. This difference in instructional approaches can lead students to conclude that mathematics and science are not related because they are
approaching the concept of function from different representational perspectives. One way this trend may be overcome is to teach mathematics from multiple representational perspectives. The NCTM (1989, 2000) advocates utilizing multiple representations of mathematical concepts to build connections among algebraic, tabular, and graphical representations in grades Pre K through 12. Crossroads in Mathematics (Cohen, 1995), a document that outlines curriculum for college
mathematics below calculus, advocates the same for developmental college
presented at the same time as the algebraic with connections made among the representations (Figure 1). Each representation, though mathematically equivalent, requires a different type of thought process about input and output variables (Eisenberg, 1992; Janvier, 1987). Understanding what to do and why (relational understanding) with each representation shows a higher degree of concept formation than knowing procedurally what to do (instrumental understanding) with a
representation. When viewed together, the representations make input and outputs of functions more salient than any one representation alone.
Many teachers of developmental college mathematics have observed that employing a traditional teaching approach has had limited success in student achievement in both two and four-year college situations (Laughbaum, 1992).
1.
2. Given the graph of f(x), approximate f(x) when x = 3
3. Given the table of values for the function f(x), find f(x) when x = 3
x f(x) -5 -21 -4 -12 -3 -5 -2 0 -1 3 0 4 1 3 2 0 3 -5 4 -12 5 -21
Students in developmental mathematics courses have typically been through at least two pre-college algebra courses in secondary school and have still not mastered the material, a situation that necessitates their placement in developmental mathematics as their first college-level course. These students have shown that they do not grasp the material from a traditional perspective of manipulating algebraic representations. Although suggestions for using alternative methods abound, college departments of mathematics have been slow to embrace these methods with most instructors relying on traditional teaching methods.
One teaching approach that has been advocated is to teach developmental mathematics from a functional perspective, utilizing calculator or computer technology to rapidly produce multiple representations of functions (Conference Board of the Mathematical Sciences, CBMS, 2000). Teachers who have employed these methods believe students gain flexibility in their problem solving and make more connections among representations. These students should be more successful than their traditionally-educated counterparts, though there has been mixed empirical research to support these beliefs (Even 1998; Knuth, 2000a; Knuth, 2000b;
Thompson, 1994). A major confounding variable in studies of curricula using multiple representations has been student preference for a particular representation and their unwillingness to utilize a different representation (Keller & Hirsch, 1998; Knuth, 2000a).
Empirical research needs to be conducted to examine the effects of a
on student achievement in developmental college mathematics. Such research should consider instructional techniques that utilize calculator or computer technology to produce representations and highlight the connections among them. The research also needs to address whether students can overcome preferences toward a specific
representation and gain greater understanding of mathematical concepts by employing different representations. Such research could then inform colleges in instructional and curricular choices regarding developmental mathematics programs. Importance of Multiple Representations
College-level developmental mathematics curricula contain concepts and skills typically taught in secondary school. Thus, curriculum recommendations for secondary school mathematics are often used to inform curriculum and instructional decisions for these lower level college courses. The NCTM (1989, 2000) has
advocated a K-12 curriculum which stresses mathematical connections among
representations. Even for children in grades 5-8, NCTM’s Curriculum and Evaluation Standards for School Mathematics (1989) suggest that students use graphical,
process that requires students to be able to represent and analyze functions with the representations and translate among them.
In 1989, the NCTM felt that “students who are able to apply and translate among different representations of the same problem situation or of the same mathematical concept will have at once a powerful, flexible set of tools for solving problems and a deeper appreciation of the consistency and beauty of mathematics” (p. 146). The NCTM’s (2000) most recent document, Principles and Standards for School Mathematics also reflects an increased emphasis on representations by adding
a “Representation” standard and expanding on expectations for students in grades 9-12. This change reflects a belief by mathematics educators that students’
understanding will be enriched from connecting multiple representations of the same mathematical concept.
Making connections among mathematical concepts and representations of those concepts is critical in developing relational understanding because “knowing how they are inter-related enables one to remember them as parts of a connected whole which is easier” (Skemp, 1987, p. 159). Not only does Skemp suggest that connections among the representations make the mathematics easier to understand but also easier to recall.
Functions
The function concept is a central theme in mathematics and serves a
which there is a relationship or co-variation between two or more variables. The function concept is uniquely suited to this use because it can be regarded as “a set of ordered pairs, a correspondence, a graph, a dependent variable, a formula, an action, a process, or an object (entity)” (p.4). To develop a rich understanding of the function concept and its uses, one must have a rich understanding of all the ways in which it is possible to represent functions and to be able to move from one view to another.
Therefore, “a major goal of the secondary and collegiate curriculum should be to develop in students a sense for function” (Eisenberg, 1992, p. 154). A part of this sense for function is the ability to interpret different representations of functions. Eisenberg stresses that an ability to make connections between graphical and analytical representations of functions are a main component of a robust
understanding of the function concept. Indeed, this idea seems to be supported by the emphasis on functions and representations of functions in the Mathematics
Framework for the 2003 National Assessment of Educational Progress (NAEP) (National Center for Educational Statistics, NCES, 2003).
This idea of using and translating among representations of a concept has been defined by Lesh, Post, and Behr (1987) as a critical part of a student’s understanding. A student can be thought of as having an increased understanding if:
In order for students to develop an understanding that allows them to compare and translate among representational illustrations of functions, they must develop a strong process conception of functions (Dubinsky & Harel, 1992). When a student possesses a process conception of functions they view the different representations as different forms of the same entity. Students who have not yet reached the process conception view the different representations as different entities, not just different forms of the same function. With a process conception, students are able to begin with one
representation and transform it to another representation and reverse the process. This process conception is complex and students may have a wide variety of levels of development of their conception of functions.
Research on students’ conceptions of functions has shown significant
problems in students’ understanding. This lack of understanding has been linked to a curriculum that fails to make connections among representations or to teach
techniques to help students deal with different representations, and strengths and weaknesses that each representation employs (Brenner et al., 1997; Knuth, 2000a; Moschkovich, Schoenfeld, & Arcavi, 1993; Piez & Voxman, 1997). Such a
curriculum does not teach toward developing a process conception. Since the NCTM (1989, 2000) has promoted curricula which make connections and emphasize
calculus are not making the connections among the representations of functions (Knuth, 2000a; Knuth, 2000b).
Reform of Developmental College Mathematics
The American Mathematical Association of Two-Year Colleges (AMATYC) produced a document similar to the NCTM (1989) Standards as a guide for all college courses below calculus. This document, called Crossroads in Mathematics (Cohen, 1995), outlined three sets of standards for developmental college
mathematics courses: intellectual development, content, and pedagogy. As in the NCTM (1989, 2000) and NAEP (NCES, 2003), Crossroads advocated a curriculum that emphasized functions through multiple means: graphic, numeric, algebraic, and verbal. It also stressed that students be taught to translate from one representation to another. This ability to transfer and make connections among representations builds mathematical power, which was the goal of the AMATYC standards.
Although many developmental mathematics courses use a traditional
approach, there has been research suggesting that employing methods recommended by NCTM (1989, 2000) and AMATYC (Cohen, 1995) may improve student
performance in developmental mathematics (Crowley, 2001; Hollar & Norwood, 1999; McGowan & Tall, 1999). This improved performance has been attributed to reform curriculum in developmental mathematics that integrates technology with a functional approach and de-emphasizes procedures. These studies support a
contention that developmental mathematics curricula should be changed (Crowley, 2001; Laughbaum, 2003; McGowan & Tall, 1999). Research has suggested that instructional methods also significantly affect what students learn (Brophy & Good, 1986; Patterson, 2002). Therefore, in order to implement new curricular methods, instructional strategies must also change to support them.
Technology
Research has produced mixed results on the effectiveness of graphing
calculators. These mixed results have been linked to the teacher and teachers’ beliefs about the usefulness of technology in teaching mathematics. Research has shown that teachers’ attitudes toward technology and how it is used in classrooms have a
dramatic effect on how students perceive use of technology as a tool for learning (Doerr & Zangor, 2000; Patterson, 2002). In their review on the research on graphing calculators, Penglase and Arnold (1996) found that much of the research did not consider factors such as learning environments, teaching methods, or assessment measures used in classrooms incorporating graphing calculators. Consequently, they found contradictory results in the research. Research involving the use of graphing calculators in the classroom must consider these influences.
Problem Statement
After a decade of curriculum reform, students entering universities with several years of exposure to algebra in the high school curriculum still have limited knowledge of connections among different functional representations: algebraic, tabular (numeric), and graphical (Knuth, 2000a). Studies that have compared
effectiveness of utilizing graphing calculators to generate representations on student success in developmental algebra have shown mixed results, but many have not taken into consideration pedagogical methods or assessment practices of teachers (Doerr & Zangor, 2000).
rarely directly taught in mathematics classrooms and it was believed that this may have contributed to misconceptions that students held about function concepts (Brenner et al., 1997; Knuth, 2000a; Moschkovich et al., 1993; Piez & Voxman, 1997). Some of the areas of misconceptions included: translating among algebraic, tabular, and graphical representations of functions, understanding the correspondence among the representations, and interpreting the graphical and tabular representations (Galbraith & Haines, 2000).
Studies suggested that students would return to an algebraic representation to solve problems even when an available alternate representation would provide an easier route to find a solution (Keller & Hirsch, 1998; Knuth, 2000b). Reasons for this choice may have included student preference for a particular representation (Knuth, 2000b; Piez & Voxman, 1997) or a curriculum that focuses on algebraic and verbal representations with limited time on tabular and graphical representations (Yerushalmy & Schwartz, 1993).
indicate a student was moving toward a process conception of function (Dubinsky & Harel, 1992) and toward relational understanding (Skemp, 1987). Since connections among representations has been identified as a major factor in students developing a robust understanding of functions, studying students’ connections among
CHAPTER 2 Review of Literature
As noted in Chapter 1, the function concept has been distinguished as a primary theme in mathematics (Selden & Selden, 1992). Although students may have arrived at the college level with several years of high school mathematics, many aspects of the function concept have continued to be problematic for developmental college mathematics students to master. Current reform efforts of pre-college and college mathematics have attempted to rectify this by focusing attention on students’ exposure to mathematical concepts and de-emphasizing mathematical procedures (NCTM, 2000; Cohen, 1995). This literature review examined the research related to some of the mathematical concepts that developmental college mathematics students have difficulty understanding and curriculum factors that contribute to these
conceptual difficulties. This was an appropriate starting point to examine the effect of a curriculum which considers alternate methods of instruction to overcome these difficulties.
The first section of this literature review looked at research to provide a rationale for a curriculum which employed multiple representations of functions and stressed the connections among representations. Research has attributed this type of curriculum to ameliorating student difficulties in making connections among
representations and affecting student preference for a particular representation. These two aspects have been major stumbling blocks in student understanding of the
connections and preferences. In order for any curriculum to be effective, research on teaching practices such as assessment and use of technology should be considered to determine the most effective curricular methods. This literature review also examined how teachers understanding and beliefs affected their use of reform curriculum strategies. All of these areas had an effect on the conceptual framework for the present study which follows at the end of this literature review.
Research on Multiple Representations of Functions
"The term representation refers both to process and to product - in other
words, to the act of capturing a mathematical concept or relationship in some form and to the form itself" (NCTM, 2000, p. 67). The process referred to by NCTM was both the internal way mathematical concepts were perceived by a learner and the external way they were portrayed as a representation of the learner’s conception. This process highlighted how teachers and students externalized and internalized algebraic thinking and how they made connections among different representations in algebra.
2000, p. 361) research on the effective use of multiple representations in fostering mathematical thinking has required delving into the way students' perceptions of each representation affects their ability to solve a problem.
The NCTM (2000) suggested that students should be able not only to “select, apply, and translate among mathematical representations to solve problems” (p. 66) but also to “understand how mathematical ideas interconnect and build on one another to produce a coherent whole” (p. 63). Many mathematics educators and researchers shared a common belief that a curriculum utilizing multiple
representations enhanced student understanding of mathematical topics. According to Keller and Hirsch (1998), using multiple representations had the following potential benefits: “providing multiple concretizations of a concept, selectively emphasizing and de-emphasizing different aspects of complex concepts, and facilitating cognitive linking of representations thereby creating a whole that is more than the sum of its parts" (p.1).
among representations and employ alternate procedures were more successful than students who chose only one type of representation with which to work.
Expectations of teaching an algebra curriculum which emphasized functions with multiple representations, even conventional representations of graph, table, and algebraic, were such that students would be able to use these representations as tools. These representational tools would allow students to choose the most appropriate representation for a problem situation and to understand why the chosen
representation was selected over another. “All these expectations suppose that the learner has 'grasped' the representations; that he knows the possibilities, the limits, and the effectiveness of each" (Dufour-Janvier, Bednarz, & Belanger, 1987, p. 111). Dugdale (1993) suggested that students who have developed a collection of different techniques and could apply those techniques to typical problems would be more capable of dealing with new situations because they were not limited to just one approach. Yerushalmy and Schwartz (1993) argued that “allowing students to use a rich set of operations, some of which operate on functions symbolically and some of which operate on functions graphically, builds a deeper and richer understanding of the mathematics" (p. 42). These suggestions were corroborated by the findings of McGowan and Tall (2001) that students were more successful when they could utilize alternate procedures and efficiently translated among representations.
representation made a concept more salient than another representation. Emphasizing differences as well as similarities allowed students to connect representations to each other, broadening their understanding of functions (Dufour-Janvier et al., 1987; Noble et al., 2001). For example, one concept that is problematic for students is the domain and range of a square root function. By considering the symbolic representations of
the functions y =
( )
x2 andy =( )
x 2, a teacher can emphasize verbally that the firstequates to y = x whereas the second equates toy=x iff x≥0. The power of
multiple representations allows students to view a graph of each of the functions to visualize the difference and then examine the corresponding tabular representation (Figure 2). The concepts of domain and range are more salient from a graphical and tabular perspective, which gives students a powerful referent for the absolute value when compared with square root functions of squared variables and for the
Although there have been many strong arguments toward a curriculum involving multiple representations, particularly when teaching functions, there have also been some concerns among researchers in adopting such a curriculum.
Thompson (1994) advocated that “we orient ourselves toward developing conceptual
curricula - curricula that are mathematically sound, but nevertheless are constructed from the start with an eye to building students' understandings, and are constructed to assess skill as an expression of understanding" (p. 24). He noted that a curriculum that involves multiple representations but failed to make a connection among those representations becomes equivalent to a traditional curriculum in which each of the
representations became just another procedure to be learned.
y= x2 y=
( )
x 2Connections Among Representations
Using multiple representations to make connections among graphical, tabular, and symbolic descriptions of problem situations has been regarded as an aspect critical to the development of functional understanding (NCTM, 2000). Developing connections among representations of functions was stressed by mathematics educators and researchers in addition to procedural knowledge and underlying concepts (Stein, Baxter, & Leinhardt, 1990).
Thompson (1994) suggested that functions are not represented by what was commonly thought of multiple representations but rather representations provided a method for highlighting connections. An example clarifying Thompson’s point is the treatment of the Factor Theorem of polynomials. The Factor Theorem states that a
polynomial P(x) has a factor of ‘x - c’ if and only if P(c) = 0. When the factor
theorem is typically taught, teachers emphasize that ‘x – c’ is a factor of P(x) if and
only if c is a zero of P(x) by writing the theorem out symbolically. This has little
The study of links or connections that students make among and between representations has been an area in the study of functions in which research was lacking (Knuth, 2000a). In a significant publication on the research of graphical functions, Romberg, Carpenter, and Fennema (1993) suggested that "a coherent body of knowledge about how the connections are developed among tables, graphs, and the algebraic expressions related to functions is desperately needed" (p. ix). A decade later, there still seemed a need for this knowledge contribution.
Although multiple representations have been assumed to be stressed in
secondary education, many students entering college had little or no understanding of the connections among representational forms (Knuth, 2000a; Galbraith & Haines,
f(x)
= (x + 2)·(x – 3)·(x – 1)
Determine the factors of f(x) = x3 – 2x2 – 5x + 6
2000). Thus, at a collegiate level, developmental mathematics students were especially prone to having difficulty making connections among multiple
representations of functions. Yerushalmy and Schwartz (1993) attributed this lack of connection to the order in which the representations are taught.
Within the traditional process of learning algebra in the secondary schools, the learning of graphs of functions usually occurs after a long period of numerical and symbolic manipulations and is normally introduced as a final stage of the subject. We think it is quite likely that certain difficulties observed in the understanding of functions in various representations (numerical, visual, and symbolic
representations) might be grounded in this form of learning (p. 43). There has been little research on whether a curriculum where each of the three representations - graphical, tabular, and algebraic - were introduced simultaneously throughout the curriculum was any better at helping students make the connection among representations than a typical curriculum. Knuth (2000a) contended that an issue in students’ ability to make connections dealt with the fact that the typical connection often consists of beginning with an algebraic representation and ending with the graphical representation. Knuth suggested that understanding both directions, algebraic-to-graph and graph-to-algebraic, was fundamental to developing the
flexibility to move among the representations.
However, teachers’ reluctance for using visual methods may have hindered students’ willingness to use a graphical representation to solve problems. Janvier (1987) contended that different cognitive processes are involved in translating from one representation to another in a different order. As a result, the direction of the connections among representations may have made one representation easier to use than another for different individuals.
McGowan and Tall (2001) characterized these connections among
representations as conceptual (the representations can be thought with and thought about) as opposed to procedural (doing something with the representation). This related to Skemp’s (1987) terminology of relational (conceptual) verses instrumental (procedural) understanding. A student who displayed flexibility and could move back and forth among representations displayed conceptual understanding whereas a student who could only move one way had an instrumental understanding and knew a procedure to follow to produce an answer. McGowan and Tall (2001) also suggested that an inability to move flexibly among representational forms caused a conceptual gap that would keep a student from progressing further until that gap was bridged.
move between algebraic and graphical representations" (p. 506). Since different representations emphasized different features of the function concept, the ability to move flexibly among representations was critical in students being able to choose the representation that will facilitate their ability to most efficiently solve a problem (Dufour-Janvier et al., 1987; Dugdale, 1993; Kaput, 1987; Keller & Hirsch, 1998; Knuth, 2000a; Moschkovich et al., 1993). For example, in the Factor Theorem example previously highlighted in Figure 3, the graph displays the end behavior of a cubic polynomial as well as the shape, approximate zeros, and local extremes. The tabular representation shows the exact zeros as well as a numerical change in the independent and dependent variables. The algebraic representation shows the actual factors of the polynomial. As students gain experience with the different
representations and the connections among them, their flexibility in moving among them and choosing the best representation for the problem situation will grow.
Recognizing the equality of procedures that can be used with different
representations was described as the first ability needed to have a “property-oriented”
view of functions (Galbraith & Haines, 2000; Slavit, 1996). “It is the
property-oriented view that is most needed when linking algebraic and graphical
representations, and that the difficulties in this area that have been reported in so many studies suggests that such a view is substantially absent from student understanding” (Galbraith & Haines, 2000, p. 654). For example, if a student
property-oriented view. This would allow the student to make the connections between the two procedures and the relevant properties of each representation needed to solve the task.
Although support has been strong for students' use of multiple representations in learning mathematical and algebraic concepts (Brenner et al, 1997; Janvier, 1987; Noble et al, 2001), there have been legitimate concerns about using too many
representations and causing more confusion than understanding (Dufour-Janvier et al., 1987; Noble et al, 2001). If the connections were not highlighted and students were only shown the representations as separate procedures, the number of procedures they needed to perform increased (Thompson, 1994). Thus, their
knowledge of functions was not enhanced, but constrained by the representations and this may have greatly influenced students’ preference for using different
representations.
Student Preference for Representations
Student preference for the algebraic representation has been identified as a major influence in their unwillingness to use an alternate representation even when one was readily available and perhaps easier to use (Knuth, 2000a; Piez & Voxman, 1997). This partiality to the algebraic representation has been observed even when a curriculum emphasized multiple representations of functions (Knuth, 2000a;
and curriculum emphasis (Knuth 2000a; Keller & Hirsch, 1998; Yershalmy & Schwartz, 1993).
Yershalmy and Schwartz (1993) found that one of the most significant influences on students’ preference of representation used to solve a problem was an instructional emphasis on the manipulation of the algebraic representation. Students often viewed graphs as end-products or something extra that was unconnected to the algebraic representation. Traditional curricula emphasized an equation-to-graph direction in teaching functional representations. This method may have hindered a student’s ability in seeing the graph as a viable means for solving a problem (Knuth, 2000b). This was emphasized in a study by Keller and Hirsch (1998) where “the choice of representation may well have been constrained by the individual's
perception as to whether the necessary procedural skills were in hand to successfully manipulate the choice of representation” (p. 3).
Experience strongly influenced what representation a student chose to use to solve a problem (Keller & Hirsch, 1998). “Because each representational format has varying limitations or strengths in different contexts, it is beneficial to have the choice of which representations to employ and the knowledge needed to make such a
choice” (Lloyd & Wilson, 1998, p. 253). For students to have this choice and this knowledge, they must have had experience with each different type of representation. Keller and Hirsch (1998) pointed out that there were many factors influencing
symbolic manipulation, experience, perception of the viability of the representation as an option, and complexity of the symbolic information.
Keller and Hirsch (1998), when studying student preference, used a multiple choice preference test, where the answer choices designated which representation the students would use to solve the problem. Keller and Hirsch felt that the initial choice a student had for a representation was the first step in understanding the connections that students made among the representations. Due to the nature of the testing instrument, this study did not address whether the students were able to solve the problems. Thus, a question left unanswered was whether the students were making the choice of representation based on their knowledge of actually how to solve the problem or just choosing a convenient answer choice without any contemplation of how to solve the problem.
Research on Teaching Practices
Graphing Calculators
A large body of research has been published that suggested using graphing calculators as tools in mathematics classrooms had the potential to increase students’ understanding of functions, the connections among representations of functions, and the flexibility to move among the representations (Dick, 1992; Fey, 1992; Hollar & Norwood, 1999; O’Callaghan, 1998). Graphing calculators allowed student and teacher to easily produce multiple representations of a function. This could be used to highlight features of each representation and to illuminate invariance among them, building students’ flexibility to move among different representations. The teacher was instrumental in these endeavors by using the technology to produce simultaneous representations and discussing the strengths and weaknesses in each as well as the connections among them. Studies in which teachers continued to use traditional methodology when incorporating graphing calculators showed that the calculator only provides more visual examples but did little to increase student understanding
(Simmt, 1997).
Many researchers felt that graphing calculators could be a catalyst for
informally assess mathematical understanding in students (Adams, 1997). This discourse did not occur, however, without changing roles for both students and teachers. It required students to take a more active part in learning and teachers to act more as a facilitator and partner than as the authoritarian (Forster & Taylor, 2000; O’Callaghan, 1998). One of the strongest influences on the way calculators are used as tools in classrooms was the belief of the teacher that the tool can enhance
mathematical understanding. This belief stemmed from teachers perspectives about mathematics and mathematics education (Doerr & Zangor, 2000; Patterson & Norwood, in press).
In a careful review of the literature, Penglase and Arnold (1996) highlighted the fact that many studies on the use of graphing calculators in the classroom failed to look at the instructional context in which the tool was used. Researchers found that most studies on the effects of incorporating graphing calculators into curriculum did not take into consideration how and why students were using the calculators (Adams, 1997; Ruthven, 1990) nor the relationship between teachers’ mathematical and pedagogical beliefs and attitudes about using calculators (Drijvers & Doorman, 1996; Hollar & Norwood, 1999; Van Streun, 2000). It has been suggested that the entire context of the curriculum be addressed, including assessment practices, when
researching the effectiveness of a technological curriculum versus a pencil and paper curriculum (Doerr & Zangon, 2000; Penglase & Arnold, 1996).
greater gains on assessment instruments than did their counterparts, closing the gap between the weakest and strongest students. Van Streun attributed this success to students’ being able to solve problems using a variety of methods. Regular use of graphing calculators seemed to produce a shift in the type of representation used to solve problems, but that students still used symbolic manipulations if it was more efficient for solving the problem.
Others found that students using the graphing calculator had a better
understanding of functions because of the increased repertoire of representational use, their ability to tie together ideas, and by their overall success (Hollar & Norwood, 1999; O’Callaghan, 1998; Van Streun, 2000). A contributing factor to this increased understanding when using graphing calculators may have been a
multi-representational curriculum that was new to both the students and teacher. “The richer conceptions … students formed about functions can be traced directly to the
corresponding instruction, examples, and activities used throughout their curriculum” (O’Callaghan, 1998, p. 37). Teachers had to make daily adjustments and the emphasis in instruction shifted from teacher-directed to a learning community of which the teacher was a facilitator.
questions directed at individual students. When utilizing the graphing calculator classroom discourse was changed dramatically. There were typically longer verbal exchanges between teacher and students and among students. Teachers tended to leave the chalkboard more often and walked around the room. They looked at what students were doing on the calculator and addressed individuals as well as the class as a whole. The graphing calculator was a tool for teachers to provide less step-by-step instructions and ask more questions to prod students to fill in the gaps in their reasoning. Adams (1997) concluded that the graphing calculator can act as a catalyst for the teacher to interact with students, both spatially (by moving away from the board and closer to the students) and verbally. It also allowed for teachers to observe and address individual students work and was a vehicle which spawned deeper mathematical discussions (O’Callaghan, 1998). Thus, graphing calculators played a role in changing teachers’ classroom instructional and assessment practices.
Impact of Teacher Understanding and Teaching Practices on Reform Curriculum
complained about the weakness of their functional skills in preparing them for calculus (Harvey et al., 1995). The call among mathematics education professionals was for functions to be treated as relationships among quantities in all of their forms, symbolic, graphical, and tabular, instead of a set of procedures. This represented a major shift in the way mathematics was traditionally taught and was contrary to the way most mathematics teachers learned mathematics (Klein, 2001). The crux of this shift was a move from a procedural understanding of the function concept to a process conception of functions (Dubinsky & Harel, 1992).
Success in traditional algebra required symbolic manipulation skills and word-problem representational skills. Traditional algebra classrooms “may focus on symbol manipulation skills at the expense of representational skills” (Brenner et al, 1997, p. 684). However, teachers may be unprepared for making curriculum changes to place less emphasis on symbolic manipulation in traditional algebra classrooms.
Good teaching practices have been shown to lead to meaningful connections throughout mathematics. “Mathematics teachers help students learn to use
representations flexibly and appropriately by encouraging them as they create and use representations to support their thinking and communication” (NCTM, 2000, p. 284). A teacher facilitated and built on the students’ experiences and made sense of
conceptions through his or her own conceptual images. A strong teacher’s concept of co-variation and graphical representation of functions, a vital part of algebraic
of examples and problem situations for functions is one of the key bases from which meaningful instruction may be constructed” (p. 252). A teacher with a strong
conceptual background encouraged students to examine real-world problems and made connections between them and mathematical functions. Lloyd and Wilson found that “teachers’ conceptions contribute to instruction characterized by emphases on conceptual connections, powerful representations, and meaningful discussions” (p. 270). Similar studies (Stein et al., 1990; Wilson, 1994) found that a teachers’ ability to lay the foundations for mathematical understanding was influenced by the richness of their own knowledge.
Pre-service teachers also viewed functions and mathematics “as a collection of concrete procedures to be applied in isolated contexts to obtain correct answers to well-defined problems” (Wilson, 1994, p. 361). Even with experience in a reform curriculum, teachers did not necessarily change this fundamental view of
mathematics. Skemp (1987) classified this view as instrumental and stated that the mis-match between a teacher who taught from an instrumental point of view and a child trying to learn from a relational point of view could be extremely damaging to the mathematical education of that child. Wilson (1994) suggested that it would be difficult for a teacher who believed that mathematics was about obtaining correct answers by using a standard set of procedures, which the teacher themselves did not recognize the relationship of, to “encourage students to be creative and explore mathematical relationships” (p. 367). Thus, it would be difficult for this type of teacher to embrace a reform-minded curriculum. More than just text and standards that aim at students having relational understanding were needed to change the teaching style of teachers (Skemp, 1987).
Changing Assessment Practices
With the impact of written curriculum, technological tools, and changing classroom practices, instituting reform curriculum entailed new methods for both formal and informal assessment techniques (Adams, 1997; Archbald & Grant, 2000). “When the focus and form of assessment are different from that of instruction, assessment subverts students’ learning by sending them conflicting messages about what mathematics is valued” (NCTM, 1995, p 13). Thus, any reform curriculum must have incorporated reform of assessment practices. Assessment has been seen a key to informing instruction. It shaped how teachers determine such things as: if their lessons achieved their goals, if students correctly developed their understanding of concepts, if remediation was needed, and showed students’ strengths and weaknesses. Assessment also provided students with feedback on their understanding, or lack thereof, of concepts.
teaching the same curriculum. If an assumption was made that assessment was
aligned with course content, a question that arose was whether course content was not reformed or whether tests did not reflect the content. It would have been difficult for teachers teaching a reform curriculum to accurately assess student learning with traditional testing instruments. Reform-oriented curriculum must be incorporated with reform-oriented test items.
Constructivist Mathematics Teaching
Understanding how students learn a new concept and applying teaching strategies to strengthen that understanding were stated as characteristics of effective teaching (Simon, 1995; Tzur, Simon, Heinz, & Kinzel, 2001). Constructivism has been defined as a theory of learning that embraces the idea that students come into the classroom, not as empty vessels, but at various states of conceptual understanding. Individual students continued to build their mathematical frameworks from the point where they started; therefore, at the end of a particular course, they were still at different states of understanding or knowing. From the constructivist perspective, mathematical learning was seen as a reorganization of ideas already held to incorporate new information, thereby adding to the framework and building conceptual knowledge (Von Glaserfeld, 1987a).
Constructivism as a method of describing how students learn did not prescribe a method of teaching (Simon, 1995). Simon outlined the characteristics of effective teaching in the Mathematical Teaching Cycle. This cycle consisted of 3 broad parts:
2. Identifying the learning goal (mathematical concept) and
hypothesizing a path by which students will come to understand that goal (Hypothetical Learning Trajectory)
3. Planning activities that are likely to bring concept formation and
implementing them (planning and teaching). At the end of this step, the cycle continues back at step one.
This Mathematical Teaching Cycle gave a practical framework for teachers to understand and evaluate student learning which informed their classroom teaching.
Because of the tremendous influence of teaching on implementation of reform curriculum (Schoen, Cubulla, Finn & Fi, 2003), teaching practices should be
considered in any study that measured the success of such a curriculum. Reform curriculum teachers must strive to be effective teachers of that curriculum which means employing the Mathematical Teaching Cycle. To implement a curriculum involving multiple representations, teachers must have assessed what the students know about each representation, identified the mathematical concept they want the students to learn using the representations, and hypothesized how the students will come to know that concept. Then they must have planned the activities involving the representations that will facilitate students’ understanding of a concept and assessed for student understanding using all the representations.
changing their teaching practices, making student-based instructional decisions, and hopefully implementing a reform-oriented curriculum from the perspective of developing relational understanding.
Conceptual Framework
Each of the pieces of research mentioned above contained factors which related to studying the effects of a curriculum incorporating multiple representations. Curriculum was viewed more than just a syllabus of topics; it was made up of
mathematical content, teaching methods, and assessment practices (Howson, Keitel, & Kilpatrick, 1981). Informing the framework for the present study were: content issues such as functions and multiple representations, teaching methods such as the use of graphing calculators and simultaneous introduction of the representations, teacher attitudes about implementing a new curriculum, and assessment practices.
The conceptual framework for studying students’ understanding was grounded in the theory of constructivism. The majority of researchers in the domain of
1992). At the end of the study, if it was shown that the students could successfully solve problems using alternative representations and make connections among representations, it could be concluded that they have made progress toward concept formation.
The present study was based on the theories proposed by Hiebert & Carpenter (1992), Biggs & Collis (1982), and Skemp (1979, 1987). Although not all of these theorists are constructivists, their theories combined form the basis on which the present research was conducted. A key aspect to this research was determining if students have increased their conceptual knowledge of functions. This could be indicated if students could make connections among the representations, implying a move toward relational understanding (Skemp, 1987). If students could solve a problem with more than one representation but viewed those representations as separate entities, this would indicate they have expanded their instrumental
understanding in that they had more than one procedure to solve a problem, but not an increased conceptual knowledge because they did not link the representations
(Skemp, 1987).
generate or utilize an external representation “reveals something of how that student represented that information internally (p. 66).
P(x) = 2x
2+ 3x – 2
Equation Node – Solutions are the answers when the polynomial is set equal to zero and solved
Solutions will be where the x value when y is 0
The x values where y is 0 are the solutions
If c is an x-intercept then c is a solution If c is a
solution then c is an x-intercept
Table Node – Solutions are the value of x where P(x) equals 0
Graph Node – Solutions are the x coordinates where the graph crosses the x-axis
If c is an x-intercept then c is a zero thus a solution If c is a zero
then c is an x-intercept, thus a solution
Skemp (1979) described “varifocal learning theory” in which magnifying each node showed in detail that within the node was a web or connected schema. Among the nodes of the graphical, tabular, and symbolic representation there were connected threads of understanding. By examining the node of symbolic representation alone, there was also a connected schema within that node. For example, when examining a polynomial function, P(x), detailed algebraically (within the algebraic node) one could solve P(x) for zero, find the coordinates of the vertex by completing the square, etc (see Figure 4). Within the graphical node, the zeros would be x-intercepts of the graphical representation; the coordinates of the vertex would be where the function reached its max or min, etc. An internal connection among the nodes enabled the learner to see, for example, the zeros of the function algebraically and the x-intercepts of the graph as a single concept.
The SOLO Taxonomy (Biggs & Collis, 1982) was used for assessing a students’ web of connected knowledge. SOLO is an acronym for Structure of Observed Learning Outcomes. The SOLO Taxonomy classifies answers to written assessment questions into five qualitative categories, evaluated according to the
nature and strength of connections made: prestructural, unistructural, multistructural,
other disciplines. One of the benefits of the SOLO Taxonomy has been attributed to its applicability to a wide range of content domains (Pusey, 2003).
Prestructural concept formation is manifested by the student having no knowledge of the element being assessed. A student at this level might have pieces of isolated information but which make no sense with the problem situation. At the
unistructural level a student focuses on a single portion of the task. They may have made associations that were obvious but did not understand their significance. The
multistructural level describes concept development in which the student focuses on several aspects of the task, but the connections among them are not apparent. At the
When applying the SOLO Taxonomy (Biggs & Collis, 1982) to the study of
multiple representations of functions, students at the prestructural, unistructual, and
multistructural levels would be operating within a single representation node (e.g., symbolic). This understanding could be classified as instrumental (Skemp, 1987) since the student had a procedure and may have been able to produce a correct
answer. Although at the multistructural level they had an understanding of different
representations, there was no connection among any representational nodes. The
relational level seemed to be where conceptual understanding begins as the individual connected separate representational nodes into a web of connected
knowledge. At the relational level and the extended abstract levels the individual was
connecting the different representational nodes as well as working successfully within each node. Understanding at the relational and extended abstract levels correlated to Skemp’s (1987) definition of relational understanding. The student moved beyond just a procedural knowledge and actually understood why the representations were
related. At the relational and extended abstract levels the connection among the
nodes was very tight and compressed, allowing the individual to see the concept as a single entity, move flexibly among and between representations of the concept, and recognize the features of different representations that would facilitate effective and efficient solution strategies to a problem (Crowley, 2001).
The SOLO Taxonomy has been correlated to process-object theories by viewing the multistructural level as higher than just a procedure, but not having reached a process stage since the connections are absent (Pegg & Tall, 2002). The prestructural level correlated to a pre-procedure stage, the unistructural level correlated to procedure stage, and the relational level correlated to a process level.
Questions and Specific Hypotheses
The present study was different from previous studies in several ways. Keller and Hirsch (1998) examined student preferences for representations that have