i
DEVELOPMENT OF A PC-BASED TANK MODEL REAL-TIME FLOOD FORECASTING SYSTEM.
CHEOK HOU SENG
A project report submitted in partial fulfillment of the requirements for the award of the degree of
Masters of Civil Engineering (Civil - Hydraulic and Hydrology)
Faculty of Civil Engineering, Universiti Teknologi Malaysia
iii
This project is dedicated to my family, my supervisors and to those who had given me tremendous support to contribute to
iv
ACKNOWLEDGEMENT
My deepest and most heartfelt gratitude goes to my supervisor, Associate Professor Dr. Sobri Harun & Ir. Chong Sun Fatt, for their constant ideas and enthusiasm. Their continuous guidance, patience and support have enabled me to approach my work positively, and make even the impossible seem possible.
I would also like to thank all personnel of the Jabatan Pengairan dan Saliran Malaysia and Dr. Nik & Associates Sendirian Berhad who had provided me much assistance in the data acquisition process. It is only with their help can this project be completed successfully.
My sincerest gratitude also goes to Ng Boon Chong and his previous work in applying the Tank Model for Sungai Kuantan. He had given me much guidance and inspiration to further develop the Tank Model into a complete real-time flood
forecasting system. I would also like to thank everyone who has contributed whether directly or indirectly to this project.
v
ABSTRACT
The Upper Klang catchment has been under-going rapid development which instigated many flash flood occurrences within the catchment, especially at the Kuala Lumpur City. A reliable and timely flood forecasting system is necessary to provide early warning to minimize the destruction caused by flash floods. Utilizing the publicly available online hydrological data combined with the most recent programming technologies, a PC-based a real-time flood forecasting system is developed for this purpose. The Tank Model is used as the hydrological model to simulate the catchment discharge while the Standard Step Method applied as the hydraulic model to simulate the water level profile of Klang River starting from the confluence of Klang and Ampang River to Jambatan Tun Perak. Integration of both models into a complete real-time hydro-dynamic flood forecasting system is
programmed using the Microsoft Excel and Visual Basic For Application.
vi
ABSTRAK
Proses urbanisasi yang berlaku dengan pesat di kawasan tadahan Upper Klang telah menyebabkan kejadian banjir kilat melanda pusat bandar Kuala Lumpur yang terletak di bahagian hilir kawasan tadahan tersebut. Untuk mengurangkan kemysnahan akibat banjir kilat yang berlaku, satu sistem peramalan banjir “real-time” berasaskan computer peribadi harus dibangunkan untuk memberi amaran awal tentang kejadian banjir kepada penduduk-penduduk di kawasan pusat bandar.
Dengan gabungan teknologi aturcara dan data hydrologi on-line yang disediakan oleh Jabatan Pengairan dan Saliran (JPS), suatu sistem peramalan banjir telah
vii
TABLE OF CONTENT
CONTENTS PAGE
TITLE i
STATEMENT ii
DEDICATION iii
ACKNOWLEDGEMENT iv
ABSTRACT v
ABSTRAK vi
TABLE OF CONTENTS vii
LIST OF TABLES x
LIST OF FIGURES xi
LIST OF SYMBOLS/ABBREVIATIONS xiv
LIST OF APPENDICES xv
CHAPTER TITLE PAGE 1 INTRODUCTION 1.1 Background of Study 1
1.2 Statement of Problem 4
1.3 Objective of Study 4
1.4 Scope and Limitation of Study 5
1.5 Importance of Study 6
2 LITERATURE REVIEW 7
2.1 Introduction 7
2.1 Hydrological and Hydraulic Model Selection 8
viii TABLE OF CONTENTS
CHAPTER TITLE PAGE
2.3 Standard Step Method 14
2.4 Software and Internet Programming Techonologies 17
2.4.1 HTTP Web Request 17
2.4.2 Ms Excel Web Query 19
2.4.3 Microsoft Visual Basic for Application 22
2.4.4 Microsoft Office Automation 23
2.4.5 ActiveX Controls 24
2.4.6 Windows API 24
3 RESEARCH METHODOLOGY 27
3.1 Project Design and Approach 27
3.2 The Upper Klang Study Catchment 28
3.3 Subjects and Data Sources 30
3.4 Model Calibration and Verification 32
3.5 System Architecture 34
3.6 Automated Flood Forecasting Operation 37
4 RESULTS ANALYSIS AND DISCUSSION 40
4.1 Tank Model Calibration Results 40
4.2 Tank Model Accuracy 45
4.3 Verification of Tank Model 46
4.4 Hydraulic Model Results Analysis 47
5 CONCLUSIONS 48
5.1 Model Accuracy 48
5.2 Assumptions and Limitations 49
5.3 Advantages of the System 51
ix CONTENTS
CHAPTER TITLE PAGE
5.5 Recommendations for Future Improvements 52
REFERENCES Reference and Bibliography 54
APPENDIX A Detail Calculation of the Standard Step Method in 56 Simulating th Water Level Profiles for the 10th July
2005 Storm Event
APPENDIX B Example of the Tank Model Worksheet Used to 58 Simulate the Discharge Hydrograph of the Upper
Klang Catchment.
APPENDIX C Example of Infobanjir HTML web Page Displaying 59 Real-time Hydrological Data for Jambatan Tun Perak
Station.
APPENDIX D Example of the Real-Time Data Acquisition 60 Worksheet Used to Acquire Hydrological Data from
Infobanjir at Every 5 Minutes Interval.
APPENDIX E Example of Thiessen Polygon Analysis to Obtain the 61 Mean Areal Rainfall for the Upper Klang Catchment
APPENDIX F Example of the Cross Sectional Plot Showing the 62 Current Water Level and the 45 Minutes Lead Time
x
LIST OF TABLES
TABLE NO. TITLE PAGE
4.1 Calibrated parameters of the Tank Model for the Upper 41 Klang catchment.
xi
LIST OF FIGURES
FIGURE NO. TITLE PAGE 1.1 Flash Flood Occurrence in the Kuala Lumpur City Center 2
due to a Heavy Downpour on the 26th April 2001.
1.2 Photos showing the damage caused by the 10th June 2003 2 Flash flood event at the Kuala Lumpur City Center.
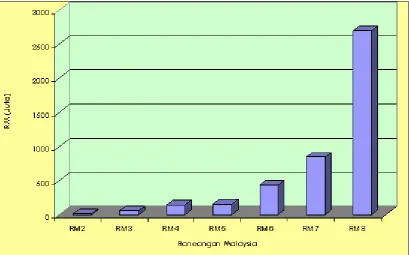
1.3 Budget allocated for flood mitigation projects by the 3 government for past Malaysian Plans.
2.1 Concept of the Tank Model to simulate the physical 11 hydrological processes using a series of storage tanks.
2.2 Typical configuration of a Tank model. 13 2.3 Definition sketch of the energy grade line used to determine 15
the flow depth at a specified location.
2.4 HTTP request-response between a client computer and the 18 web server.
2.5 Screen shot showing the use of web query in acquiring 20 real-time rainfall data from JPS Ampang station which is used as input for the Tank-SStep Model
2.6 Screen shot showing the option settings for the web query used 21 for the real-time data acquisition module of the Tank-SStep
Flood Forecasting system.
xii
LIST OF FIGURES
FIGURE NO. TITLE PAGE 2.8 Project break-down of the development of a real-time 28
PC-based flood forecasting system for the Upper Klang catchment.
3.2 Catchment map showing the Upper Klang catchment. 29 3.3 Rainfall and water level used for the development of the 31
Tank-SStep Flood Forecasting System for the Upper Klang Catchment.
3.4 Rating curve for Klang River at Jambatan Tun Perak 32 3.5 System architecture fot the Tank-SStep Flood Forecasting 34
System.
3.6 Each module in the Tank-SStep system is programmed as an 35 individual Excel worksheet. All the modules are contained
within the same Excel workbook.
3.7 Automated processes involved in the operation of the 38 Tank-SStep PC-bassed, real-time flood forecasting system.
4.1 Observed and simulated water level hydrograph for the 02 41 July 2005 storm event.
4.1 Observed and simulated water level hydrograph for the 02 41 July 2005 storm event.
4.2 Observed and simulated water level hydrograph for the 28 42 April 2005 storm event.
xiii
LIST OF FIGURES
FIGURE NO. TITLE PAGE 4.4 Observed and simulated water level hydrograph for the 13 43
February 2005 storm event.
4.5 Observed and simulated water level hydrograph for the 25 43 February 2004 storm event.
4.6 Observed and simulated water level hydrograph for the 02 44 November 2003 storm event.
4.7 Observed and simulated water level hydrograph for the 17 44 March 2003 storm event.
4.8 Water level time series at Jambatan Tun Perak for the 10th 46 July 2005 storm event.
4.9 Longitudinal water level profile for the study channel on 10th 47 July 2005 at 7:22pm
5.1 Figure showing the lag time between the simulated water 49 level and the observed water level captured at Jambatan Tun
xiv
LIST OF SYMBOLS/ABBREVIATIONS
DID - Department of Irrigaion and Drainage, Malaysia JPS - Jabatan Pengairan dan Saliran, Malaysia
RF - Rainfall
Q - Flood Discharge WL - Water Level
m R.L. - Meters Reduced Level Ms Excel - Microsoft Excel VB - Visual Basic
BASIC - Beginner’s All-Purpose Symbolic Instruction Code GVF - Gradually Varied Flow
HTTP - HyperText Transfer Protocol URL - Uniform Resource Locator RFC - Request for Comments PC - Personal Computer WWW - World Wide Web
HTML - HyperText Marked-up Language VBA - Microsoft Visual Basic for Application GUI - Graphical User Interface
GIF - Graphic Interchange Format
xv
LIST OF APPENDICES
APPENDIX TITLE PAGE
APPENDIX A Detail Calculation of the Standard Step Method in 56 Simulating th Water Level Profiles for the 10th July
2005 Storm Event
APPENDIX B Example of the Tank Model Worksheet Used to 58 Simulate the Discharge Hydrograph of the Upper
Klang Catchment.
APPENDIX C Example of Infobanjir HTML web Page Displaying 59 Real-time Hydrological Data for Jambatan Tun Perak Station.
APPENDIX D Example of the Real-Time Data Acquisition 60 Worksheet Used to Acquire Hydrological Data from Infobanjir at Every 5 Minutes Interval.
APPENDIX E Example of Thiessen Polygon Analysis to Obtain the 61 Mean Areal Rainfall for the Upper Klang Catchment
APPENDIX F Example of the Cross Sectional Plot Showing the 62 Current Water Level and the 45 Minutes Lead Time
CHAPTER 1
INTRODUCTION
1.1 Background of Study
The Upper Klang Catchment covers a total area of 108km2 (excluding the Klang Gate catchment), which extends from the tip of Klang River until the confluence of Klang and Gombak River. The downstream of the catchment, which includes part of the Kuala Lumpur City Center is fully developed while the upstream part like Taman Melati, Wangsa Maju and Ulu Klang are being rapidly developed to accommodate the drastic increase in the capital’s population.
With the rapid development, many areas have been paved impervious by roads and building which eventually reduces the amount of rainfall infiltrated into the ground and caused an increase in surface runoff (MASMA, 2000). Besides that, impervious areas like roads and concrete pavements have smoother surfaces
compared to the undeveloped vegetation. This causes the reduction in the time of concentration of the catchment, which literally means that the rainfall will discharge much faster into the river, causing the water level in the river system to rise
2
Figure 1.1 flash flood occurrence in the Kuala Lumpur City Center due to a heavy downpour on the 26th April 2001
3 These flash floods nuisance have forced the government to allocate a total of
RM 2.7 billion from the Eighth Malaysian Plan to mitigate the problem (refer Figure 1.3). According to a study by The Drainage & Flood Mitigation Division of Drainage and Irrigation Department (DID) Malaysia in 2003, the flood mitigation projects implemented has successfully reduced the flood damages from RM1356 million to RM915 million. However most of these mitigation measures are structural river improvement works. In order to further reduce the flood damages caused, a timely and reliable flood forecasting system is important to provide early warning to evacuate people and properties from the flood-prone areas.
4
1.2 Statement of Problem
There are currently 2 flood forecasting models setup for Kuala Lumpur, namely the FloodWatch System and a Unit Hydrograph Model. However both models require cumbersome maintenance and are still being evaluated in their capability to provide reliable real-time flood warnings. Taking advantage of the online hydrological data for the Klang River Basin and utilizing the various
programming technologies available, it is time to research into the development of a new personal computer-based flood forecasting model to provide timely and reliable flood forecast to prevent loss of lives and properties within the Kuala Lumpur City Center.
1.3 Objective of Study
The main objectives of the project are:
1. To develop and setup a hydrological Tank Model to simulate the discharge hydrograph of the Upper Klang catchment at Jambatan Tun Perak.
2. To develop and setup a hydraulic model, using the Standard Step Method to simulate the water level profile for Klang River starting from the confluence of Klang and Ampang River until Jambatan Tun Perak.
5
1.4 Scope and Limitation of Study
1. To obtain and process relevant hydrological data of various historical storms which are used for calibration and verification purposes of the developed models.
2. To calibrate the Tank Model based on historical flood events to provide reliable simulation of flood discharges at Jambatan Tun Perak.
3. To obtain and process all relevant hydraulic data which are used for the Standard Step Method Model to simulate the water level profile within the study channel.
4. To develop a PC-based system to integrate both the Tank Model and the Hydraulic Model into a complete Hydro-dynamic model for the Upper-Klang catchment.
5. To develop a software module to acquire hydrological data at 5 minutes interval from the Infobanjir web site to be inputted into the PC-based
forecasting system to provide real-time flood forecast at Jambatan Tun Perak. 6. The main limitation of the study is the availability of reliable and error-free
hydrological data. Therefore the scope of the study is only limited to the Upper Klang catchment because of the inadequacy of well-established on-line hydrological data in other catchments.
7. The scope of the hydraulic model development is limited to the determination of water level profile for a river channel with one inflow and one outflow. Modelling of complicated river networks with lateral inflow is not covered in this study.
6
1.5 Importance of Study
The developed system synergizes the most recent engineering modeling techniques with the technologies in software and the internet programming in order to achieve the objective of providing an accurate and timely flood forecast to the masses. The developed system, given the name Tank-SStep Model uses the