Muscle oxygenation maintained during
repeated-sprints despite inspiratory muscle
loading
Ramo´ n F. RodriguezID1☯, Nathan E. Townsend2☯, Robert J. Aughey1☯, Franc¸ois Billaut1,3☯*
1 Institute for Health and Sport, Victoria University, Melbourne, Australia, 2 Aspetar, Doha, Qatar, 3 Department of kinesiology, University Laval, Quebec, Canada
☯These authors contributed equally to this work. *[email protected]
Abstract
A high work of breathing can compromise limb oxygen delivery during sustained high-inten-sity exercise. However, it is unclear if the same is true for intermittent sprint exercise. This project examined the effect of adding an inspiratory load on locomotor muscle tissue reoxy-genation during repeated-sprint exercise. Ten healthy males completed three experiment sessions of ten 10-s sprints, separated by 30-s of passive rest on a cycle ergometer. The first two sessions were “all-out’ efforts performed without (CTRL) or with inspiratory loading (INSP) in a randomised and counterbalanced order. The third experiment session (MATCH) consisted of ten 10-s work-matched intervals. Tissue saturation index (TSI) and deoxy-hae-moglobin (HHb) of the vastus lateralis and sixth intercostal space was monitored with near-infrared spectroscopy. Vastus lateralis reoxygenation (ΔReoxy) was calculated as the differ-ence from peak HHb (sprint) to nadir HHb (recovery). Total mechanical work completed was similar between INSP and CTRL (effect size: -0.18, 90% confidence limit±0.43), and differ-ences in vastus lateralis TSI during the sprint (-0.01±0.33) and recovery (-0.08±0.50) phases were unclear. There was also no meaningful difference inΔReoxy (0.21±0.37). Intercostal HHb was higher in the INSP session compared to CTRL (0.42±0.34), whilst the difference was unclear for TSI (-0.01±0.33). During MATCH exercise, differences in vastus lateralis TSI were unclear compared to INSP for both sprint (0.10±0.30) and recovery (-0.09 ±0.48) phases, and there was no meaningful difference inΔReoxy (-0.25±0.55). Intercostal TSI was higher during MATCH compared to INSP (0.95±0.53), whereas HHb was lower (-1.09±0.33). The lack of difference inΔReoxy between INSP and CTRL suggests that for intermittent sprint exercise, the metabolic O2demands of both the respiratory and locomotor
muscles can be met. Additionally, the similarity of the MATCH suggests thatΔReoxy was maximal in all exercise conditions.
a1111111111 a1111111111 a1111111111 a1111111111 a1111111111 OPEN ACCESS
Citation: Rodriguez RF, Townsend NE, Aughey RJ,
Billaut F (2019) Muscle oxygenation maintained during repeated-sprints despite inspiratory muscle loading. PLoS ONE 14(9): e0222487.https://doi. org/10.1371/journal.pone.0222487
Editor: Hugo A. Kerherve´, Univ Rennes, FRANCE
Received: August 9, 2018
Accepted: August 30, 2019
Published: September 19, 2019
Copyright:©2019 Rodriguez et al. This is an open access article distributed under the terms of the
Creative Commons Attribution License, which permits unrestricted use, distribution, and reproduction in any medium, provided the original author and source are credited.
Data Availability Statement: The data underlying
this study have been uploaded to the Open Science Framework and are accessible using the following link:https://osf.io/3ft2q/.
Funding: Funding was provided by the Graduate
Introduction
Repeated-sprint exercise is characterised by brief periods of “maximal” exertion, interspersed with incomplete recovery periods. Over the course of a repeated-sprint series, there is a pro-gressive reduction in both peak and mean power output, with a plateau in the latter sprints [1–
4]. While phosphocreatine (PCr) hydrolysis and anaerobic glycolysis are heavily relied on as a rapid source of adenosine triphosphate (ATP) replenishment in sprint exercise [2,5], the aero-bic system plays an increasingly significant role in maintaining performance when sprints are repeated. In fact, PCr resynthesis and removal of inorganic phosphate are exclusively per-formed through oxidative processes [6], and sensitive to oxygen (O2) availability [7]. Maintain-ing O2delivery to locomotor muscles during repeated-sprint exercise is therefore an
important mediating factor of performance.
Near-infrared spectroscopy (NIRS) offers the possibility to explore O2balance (delivery vs. consumption) in skeletal muscle during sprint activity in real-time. Deoxy-haemoglobin ([HHb]) and oxy-haemoglobin ([O2Hb]) rise and fall, respectively, proportional to an increase in metabolic activity in the underlying tissue. Relative changes in [HHb] have been primarily examined during repeated-sprint exercise, because this variable is considered to be indepen-dent of blood volume [8,9], and is assumed to provide a reliable estimate of muscle O2 extrac-tion [9,10]. At sprint onset, there is a rapid increase in vastus lateralis [HHb], which recovers during rest periods [1,11,12]. Muscle reoxygenation between sprints may also describe the quality of metabolic recovery [13]. Improving this process typically increases repeated-sprint performance [14,15], whereas a slower reoxygenation is associated with performance impair-ments [11,13]. However, it is currently unclear if the O2cost of exercise hyperpnoea has any influence on locomotor muscle oxygenation trends during repeated-sprint exercise.
The respiratory muscles demand�10–15% of total pulmonary O2uptake (VO_ 2) during high-intensity exercise, as well as a considerable portion of cardiac output to maintain ade-quate O2delivery [16]. An elevated work of breathing during high-intensity exercise promotes competition between locomotor and respiratory muscles for available cardiac output [17]. In fact, the addition of an inspiratory load to artificially increase the work of breathing during severe exercise (>95%VO_ 2peak) limits endurance capacity via decreased limb perfusion and O2
delivery that is mediated by a sympathetically activated vasoconstriction in the locomotor muscles [18,19]. However, at moderate intensities (50–75%VO_ 2peak) there is no change in
vas-cular resistance or blood flow to the locomotor muscles [20], suggesting that exercise intensity is an important mediator of locomotor vasoconstriction when the work of breathing is high.
It is currently unclear if an elevated work of breathing influences reoxygenation capacity during repeated-sprint exercise. Therefore, we aimed to determine the impact of an elevated work of breathing onVO_ 2, tissue oxygenation trends and mechanical output during repeated-sprint exercise. We believe that, by increasing the work of breathing, there will be no concur-rent increase inVO_ 2, but that vastus lateralis oxygenation will be compromised and repeat-sprint ability will be impaired.
Materials and methods
Subjects
Ten males from a variety of athletic backgrounds (team sports, road cycling, combat sports, CrossFit) were recruited for this study (age 25.5±3.6 years; height 184.00±7.69 cm; body mass 81.45±8.29 Kg;VO_ 2peak4.40±0.36 L�min
-1
, 54.4±5.9 mL�min-1�Kg-1;V_Epeak
173.6±26.9 L�min-1). Subject pulmonary function data is presented inTable 1. These subjects
decision to publish, or preparation of the manuscript.
Competing interests: The authors have read the
were chosen because they were accustomed to producing “all-out” bouts of exercise. Subjects self-reported in a written questionnaire to be healthy non-smokers and with no known neuro-logical, cardiovascular, respiratory diseases, or any other medical conditions. If subjects indi-cated “yes” to any of the contraindications, they were excluded from participation. After being fully informed of the requirements, benefits, and risks associated with participation, each sub-ject gave written informed consent. Ethical approval for the study was obtained from the Vic-toria University Human Research Ethics Committee and the study conformed to the
declaration of Helsinki. Prior to each experiment session, subjects were asked to replicate their preceding meal and to refrain from caffeinated beverages for 24 h. Subjects were also asked to refrain from any strenuous exercise for 48 h prior to every session.
Experiment design
Subjects visited the laboratory on six occasions. During visit one, subjects completed pulmo-nary function (spirometry and maximum voluntary ventilation) (Ultima CPX, MGC Diagnos-tics, Minnesota, United States of America) and respiratory muscle strength tests (MicroRPM, Micro Medical, Hoechberg, Germany) followed by a maximal ramp exercise test familiarisa-tion. In visit two, a ramp exercise test to volitional exhaustion was completed. During visit three, subjects completed a familiarisation session consisting of the same repeated-sprint pro-tocol used in the experiment sessions. In visits four and five subjects completed the actual repeated-sprint test in a randomised, counterbalanced, cross-over design with either no restriction to their breathing (CTRL) or with inspiratory loading (INSP). During the sixth lab-oratory visit, ten work-matched intervals to that of the INSP experiment session were com-pleted with normal breathing (MATCH). The MATCH condition was included in the experiment design to firstly minimise the physiological disturbances that are typically associ-ated with “maximal” sprint performance [2,3,5], and to secondly allow for comparison of the data to an exercise trial (INSP) where the same amount of mechanical work was performed by the subjects. All exercise testing was performed on an electronically-braked cycle ergometer (Excalibur, Lode, Groningen, The Netherlands). Experiment sessions were conducted at the same time of day and separated by 3–7 days.
Maximal ramp exercise testing
A maximal ramp cycling ergometer test was performed to determineVO_ 2peak. The exercise test
was initiated at a work rate of 0 W for 3 min. This was followed by an increase in work rate of 1 W every 2 s (30 W�min-1) until volitional exhaustion or until cadence fell 10 rpm below self-selected rate. Expired gases were collected on a breath-by-breath basis (COSMED Quark
Table 1. Pulmonary function data.
Measure Raw %Predicted
FVC (L) 6.0±0.7 103±8.8
FEV1(L) 4.9±0.5 99.7±8.1
FVC/FEV1 79.1±6.6 95.5±7.5
MVV (L�min-1) 212.9±24.7 110.9±10.2 MIP (cmH2O) -146.6±19.2
MEP (cmH2O) 151.8±35.8
Abbreviations are: forced vital capacity, FVC; forced expired volume in 1 s, FEV1; maximum voluntary ventilation, MVV; maximum inspiratory pressure, MIP; maximum expiratory pressure, MEP. Vales are reported as mean±SD.
CPET; Cosmed, Rome, Italy), and peakVO_ 2was determined as the highest 30 s average prior
to exercise termination (VO_ 2peak). The correspondingV_EatVO_ 2peakwas deemed to beV_Epeak.
Subjects were familiarised with this protocol during their first visit to the laboratory. Subjects completed the same protocol to volitional exhaustion on visit two.
Repeated-sprint exercise
After arriving at the laboratory, subjects were fitted with NIRS probes and a heart rate moni-tor. Testing was performed with the cycle ergometer set to isokinetic mode. In this mode, a variable resistance is applied to the flywheel proportional to the torque produced by the sub-jects to constrain their pedalling rate to 120 rpm. The handlebars and seat were individually adjusted to each subjects’ characteristics and feet secured using toe cages and retention straps fitted to the ergometer. Crank arm length was standardised to 175 mm. After a 7-min warm-up consisting of 5 min of unloaded cycling at 60–70 rpm and two 4-s sprints (separated by 1 min), subjects rested for another 2.5 min before the repeated-sprint protocol was initiated. The repeated-sprint protocol consisted of ten consecutive 10-s sprints separated by 30 s of passive rest [4,21–23]. Subjects were instructed to give an “all-out” effort for every sprint and verbally encouraged throughout to promote a maximal effort. Each sprint was performed in the seated position and initiated with the crank arm of the dominant leg at 45˚. Before sprint one, sub-jects were instructed to accelerate the flywheel to 95 rpm over a 15-s period and assume the ready position 5 s before the commencement of the test. This ensured that each sprint was ini-tiated with the flywheel rotating at�90 rpm so that subjects could quickly reach 120 rpm. Visual feedback of power output was not available to the subjects during any sprint. The cycle ergometer software provides power and cadence at 4 Hz. Data were exported to Microsoft Excel for analysis. Peak power output was determined by identifying the highest individual power value (watts), which happened to be during Sprint 1 in every case. Mean power output was calculated at the average power within each of the ten sprints. Mechanical work performed (J) was calculated by integrating the power curve over every 10-s sprint. Ratings of perceived exertion for exercise (RPEExercise) and breathing (RPEBreath) were recorded following sprint one, five and ten, using a Borg 6–20 RPE scale. In every case, subjects were asked the questions “how difficult is the exercise?” and “how difficult is the breathing?”. The scale was anchored so that 6 represented no exertion, and 20 represented maximal exertion.
Inspiratory loading was achieved by placing a plastic disk with a 10-mm opening over the inspiratory side of a two-way non-rebreathing valve (Hans Rudolph inc., Kansas, United States of America) attached to the distal end of the breath-by-breath gas sampling line and turbine [24,25]. The non-rebreathing valve was worn during all the repeated-sprint experiment ses-sions. The inspiratory load was applied after warm-up, 1 min before the commencement of the repeated-sprint protocol. Work-matched (MATCH) exercise was conducted by performing ten 10-s bouts of exercise separated by 30 s of passive rest matched for total work performed during the INSP experiment session. This was achieved by programming the cycle ergometer for ten bouts of fixed work rate intervals equivalent to each subject’s calculated mean power output for every corresponding sprint repetition (1 to 10) in the INSP experiment session. Between each sprint interval, the cycle ergometer was programmed to 0 watts. The cycle ergometers isokinetic function cannot be used when controlling for power output, therefore, subjects were asked to maintain cadence at 120 rpm during each interval. Warm-up proce-dures were identical to the CTRL and INSP experiment sessions.
subjects to the inspiratory loading, they performed the first two sprints of the series with restricted inhalation. The inspiratory loading was promptly removed, and the subjects contin-ued with the remaining eight sprints. Subjects were also asked to rate their perceived exertion for exercise and breathing during this familiarisation trial.
Metabolic and ventilatory measurements
The same metabolic system that was used to determineVO_ 2peakwas used during the
repeated-sprint experiment sessions to collect breath-by-breath data. The analyser was calibrated before each test against known gas concentrations and the turbine volume transducer was calibrated using a 3 L syringe (Cosmed, Rome, Italy). Errant data points due to coughing or swallowing were initially removed and thereafter any breath further than 4 standard deviations from the local mean was removed [26,27]. A 5-breath rolling average was applied for the calculation of peak and nadir for bothVO_ 2andV_Efor every 40-s sprint/recovery period to give a single value
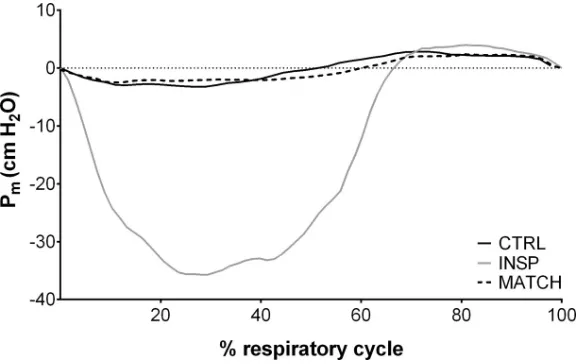
for each sprint and recovery phase. Inspiratory volume (IV), respiratory frequency (fR), end-tidal O2partial pressure (PETO2), and end-tidal CO2partial pressure (PETCO2) were averaged to give one value for each 40-s period. Because the facemask was removed immediately after the tenth sprint, only maximum values were calculated over the first 10-s. Mouth pressure (Pm) was recorded continuously at 50 Hz with a pressure transducer (Honeywell, New Jersey, United States of America) attached to the saliva port of the non-rebreathing valve via Tygon tubing. Representative data of the effects of inspiratory muscle loading on Pmfrom one subject is dis-played inFig 1. Mean inspiratory and expiratory Pmwas then calculated as an index of respira-tory muscle work. To account for any change infR,an index of inspiratory muscle force development was also calculated for each exercise experiment session (RPm×fR, expressed in arbitrary units) [28]. For statistical analysis, inspiratory Pmwas converted to positive values and presented in the results as such. Heart rate (HR) (Cosmed, Rome, Italy) and arterial oxygen sat-uration (estimated by fingertip pulse oximetry; SPO2) (Nonin Medical, Minnesota, United States of America) was collected on a breath-by-breath basis integrated into the Cosmed system.
Near-infrared spectroscopy
Subjects were instrumented with two NIRS probes to assess muscle oxygenation (Oxymon MKIII, Artinis, the Netherland). The first probe was fixed over the distal part of the vastus
Fig 1. Representative data of the effects of inspiratory muscle loading (INSP) on mouth pressure (Pm) compared
to control (CTRL) and work matched (MATCH) exercise conditions.
lateralis muscle belly approximately 15 cm above the proximal border of the patella of the dominant leg. The second probe was fixed over the left 6thintercostal space at the anterior axil-lary line of the serratus anterior to assess changes in the accessory respiratory muscles. Probes were held in place with black plastic spacers secured to the skin using double-sided tape and shielded from light using a black self-adhesive elastic bandage. An indelible marker was used to trace the position of the probes to ensure placement was reproduced in subsequent visits. Optode spacing was set to 4.5 cm and 3.5 cm for vastus lateralis and respiratory muscles, respectively. Skinfold thickness was measured between the emitter and detector using a skin-fold calliper (Harpenden Ltd.) to account for skin and adipose tissue thickness covering the muscle. The skinfold thickness for vastus lateralis (1.19±0.69 cm) and respiratory muscles (1.12±0.44 cm) was less than half the distance between the emitter and the detector in every case. A modified form of the Beer-Lambert law was used to calculate micromolar changes in tissue [HHb] and [O2Hb] across time using the received optical density from continuous wavelengths of NIR light. A differential pathlength factor of 4.95 was used [12]. We chose to focus our analysis onΔ[HHb] to allow comparisons to previous research; becauseΔ[HHb] is independent of changes in total haemoglobin [8]; and taken to reflect venous [HHb] which provides an estimate of muscular oxygen extraction [9,10]; and becauseΔ[O2Hb] is influenced by rapid blood volume and perfusion variations caused by forceful muscle contractions [8,29]. To assess muscle oxygenation status, we used spatially-resolved spectroscopy to calculate a Tis-sue Saturation Index (TSI). The Artinis system uses three light sources to calculate a correction factor which is used to determine [O2Hb] and [HHb] [30–32]. Then, the ratio of [O2Hb] to total haemoglobin is calculated (TSI = [O2Hb] / ([O2Hb] + [HHb], expressed in %). This method robustly reflects the dynamic balance between O2supply and O2consumption in the tissue microcirculation beyond what [O2Hb] alone can provide, and is independent of the cou-pling between the optodes and tissue [31]. In fact, spatially-resolved spectroscopy methods are less susceptible to be influenced by underlying adipose tissue thickness then modified Beer-Lambert law methods [33]. Moreover, skin blood flow does not appear to affect spatially-resolved spectroscopy derived variables (TSI), whereas modified Beer-Lambert law derived variables (O2Hb and HHb) appear to be more vulnerable [34]. Our analysis of respiratory muscle TSI was limited to n = 8 due to partial data loss in one of the transmitter fibre optic cables for two subjects. An example of the raw vastus lateralis NIRS data from a single subject is presented inFig 2, and an example of respiratory muscle responses can be found in our pre-vious work [22].
Data were acquired at 10 Hz. A 10thorder zero-lag low-pass Butterworth filter was applied to the data to remove artefacts and smooth pedalling induced fluctuations; the resulting output was used for analysis [21]. The application of the filter was conducted in theRenvironment (R: A language and environment for statistical computing, Vienna, Austria). Values were then normalised to femoral artery occlusion so that 0% represented a 5-s average immediately prior to the occlusion and 100% represented the maximum 5 s average. Occlusion was performed 3–5 min following the cessation of the sprints while the subjects were supine on an examina-tion bed. Commencement of occlusion was largely influenced by the subject’s wellness follow-ing the sprint protocol (e.g., exercise-related pre-syncope or nausea were present in two subjects after INSP). Subjects were asked to place their feet flat on the examination bed with
identified for each period using a rolling approach [21]. Time to peak HHbVL(TTPHHb) was also calculated as the time from sprint onset to peak HHb. Reoxygenation capacity (ΔReoxy, %) and reoxygenation rate (Reoxy rate, %�s-1) were also calculated as the change from sprint to recovery. The baseline for respiratory muscle HHb was established before warm-up while seated quietly on the cycle. Respiratory muscle HHb (HHbRM) values are expressed as per cent change from baseline. Because there were no clear peaks and nadirs in the respiratory muscle variables (HHbRMand TSIRM), averages were calculated for each 40-s sprint/recovery period.
Statistical analysis
Data in text and figures are presented as mean±standard deviation. A custom made spread-sheet was used to analyse the effects of INSP and MATCH on laboratory measurements [35]. All measures, other thanVO_ 2, SPO2, RPE and NIRS responses (except for TTPHHb), were log-transformed before analysis then back-log-transformed to express the changes in per cent units and standardised effects. Relative changes (%) and standardised effects are expressed with 90% confidence limits (90% CL). Practical significance was assessed by calculating Cohen’s d effect size (ES) [36]. Standardised effect sizes of<0.2, 0.2–0.5, 0.5–0.8,>0.8 were considered as triv-ial, small, moderate and large respectively and presented with 90% CL. Probabilities were also calculated to establish if the chance the true (unknown) differences were lower, similar to or
Fig 2. Representative data of the raw NIRS responses to repeated-sprint exercise. (A) Concentrations of vastus lateralis total haemoglobin ([tHb]),
oxyhaemoglobin ([O2Hb]), and deoxyhaemoglobin ([HHb]), and (B) vastus lateralis Tissue Saturation Index (TSI) for the entire repeated-sprint protocol. (C) [tHb], [O2Hb], and [HHb], and (D) TSI for the first 10-s sprint and the following 30-s of passive rest.
higher than the smallest worthwhile change (ES = 0.2). Effects were not considered meaningful if there was<75% probability of being substantially positive/negative relative to the smallest worthwhile change. If the chance of having higher/lower values than the smallest worthwhile difference was both>5%, the true difference was assessed asunclear. For clear effects, the like-lihood that the true effect was substantial were assessed qualitatively as follows:likely(75 to
<95%),very likely(95 to<99%),almost certainly(>99%) [37].
Results
Mouth pressure
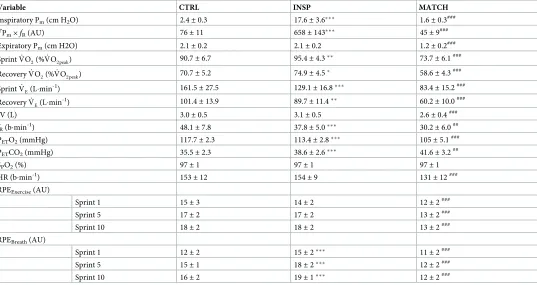
Mouth pressure responses to exercise and inspiratory muscle loading are presented inTable 2, and representative data from a single subject is presented inFig 1. Mean inspiratory Pmwas greater during INSP compared to CTRL (relative difference = 616.6%, 90% CL±62.2%; ES 13.33, 90% CL±0.59). Similarly, inspiratory muscle force generation (RPm×fR) wasalmost
certainlyhigher during INSP compared to CTRL (753.6%±91.1%; ES 13.04±0.65). But there
was anuncleardifference in mean expiratory Pm(-0.6%±7.1%; ES -0.05±0.61).
Table 2. Physiological and perceptual responses to repeated-sprint exercise during control (CTRL), inspiratory loading (INSP), and work match (MATCH) conditions.
Variable CTRL INSP MATCH
Inspiratory Pm(cm H2O) 2.4±0.3 17.6±3.6��� 1.6±0.3###
R
Pm×fR(AU) 76±11 658±143��� 45±9
###
Expiratory Pm(cm H2O) 2.1±0.2 2.1±0.2 1.2±0.2###
SprintVO_
2(%VO_ 2peak) 90.7±6.7 95.4±4.3
�� 73.7±6.1###
RecoveryVO_ 2(%VO_ 2peak) 70.7±5.2 74.9±4.5
� 58.6±4.3###
SprintVE_ (L�min-1) 161.5±27.5 129.1±16.8��� 83.4±15.2###
RecoveryVE_ (L�min-1) 101.4±13.9 89.7±11.4�� 60.2±10.0###
IV (L) 3.0±0.5 3.1±0.5 2.6±0.4###
fR(b�min-1) 48.1±7.8 37.8±5.0��� 30.2±6.0##
PETO2(mmHg) 117.7±2.3 113.4±2.8��� 105±5.1###
PETCO2(mmHg) 35.5±2.3 38.6±2.6��� 41.6±3.2##
SPO2(%) 97±1 97±1 97±1
HR (b�min-1) 153±12 154±9 131±12###
RPEExercise(AU)
Sprint 1 15±3 14±2 12±2###
Sprint 5 17±2 17±2 13±2###
Sprint 10 18±2 18±2 13±2###
RPEBreath(AU)
Sprint 1 12±2 15±2��� 11±2###
Sprint 5 15±1 18±2��� 12±2###
Sprint 10 16±2 19±1��� 12±2###
Abbreviations are: mouth pressure, Pm; inspiratory muscle force development,RPm×fR; pulmonary oxygen uptake,VO_
2; pulmonary ventilation,V_E; inspiratory
volume,V_
E; inspiratory volume, IV; respiratory frequency,fR; end-tidal oxygen partial pressure, PETO2; end-tidal carbon dioxide partial pressure, PETCO2; arterial
oxygen saturation estimated by pulse oximetry, SpO2; heart rate, HR; rating of perceived exertion for exercise, RPEExercise; rating of perceived exertion for breathing, RPEBreath. The symbols represent comparisons between INSP and CTRL (⁕), INSP and MATCH (#). The number of symbols; one, two and three denote likely, very likely and almost certainly, respectively, that the chance of the true effect exceeds a small (-0.2–0.2) effect size. Values are reported as mean±SD.
Mean inspiratory Pmwas lower during MATCH compared to INSP with a large effect (-91.0%±0.9; ES -10.18±0.42). Likewise,RPm×fRwas lower during the MATCH experiment sessions (-93.1%±1.0%; ES -9.92±0.52). A large effect was also present for expiratory Pmwith MATCH being lower than INSP (-40.3%±5.8%; ES -4.14±0.78).
Mechanical measurements
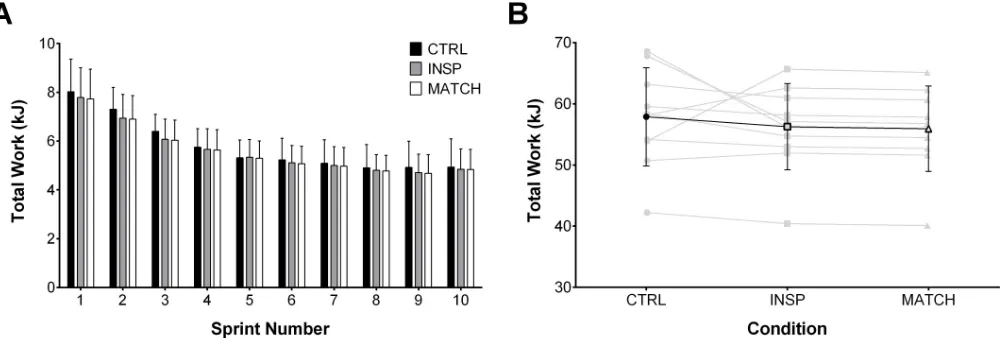
Total work completed on the cycle ergometer per sprint and over the entire protocol for each condition is presented inFig 3. There was no meaningful effect of INSP on total work com-pleted over the entire repeated-sprint protocol compared to CTRL (-2.7%±6.4%; ES -0.17
±0.42). Similarly and as expected, total work performed during MATCH and INSP trials (-0.6%±0.1%; ES -0.04±0.01) was not different. There was no meaningful effect of INSP on peak power output (1097±148 W) compared to CTRL (1158±172 W) (-5.1%±6.1; ES -0.30,
±0.35). However, there was analmost certainlylarge effect between MATCH (773±122 W) and INSP (-29.7%,±2.3%; ES -2.21±0.20).
Physiological responses
Responses to exercise are presented inTable 2andFig 4. Over the entire protocol,VO_ 2was greater during both sprint (4.7%±2.7%; ES 0.64±0.37) and recovery (4.2%±3.1; ES 0.74
±0.55) for INSP compared to CON. Additionally,VO_ 2was lower during MATCH compared to INSP during both sprint (-21.7%±5.0%; ES -4.59±1.06) and recovery (16.3%±2.9%; ES -3.30±0.58). Likewise,V_Eduring INSP was lower both during sprint (-19.6%±3.5%; ES -1.13
±0.22) and recovery (-11.5%±5.6; ES -0.80±0.41) compared to CTRL. Throughout MATCH, _
VEwas lower during both sprint (-35.8%±9.5%; ES -2.92±0.98) and recovery (-33.2%±6.2%;
ES -2.81±0.65). There was no meaningful difference of IV between INSP and CTRL (2.8%
±4.8%; ES 0.16±0.27). On the other hand, IV wasalmost certainlylower during MATCH com-pared to INSP (-15.6%±5.1%; ES -0.91±0.32). There was analmost certainlylarge effect of INSP onfRcompared to CTRL (-21.2%±4.7%; ES -1.41±0.35). Additionally,fRwasvery likely lower during MATCH compared to INSP (-20.8%±9.6%; ES -1.53±0.79).
During INSP, PETO2was lower than CTRL (-3.7%±2.3%; ES -1.71±0.65), and lower during MATCH compared to CTRL (-7.4%±2.3; ES -2.81±0.91). Conversely, PETCO2was higher
Fig 3. Total mechanical work performed during control (CTRL), inspiratory loading (INSP), and work match (MATCH) exercise conditions. (A) Total
mechanical work performed during each 10-s sprint. (B) Individual (grey lines) and mean total work (black line) completed over the entire repeated-sprint protocol. Values are presented as mean±SD.
during INSP compared to CTRL (9.1%±4.0%; ES 1.22±0.51), and higher during MATCH compared to INSP (7.7%±4.2; ES 1.03±0.54). There wereuncleardifferences for SPO2 between both INSP and CTRL (-0.1%±0.5; ES -0.10±0.43), and, MATCH and INSP (0.2%
±0.4%; ES 0.16±0.34).
Differences for HR wereunclearbetween INSP and CTRL (1.0%±4.4%; ES 0.11±0.50). However, there was a clearalmost certainlylarge effect between MATCH and INSP (-15.6%
±3.3; ES -2.66±0.61).
Subjects self-report of RPEExerciseduring INSP waslikelytrivial after sprint 1 (-2%±0.5%; ES -0.08±0.21) compared to CTRL, andunclearafter sprint 5 (0.5%±1.1%; ES 0.14±0.52) and sprint 10 (0.4%±1.0%; ES 0.19±0.49). Whereas RPEBreathwasalmost certainlyhigher after sprint 1 (2.8%±0.7%; ES 1.46±0.37), sprint 5 (2.4%±1.0; ES 1.79±0.77), and sprint 10 (2.7%
±1.2%; ES 1.32±0.57). Comparing MATCH to INSP, RPEExercisewasalmost certainlylower after sprint 1 (-2.1%±0.8%; ES -0.98±0.37), sprint 5 (-4.4%±1.3%; ES -2.78±0.79), and sprint 10 (-5.6%±1.2; ES -3.43±0.73). Similarly, RPEBreathwasalmost certainlylower after sprint 1 (-4.0%±1.1%; ES -1.69±0.46), sprint 5 (-6.1%±2.0%; ES -2.36±0.78), and sprint 10 (-6.8%
±1.6%; ES -3.93±0.95)
Fig 4. Sprint and recovery pulmonary oxygen uptake (VO2_ ) expressed as a percentage ofVO2 peak_ for control (CTRL), inspiratory muscle loading (INSP) and worked matched (MATCH) exercise. The symbols represent
comparisons between INSP and CTRL (), INSP and MATCH (#). The number of symbols; one, two and three denote likely, very likely and almost certainly respectively, that the chance of the true effect exceeds a small (-0.2–0.2) effect size. Vales are presented as mean±SD.
https://doi.org/10.1371/journal.pone.0222487.g004
Table 3. Near-infrared spectroscopy responses to repeated-sprint exercise during control (CTRL), inspiratory loading (INSP), and work match (MATCH) conditions.
Variable CTRL INSP MATCH
TTPHHb(s) 13.0±3.3 12.3±3.4 13.8±3.7#
ΔReoxy (%) 49.94±20.30 54.66±19.24 49.45±21.08
Reox rate (%�s-1) 2.16±0.78 2.20±0.75 2.27±0.79
Vales are reported as mean±SD. Abbreviations are: time to peak deoxy-haemoglobin, TTPHHb; reoxygenation,ΔReoxy; reoxygenation rate, Reoxy rate. The symbols represent comparisons between INSP and CTRL (), INSP and MATCH (#). The number of symbols; one, two and three denote likely, very likely and almost certainly respectively, that the chance of the true effect exceeds a small (-0.2–0.2) effect size. Values are reported as mean±SD.
Muscle oxygenation
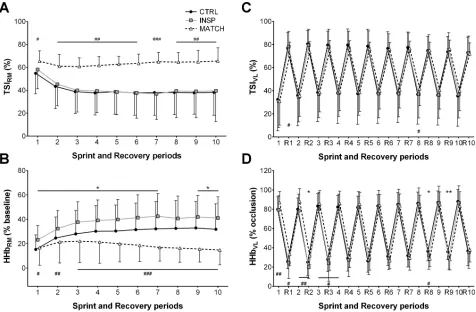
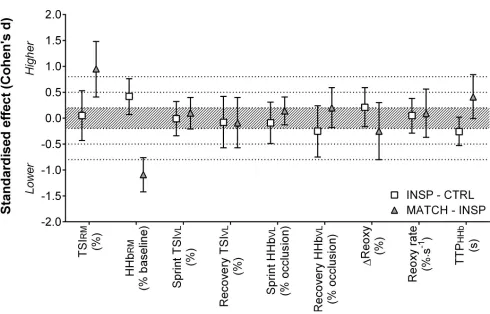
Muscle oxygenation responses to exercise are presented inTable 3and Figs5,6,7and8. Dif-ferences wereunclearbetween INSP and CTRL for TSIRM(1.0%±7.5%), but MATCH was
very likelylower than INSP (22.1%±12.5%). Average HHbRMwaslikelygreater during INSP
compared to CTRL (9.0%±7.5%). Conversely, HHbRMwas lower during MATCH compared
to INSP (-19.6%±6.0%).
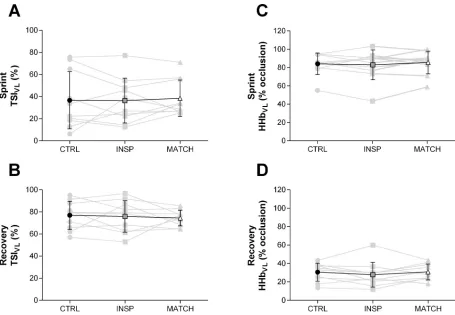
Differences of sprint TSIVL(-0.3%±9.5%) and recovery TSIVL(-1.1%±7.0%) wereunclear
between INSP and CTRL. Similarly, the differences between INSP and CTRL for both sprint HHbVL(-1.1%±5.1) and recovery HHbVL(-2.7%±5.4%) wereunclear. There was no meaning-ful difference between INSP and CTRL for TTPHHb(-5.8%±6.0%) andΔReoxy (4.7%±8.3). Additionally, there was anuncleardifference in Reoxy rate (0.0%±0.3%).
In MATCH exercise, differences in TSIVLwere unclear compared to INSP for both sprint (2.2%±6.7%), and recovery (-1.4%±7.6) phases. Additionally, there was no meaningful differ-ence in sprint HHbVL(-1.1%±5.1%), and anuncleardifference for recovery HHbVL(3.0%
±5.7%). The TTPHHbwas greater during MATCH than INSP (12.0%±14.4%). There were also
uncleardifferences inΔReoxy (-5.2%±11.5%), and Reoxy rate (0.1%±0.4%).
Fig 5. Respiratory and locomotor muscle NIRS responses to repeated-sprints during the control (CTRL) inspiratory loading (INSP) and work matched (MATCH) experiment sessions. (A) Respiratory muscle tissue saturation index (TSIRM) (n = 8). (B) Respiratory muscle deoxy-haemoglobin (HHbRM). (C) Vastus lateralis tissue saturation index (TSIVL). (D) Vastus lateralis deoxy-haemoglobin (HHbVL). Values are presented as mean±SD. The symbols represent comparisons between INSP and Control (), INSP and MATCH (#). The number of symbols; one, two and three denote likely, very likely and almost certainly respectively, that the chance of the true effect exceeds a small (-0.2–0.2) effect size. Values are presented as mean±SD.
Fig 6. Mean locomotor muscle NIRS responses to repeated-sprints during the control (CTRL) inspiratory loading (INSP) and work matched (MATCH) experiment sessions. (A) Sprint vastus lateralis tissue saturation index (Sprint TSIVL). (B) Recovery vastus lateralis tissue saturation index (Recovery TSIVL). (C) Sprint vastus lateralis haemoglobin (Sprint HHbVL). (D) Recovery vastus lateralis deoxy-haemoglobin (Recovery HHbVL). Individual responses are represented by the grey lines and mean responses are represented by black lines. The symbols represent comparisons between INSP and Control (), INSP and MATCH (#). The number of symbols; one, two and three denote likely, very likely and almost certainly respectively, that the chance of the true effect exceeds a small (-0.2–0.2) effect size. Vales are presented as mean±SD.
https://doi.org/10.1371/journal.pone.0222487.g006
Fig 7. Mean respiratory muscle NIRS responses to repeated-sprints during the control (CTRL) inspiratory loading (INSP) and work matched (MATCH) experiment sessions. (A) Respiratory muscle tissue saturation index (TSIRM) (n = 8). (B) Respiratory muscle deoxy-haemoglobin (HHbRM). Individual responses are represented by the grey lines and mean responses are represented by black lines. The symbols represent comparisons between INSP and Control (), INSP and MATCH (#). The number of symbols; one, two and three denote likely, very likely and almost certainly respectively, that the chance of the true effect exceeds a small (-0.2–0.2) effect size. Vales are presented as mean±SD.
Discussion
This study examined intercostal and vastus lateralis muscle oxygenation trends during repeated-sprint exercise with heightened respiratory muscle work. The addition of inspiratory loading increased mouth pressure and respiratory muscle deoxygenation. However, these altered responses had no meaningful impact on blood arterial O2saturation and tissue oxygen-ation trends within the vastus lateralis locomotor muscle. We interpret these findings to sug-gest that during maximal intermittent work, O2delivery to the respiratory and locomotor muscles can be maintained. Unlike during continuous aerobic exercise [24,25], the significant increase inVO_ 2appears to compensate for the elevated metabolic demands of the respiratory muscles when relatively short periods of rest separate bouts of all-out sprint.
Work of breathing and respiratory muscle oxygenation
Hyperpnoea during high-intensity exercise requires a considerable portion of whole-body _
VO2to support the metabolic demands of the respiratory muscles [16], and is increased when an inspiratory load is added [19]. In the present study, pulmonaryVO_ 2was elevated by 4–5% during both the sprint and recovery phases of the repeated-sprint protocol when an inspiratory load was added. This occurred even though there was no meaningful difference in total loco-motor work completed during the INSP and CTRL experiment sessions.
Fig 8. Standardised effects (Cohen’s d) with 90% confidence intervals for NIRS variables comparing inspiratory loading (INSP) to control (CTRL), and work matched exercise (MATCH) to INSP. Shaded area indicates a trivial effect, and dotted lines thresholds for small, moderate and large effects.
Abbreviations are: respiratory muscle tissue saturation index, TSIRM; respiratory muscle deoxy-haemoglobin, HHbRM; vastus lateralis tissue saturation index, TSIVL; vastus lateralis deoxy-haemoglobin, HHbVL; vastus laterals reoxygenation,ΔReoxy; vastus laterals reoxygenation rate, Reoxy rate; time to peak deoxy-haemoglobin, TTPHHb.
When subjects exercised with the inspiratory load,V_Ewas 19.6% lower compared to CTRL,
achieved via a reduction infR. Regardless of these changes, SPO2was not different between exercise conditions. Either consciously or subconsciously choosing a lowerV_E, subjects may
have counteracted, or at least attenuated, the expected work of breathing with INSP. When the change infRwas accounted for, respiratory muscle force developments (
R
Pm×fR) was sub-stantially higher during INSP compared to CTRL (734%). HigherRPm×fRin conjunction with the elevated HHbRMin the current study, suggests that O2utilisation by the respiratory muscles was increased with inspiratory loading, as shown previously [20,24]. Furthermore, there wereuncleardifferences in TSIRM, which when considered concomitantly with an ele-vated HHbRM, suggests that [O2Hb] was higher to match the demands for O2delivery of the respiratory muscles. Previous studies have shown similar changes in HHbRMin response to inspiratory loading [24] and resistive breathing [25]. The present data further suggests mainte-nance of respiratory muscle oxygenation with inspiratory loading which contrasts with others who reported similar values forRPm×fR[38]. However, preserved respiratory muscle oxygen-ation may have negative consequences for exercise tolerance if blood flow is redistributed away from the active limbs to meet the metabolic demands of breathing.
During continuous high-intensity exercise when the work of breathing is high, there can be an increase in vascular resistance and a reduction in limb perfusion [18,19,39]. The accumu-lation of metabolites in the respiratory muscles stimulates group IV afferent discharge in these muscles [40], leading to sympathetically mediated efferent discharge and vasoconstriction in the locomotor muscles [18,41]. Despite the clear increase in respiratory muscle deoxygenation with the addition of an inspiratory load, there was no clear negative effect on vastus lateralis oxygenation. The intermittent nature of repeated-sprint exercise may probably allow sufficient recovery time to prevent the accumulation of fatigue-inducing metabolites.
Locomotor muscle oxygenation
Inspiratory loading had no discernible effects on sprint HHbVLor TSIVLdespite a considerable increase in the work of breathing and respiratory muscle O2utilisation (Figs5,6and8). At sprint onset there is a rapid decrease in muscle oxygenation as evidenced by a reduction in TSIVLand an elevation in HHbVL, and as sprints are repeated, there is an eventual plateau [1,
It is likely that locomotor muscle oxygenation will only be compromised when cardiac out-put can no longer increase to meet the O2demands of both the respiratory and locomotor muscles simultaneously. It has been demonstrated that while exercising at near-maximal work rates, there is no accompanying increase in cardiac output andVO_ 2with inspiratory loading, and as a result limb blood flow is compromised [18,19]. This presumably occurs when the pre-scribed exercise intensity is sufficient to elicit sustainedVO_ 2peak, and therefore, no further
increase can occur. In the present study there was a 4–5% increase inVO_ 2throughout the repeated-sprint protocol with inspiratory loading, which is similar to others having shown an increase inVO_ 2during submaximal exercise [20]. These data demonstrate that during repeated-sprint exercise, there is additional capacity forVO_ 2increase to meet the heightened metabolic demands of inspiratory loading, which may be a crucial factor in maintaining loco-motor muscle oxygenation. Secondly, the intermittent nature of repeated-sprint exercise will minimise the development of diaphragm fatigue and the activation of the respiratory muscle metaboreflex which is promoted during sustained high-intensity exercise [17]. As shown in
Fig 4, pulmonaryVO_ 2fluctuated between 90% and 70% ofVO_ 2peakduring sprint and recovery
phases, respectively, during the control condition. Moreover, the addition of an inspiratory load increasedVO_ 2by�5% in both the sprint and recovery phases. The fluctuation in meta-bolic demands exemplified by the undulatingVO_ 2likely minimises the opportunity for sub-stantial competition of available cardiac output to develop, and the impairment of tissue reoxygenation.
Hyperventilation was present in both CTRL, and to a lesser degree, INSP experiment ses-sions, which may have had a protective effect on vastus lateralis oxygenation. Hyperventilation is associated with an increase in alveolar ventilation disproportionate toVO_ 2(pressure of alve-olar O2increases), and PACO2(pressure of alveolar CO2decreases) [44]. This is a potential mechanism associated with high-intensity exercise which can constrain a fall in arterial O2and pH [44,45]. Despite a reduction ofV_Ein a state of heightened O2demand during the INSP
session, SpO2was maintained. In studies where vastus lateralis tissue oxygenation was impaired during exercise with resistive breathing and inspiratory loading, there was moderate exercise-induced arterial hypoxemia (88–93%) [24,25,46]. Exercise-induced arterial hypox-emia is a known limiting factor of exercise [46], and preventing it with supplemental O2can attenuate peripheral muscle fatigue [47]. Though exercise-induced arterial hypoxemia has been observed during similar repeated-sprint exercise protocols [12], there was no evidence of its occurrence in the present study. We acknowledge that interpretation of fingertip SpO2data in cycling may be affected by some data loss caused by hand movement artefact and tight grip-ping of the handlebars [25,48], and that monitoring at the earlobe could potentially attenuate this limitation [24,49]. However, on close inspection of our SPO2data, we do not believe that the minimal data loss we experienced affected our results and interpretation of the data. None-theless, we conclude that alterations in repeated-sprint oxygenation caused by an elevated work of breathing may only occur if a moderate level of exercise-induced arterial hypoxemia takes place.
to previous work using an 8-mm aperture [24,38]. Additionally,V_Ewas considerably higher
than in previous work [24,25], which would have contributed to a heightened work of breathing.
Work-matched exercise
To our knowledge, this is the first time repeated work matched bouts of exercise have been used to examine the demands of repeated-sprint exercise under altered metabolic conditions. Despite a similar degree of vastus lateralis tissue deoxygenation during the work-matched sprints (Figs5and6), the physiological load placed on the cardiovascular system was consider-ably lower. This is evidenced by the consistently lowerVO_ 2, probably due to markedly lower respiratory muscle O2utilisation. But more importantly,VO_ 2was heavily influenced by how exercise was prescribed. Matching total work was achieved by replicating mean power output for each sprint, and therefore was lacking maximal acceleration and power production typi-cally associated with sprint exercise. For example, there was a clear difference in peak power output between INSP (1097±148 W) and MATCH (773±122 W) exercise conditions. In a typical sprint, power output peeks within 1–2 s and progressively declines as the sprint contin-ues [23,50]. When sprints are repeated and separated by incomplete recovery periods, both peak and mean power output gradually decline as fatigue accumulates [1–4,49]. By matching for mean power output and eliminating the opportunity for subjects to “maximally” exert themselves, the reliance on intramuscular ATP and PCr hydrolysis would have been reduced [2,51], and metabolic perturbations associated with maximal exercise minimised [2,5,51]. Despite a substantial decrease inVO_ 2and the O2cost associated with the work of breathing, there was no substantial difference inΔReoxy or in Reoxy rate. This implies that tissue reoxy-genation was maximal in all exercise conditions since the now “available” cardiac output was not being utilised to reoxygenate the locomotor muscles [18]. It seems that there exists some degree of reserve in the cardiovascular system that is called upon to maintain respiratory and locomotor muscle oxygenation when the work of breathing is high. Therefore, the O2cost of breathing in repeated-sprint cycling is unlikely to have a meaningful negative impact on loco-motor muscle oxygenation.
Conclusions
A crucial factor of repeated-sprint performance is the reoxygenation capacity between sprint bouts [11,13,14]. We further tested this mechanism by increasing the work of breathing, which is known to negatively influence limb blood flow and O2delivery at least in endurance exercise [16–18,39]. The present data demonstrate that the addition of inspiratory loading did not impair oxygenation of the vastus lateralis. When maximal exercise is interspersed with short rest periods, the cardiovascular system appears to maintain O2delivery to both the loco-motor and respiratory muscles in a state of heightened inspiratory muscle work.
Author Contributions
Conceptualization: Ramo´n F. Rodriguez, Nathan E. Townsend, Robert J. Aughey, Franc¸ois
Billaut.
Data curation: Ramo´n F. Rodriguez.
Formal analysis: Ramo´n F. Rodriguez.
Funding acquisition: Ramo´n F. Rodriguez.
Methodology: Ramo´n F. Rodriguez, Nathan E. Townsend, Robert J. Aughey, Franc¸ois Billaut.
Project administration: Ramo´n F. Rodriguez.
Resources: Ramo´n F. Rodriguez.
Software: Ramo´n F. Rodriguez.
Supervision: Nathan E. Townsend, Robert J. Aughey, Franc¸ois Billaut.
Validation: Ramo´n F. Rodriguez.
Visualization: Ramo´n F. Rodriguez.
Writing – original draft: Ramo´n F. Rodriguez.
Writing – review & editing: Ramo´n F. Rodriguez, Nathan E. Townsend, Robert J. Aughey,
Franc¸ois Billaut.
References
1. Racinais S, Bishop DJ, Denis R, Lattier G, Mendez-Villaneuva A, Perrey S. Muscle deoxygenation and neural drive to the muscle during repeated sprint cycling. Medicine and Science in Sports and Exercise. 2007; 39(2):268–74. Epub 2007/02/06.https://doi.org/10.1249/01.mss.0000251775.46460.cbPMID:
17277590.
2. Gaitanos GC, Williams C, Boobis LH, Brooks S. Human muscle metabolism during intermittent maximal exercise. Journal of Applied Physiology. 1993; 75(2):712–9. Epub 1993/08/01.https://doi.org/10.1152/ jappl.1993.75.2.712PMID:8226473.
3. Mendez-Villanueva A, Edge J, Suriano R, Hamer P, Bishop DJ. The recovery of repeated-sprint exer-cise is associated with PCr resynthesis, while muscle pH and EMG amplitude remain depressed. PLoS ONE. 2012; 7(12):e51977. Epub 2013/01/04.https://doi.org/10.1371/journal.pone.0051977PMID:
23284836; PubMed Central PMCID: PMC3524088.
4. Hureau TJ, Ducrocq GP, Blain GM. Peripheral and Central Fatigue Development during All-Out Repeated Cycling Sprints. Medicine and Science in Sports and Exercise. 2016; 48(3):391–401. Epub 2015/10/27.https://doi.org/10.1249/MSS.0000000000000800PMID:26496420.
5. Parolin ML, Chesley A, Matsos MP, Spriet LL, Jones NL, Heigenhauser GJF. Regulation of skeletal muscle glycogen phosphorylase and PDH during maximal intermittent exercise. Am J Physiol. 1999; 277(5):E890–900.https://doi.org/10.1152/ajpendo.1999.277.5.E890WOS:000083598700016. PMID:
10567017
6. Harris RC, Edwards RH, Hultman E, Nordesjo¨ LO, Nylind B, Sahlin K. The time course of phosphoryl-creatine resynthesis during recovery of the quadriceps muscle in man. Pflugers Archiv: European jour-nal of physiology. 1976; 367(2):137–42.https://doi.org/10.1007/bf00585149PMID:1034909
7. Sahlin K, Harris RC, Hultman E. Resynthesis of creatine phosphate in human muscle after exercise in relation to intramuscular pH and availability of oxygen. Scandinavian Journal of Clinical and Laboratory Investigation. 1979; 39(6):551–8. Epub 1979/10/01.https://doi.org/10.3109/00365517909108833
PMID:43580.
8. De Blasi RA, Cope M, Elwell C, Safoue F, Ferrari M. Noninvasive measurement of human forearm oxy-gen consumption by near infrared spectroscopy. European Journal of Applied Physiology and Occupa-tional Physiology. 1993; 67(1):20–5.https://doi.org/10.1007/bf00377698PMID:8375359.
9. Grassi B, Pogliaghi S, Rampichini S, Quaresima V, Ferrari M, Marconi C, et al. Muscle oxygenation and pulmonary gas exchange kinetics during cycling exercise on-transitions in humans. Journal of Applied Physiology. 2003; 95(1):149–58.https://doi.org/10.1152/japplphysiol.00695.2002PMID:12611769
10. DeLorey DS, Kowalchuk JM, Paterson DH. Relationship between pulmonary O2 uptake kinetics and muscle deoxygenation during moderate-intensity exercise. Journal of Applied Physiology. 2003; 95 (1):113–20. Epub 2003/04/08.https://doi.org/10.1152/japplphysiol.00956.2002PMID:12679363. 11. Buchheit M, Cormie P, Abbiss CR, Ahmaidi S, Nosaka KK, Laursen PB. Muscle deoxygenation during
repeated sprint running: Effect of active vs. passive recovery. International Journal of Sports Medicine. 2009; 30(6):418–25. Epub 2009/05/14.https://doi.org/10.1055/s-0028-1105933PMID:19437381. 12. Smith KJ, Billaut F. Influence of cerebral and muscle oxygenation on repeated-sprint ability. European
13. Billaut F, Buchheit M. Repeated-sprint performance and vastus lateralis oxygenation: Effect of limited O2 availability. Scandinavian Journal of Medicine and Science in Sports. 2013; 23(3):185–93. Epub 2013/02/01.https://doi.org/10.1111/sms.12052PMID:23362832.
14. Buchheit M, Ufland P. Effect of endurance training on performance and muscle reoxygenation rate dur-ing repeated-sprint runndur-ing. European Journal of Applied Physiology. 2011; 111(2):293–301. Epub 2010/09/28.https://doi.org/10.1007/s00421-010-1654-9PMID:20872150.
15. Jones B, Hamilton DK, Cooper CE. Muscle oxygen changes following sprint interval cycling training in elite field hockey players. PLoS ONE. 2015; 10(3):e0120338.https://doi.org/10.1371/journal.pone. 0120338PMID:25807517
16. Aaron EA, Seow KC, Johnson BD, Dempsey JA. Oxygen cost of exercise hyperpnea: implications for performance. Journal of Applied Physiology. 1992; 72(5):1818–25. Epub 1992/05/01.https://doi.org/10. 1152/jappl.1992.72.5.1818PMID:1601791.
17. Dempsey JA, Romer L, Rodman J, Miller J, Smith C. Consequences of exercise-induced respiratory muscle work. Respiratory Physiology and Neurobiology. 2006; 151(2–3):242–50. Epub 2006/04/18.
https://doi.org/10.1016/j.resp.2005.12.015PMID:16616716.
18. Harms CA, Babcock MA, McClaran SR, Pegelow DF, Nickele GA, Nelson WB, et al. Respiratory muscle work compromises leg blood flow during maximal exercise. Journal of Applied Physiology. 1997; 82 (5):1573–83. Epub 1997/05/01.https://doi.org/10.1152/jappl.1997.82.5.1573PMID:9134907. 19. Harms CA, Wetter TJ, McClaran SR, Pegelow DF, Nickele GA, Nelson WB, et al. Effects of respiratory
muscle work on cardiac output and its distribution during maximal exercise. Journal of Applied Physiol-ogy. 1998; 85(2):609–18.https://doi.org/10.1152/jappl.1998.85.2.609PMID:9688739
20. Wetter TJ, Harms CA, Nelson WB, Pegelow DF, Dempsey JA. Influence of respiratory muscle work on VO2 and leg blood flow during submaximal exercise. Journal of Applied Physiology. 1999; 87(2):643– 51. Epub 1999/08/13.https://doi.org/10.1152/jappl.1999.87.2.643PMID:10444624.
21. Rodriguez RF, Townsend NE, Aughey RJ, Billaut F. Influence of averaging method on muscle deox-ygenation interpretation during repeated-sprint exercise. Scandinavian Journal of Medicine and Sci-ence in Sports. 2018; 28(11):2263–71. Epub 2018/06/09.https://doi.org/10.1111/sms.13238PMID:
29883534.
22. Rodriguez RF, Townsend NE, Aughey RJ, Billaut F. Respiratory Muscle Oxygenation is not impacted by Hypoxia during Repeated-sprint Exercise. Respiratory Physiology and Neurobiology. 2019; 260:114–21.https://doi.org/10.1016/j.resp.2018.11.006PMID:30453086.
23. Matsuura R, Arimitsu T, Yunoki T, Kimura T, Yamanaka R, Yano T. Effects of heat exposure in the absence of hyperthermia on power output during repeated cycling sprints. Biology of Sport. 2015; 32 (1):15–20.https://doi.org/10.5604/20831862.1125286PMID:25729145; PubMed Central PMCID: PMC4314599.
24. Turner LA, Tecklenburg-Lund S, Chapman RF, Stager JM, Duke JW, Mickleborough TD. Inspiratory loading and limb locomotor and respiratory muscle deoxygenation during cycling exercise. Respiratory Physiology and Neurobiology. 2013; 185(3):506–14. Epub 2012/12/12.https://doi.org/10.1016/j.resp. 2012.11.018PMID:23228896.
25. Nielsen HB, Boesen M, Secher NH. Near-infrared spectroscopy determined brain and muscle oxygen-ation during exercise with normal and resistive breathing. Acta Physiologica Scandinavica. 2001; 171 (1):63–70.https://doi.org/10.1046/j.1365-201X.2001.00782.xPMID:11350264.
26. Lamarra N, Whipp BJ, Ward SA, Wasserman K. Effect of interbreath fluctuations on characterizing exercise gas exchange kinetics. Journal of Applied Physiology. 1987; 62(5):2003–12. Epub 1987/05/ 01.https://doi.org/10.1152/jappl.1987.62.5.2003PMID:3110126.
27. Rossiter HB, Howe FA, Ward SA, Kowalchuk JM, Griffiths JR, Whipp BJ. Intersample fluctuations in phosphocreatine concentration determined by 31P-magnetic resonance spectroscopy and parameter estimation of metabolic responses to exercise in humans. The Journal of Physiology. 2000; 528 Pt 2:359–69. Epub 2000/10/18.https://doi.org/10.1111/j.1469-7793.2000.t01-1-00359.xPMID:
11034625; PubMed Central PMCID: PMC2270138.
28. Witt JD, Guenette JA, Rupert JL, McKenzie DC, Sheel AW. Inspiratory muscle training attenuates the human respiratory muscle metaboreflex. The Journal of Physiology. 2007; 584(3):1019–28.https://doi. org/10.1113/jphysiol.2007.140855PMID:17855758
29. Takaishi T, Sugiura T, Katayama K, Sato Y, Shima N, Yamamoto T, et al. Changes in blood volume and oxygenation level in a working muscle during a crank cycle. Medicine and Science in Sports and Exer-cise. 2002; 34(3):520–8. Epub 2002/03/07.https://doi.org/10.1097/00005768-200203000-00020PMID:
11880818.
31. Wolf M, Ferrari M, Quaresima V. Progress of near-infrared spectroscopy and topography for brain and muscle clinical applications. Journal of biomedical optics. 2007; 12(6):062104. Epub 2008/01/01.
https://doi.org/10.1117/1.2804899PMID:18163807.
32. Kovacsova Z, Bale G, Mitra S, de Roever I, Meek J, Robertson N, et al. Investigation of Confounding Factors in Measuring Tissue Saturation with NIRS Spatially Resolved Spectroscopy. Advances in Experimental Medicine and Biology. 2018; 1072:307–12. Epub 2018/09/05.https://doi.org/10.1007/ 978-3-319-91287-5_49PMID:30178363; PubMed Central PMCID: PMC6142855.
33. Niemeijer VM, Jansen JP, van Dijk T, Spee RF, Meijer EJ, Kemps HM, et al. The influence of adipose tissue on spatially resolved near-infrared spectroscopy derived skeletal muscle oxygenation: the extent of the problem. Physiological measurement. 2017; 38(3):539–54. Epub 2017/02/06.https://doi.org/10. 1088/1361-6579/aa5dd5PMID:28151429.
34. Messere A, Roatta S. Influence of cutaneous and muscular circulation on spatially resolved versus stan-dard Beer-Lambert near-infrared spectroscopy. Physiological Reports. 2013; 1(7):e00179. Epub 2014/ 04/20.https://doi.org/10.1002/phy2.179PMID:24744858; PubMed Central PMCID: PMC3970749. 35. Hopkins WG. Spreadsheets for analysis of controlled trials, with adjustment for a subject characteristic.
Sportscience. 2006; 10:46–50.
36. Cohen J. Statistical power analysis for the behavioral sciencies: Routledge; 1988.
37. Hopkins WG, Marshall SW, Batterham AM, Hanin J. Progressive statistics for studies in sports medicine and exercise science. Medicine and Science in Sports and Exercise. 2009; 41(1):3–13. Epub 2008/12/ 19.https://doi.org/10.1249/MSS.0b013e31818cb278PMID:19092709.
38. Turner LA, Tecklenburg-Lund SL, Chapman R, Shei RJ, Wilhite DP, Mickleborough T. The Effect of Inspiratory Muscle Training on Respiratory and Limb Locomotor Muscle Deoxygenation During Exer-cise with Resistive Inspiratory Loading. International Journal of Sports Medicine. 2016;(EFirst). Epub 18.05.2016.https://doi.org/10.1055/s-0042-104198PMID:27191210
39. Sheel AW, Derchak PA, Morgan BJ, Pegelow DF, Jacques AJ, Dempsey JA. Fatiguing inspiratory mus-cle work causes reflex reduction in resting leg blood flow in humans. The Journal of Physiology. 2001; 537(Pt 1):277–89. Epub 2001/11/17.https://doi.org/10.1111/j.1469-7793.2001.0277k.xPMID:
11711580; PubMed Central PMCID: PMC2278925.
40. Hill JM. Discharge of group IV phrenic afferent fibers increases during diaphragmatic fatigue. Brain Research. 2000; 856(1–2):240–4.https://doi.org/10.1016/s0006-8993(99)02366-5PMID:10677632. 41. St Croix CM, Morgan BJ, Wetter TJ, Dempsey JA. Fatiguing inspiratory muscle work causes reflex
sym-pathetic activation in humans. The Journal of Physiology. 2000; 529(2):493–504.https://doi.org/10. 1111/j.1469-7793.2000.00493.xPMID:11101657
42. Esaki K, Hamaoka T, Radegran G, Boushel R, Hansen J, Katsumura T, et al. Association between regional quadriceps oxygenation and blood oxygen saturation during normoxic one-legged dynamic knee extension. European Journal of Applied Physiology. 2005; 95(4):361–70. Epub 2005/08/13.
https://doi.org/10.1007/s00421-005-0008-5PMID:16096839.
43. Legrand R, Ahmaidi S, Moalla W, Chocquet D, Marles A, Prieur F, et al. O2 arterial desaturation in endurance athletes increases muscle deoxygenation. Medicine and Science in Sports and Exercise. 2005; 37(5):782–8. Epub 2005/05/05.https://doi.org/10.1249/01.mss.0000161806.47058.40PMID:
15870632.
44. Forster HV, Haouzi P, Dempsey JA. Control of breathing during exercise. Comprehensive Physiology. 2012; 2(1):743–77. Epub 2012/01/01.https://doi.org/10.1002/cphy.c100045PMID:23728984. 45. Whipp BJ, Ward SA. Determinants and control of breathing during muscular exercise. British Journal of
Sports Medicine. 1998; 32(3):199–211.https://doi.org/10.1136/bjsm.32.3.199PMC1756098. PMID:
9773167
46. Dempsey JA, Wagner PD. Exercise-induced arterial hypoxemia. Journal of Applied Physiology. 1999; 87(6):1997–2006.https://doi.org/10.1152/jappl.1999.87.6.1997PMID:10601141
47. Romer LM, Haverkamp HC, Lovering AT, Pegelow DF, Dempsey JA. Effect of exercise-induced arterial hypoxemia on quadriceps muscle fatigue in healthy humans. American Journal of Physiology—Regula-tory, Integrative and Comparative Physiology. 2006; 290(2):R365–R75.https://doi.org/10.1152/ ajpregu.00332.2005PMID:16166208
48. Yamaya Y, Bogaard HJ, Wagner PD, Niizeki K, Hopkins SR. Validity of pulse oximetry during maximal exercise in normoxia, hypoxia, and hyperoxia. Journal of Applied Physiology. 2002; 92(1):162–8.
https://doi.org/10.1152/japplphysiol.00409.2001PMID:11744656.
50. Bogdanis GC, Nevill ME, Boobis LH, Lakomy HK. Contribution of phosphocreatine and aerobic metabo-lism to energy supply during repeated sprint exercise. Journal of Applied Physiology. 1996; 80(3):876– 84. Epub 1996/03/01.https://doi.org/10.1152/jappl.1996.80.3.876PMID:8964751.
![Fig 2. Representative data of the raw NIRS responses to repeated-sprint exercise. (A) Concentrations of vastus lateralis total haemoglobin ([tHb]),oxyhaemoglobin ([O2Hb]), and deoxyhaemoglobin ([HHb]), and (B) vastus lateralis Tissue Saturation Index (TSI) for the entire repeated-sprint protocol.(C) [tHb], [O2Hb], and [HHb], and (D) TSI for the first 10-s sprint and the following 30-s of passive rest.](https://thumb-us.123doks.com/thumbv2/123dok_us/8018235.1333393/7.612.77.576.73.402/representative-concentrations-lateralis-haemoglobin-oxyhaemoglobin-deoxyhaemoglobin-lateralis-saturation.webp)