ABSTRACT
MITCHELL, EDWIN COLEMAN. Improving and Exploiting Analytical Tools for Real Time Quantitative Studies in Complex Matrices. (Under the direction of Dr. Leslie A. Sombers).
Electrochemical techniques have been used for many years to provide answers to fundamental research questions in challenging environments. For example, coupling fast-scan cyclic voltammetry (FSCV) with carbon-fiber microelectrodes (CFMEs) was groundbreaking in the field of neuroscience because it became possible to directly measure chemical release events occurring in the brain in real time. Over the past twenty years, characterization of FSCV at CFMEs has enabled groundbreaking work in live brain tissue, but many questions remain unanswered, often due to technological limitations. The research presented herein will contribute to the advancement of in vivo electrochemical techniques by chemically characterizing the carbon surface upon potential application, describing novel strategies to manipulate the geometry of the electrode, and by investigating complex potential waveforms applied to the electrode.
preconditioning the carbon surface introduced beneficial microstructural alterations. Static potential waveforms were more effective than dynamic potential waveforms. In addition, this work demonstrates that the carbon microstructure is dynamic in nature and that it quickly responds to applied electrochemical potentials.
Single cells are commonly used as model systems when studying exocytosis. The most common approach has been to couple amperometry with a disk-CFME positioned directly on top of the cell, which allows for the measurement of individual vesicular release events. In this work, a controllable plasma-etching procedure was used to create a CFME with a recessed cavity geometry that was implemented to detect exocytotic events at chromaffin cells. When compared to traditional disk-CFME, the cavity-CFME were able to detect more molecules per release event, suggesting that traditional disk-CFMEs may underestimate vesicular quantal size.
Due to geometrical limitations of the electrode and the challenging recording environment of the cytoplasm, most electrochemical measurements at single cells have been limited to the extracellular environment. In this work, a conical nanoelectrode was insulated using a novel coating procedure and employed to make intracellular chemical measurements. These unprecedented measurements served to distinguish norepinephrine and epinephrine in vesicles that lysed onto the electrode surface. This work also highlights the complementary information that can be gained from voltammetric and amperometric studies.
distinguishing the voltammetric signals of hydrogen peroxide and pH shift, as the voltammograms for these species both contain significant oxidation current at ~1.3 V. Herein, we present a unique double waveform that can be coupled to a mathematical model to allow for identification and quantification of these two components in a mixed signal.
Improving and Exploiting Analytical Tools for Real Time Quantitative Studies in Complex Matrices
by
Edwin Coleman Mitchell
A dissertation submitted to the Graduate Faculty of North Carolina State University
in partial fulfillment of the requirements for the degree of
Doctor of Philosophy
Chemistry
Raleigh, North Carolina 2017
APPROVED BY:
_______________________________ _______________________________
Leslie Sombers Edmond Bowden
Committee Chair
_______________________________ _______________________________
DEDICATION
BIOGRAPHY
ACKNOWLEDGMENTS
There are many people who have helped me through this process and made it possible for me to complete this work.
I want to first thank Dr. Leslie Sombers for her support during my graduate career. I am grateful to all of the Sombers lab members for the help they have provided at various times. I am especially grateful to James Roberts and Lars Dunaway for the long hours they put in to help with culturing cells.
I want to thank Chuck Mooney with the Analytical Instrumentation Facility at NCSU who helped with SEM image collection.
I am thankful for my church family which has been helpful to both me and my wife during this time.
I never would have made it this far without the encouragement from my mom and dad to always do my best in school. Thank you for the continual help that you provide me and my family.
TABLE OF CONTENTS
LIST OF TABLES ...xi
LIST OF FIGURES ...xii
CHAPTER 1: Introduction to Voltammetric Methods Used to Monitor Neuronal Transmission and Requirements for Technique Optimization ...1
1.1 Neurons and Chemical Signaling ...1
1.2 Neuroscience Research Methods ...3
1.3 Analytical Methodologies for Measuring Neurotransmission ...4
1.3.1 Electrophysiology ...5
1.3.2 Microdialysis ...6
1.3.3 Spectroscopic Techniques ...7
1.3.4 Electrochemical Methods ...7
1.4 Fast-Scan Cyclic Voltammetry ...9
1.5 Data Analysis ...12
1.6 Carbon-Fiber Microelectrodes ...13
1.7 Dissertation Overview ...18
1.8 References ...21
CHAPTER 2: Spectroelectrochemical Chemical Characterization of the Carbon Fiber Surface in Response to Electrochemical Conditioning ...27
2.1 Introduction ...27
2.2.1 Chemicals ...29
2.2.2 Electrode Fabrication ...29
2.2.3 Flow Injection ...30
2.2.4 Electrochemical Data Acquisition ...30
2.2.5 Surface Analysis ...31
2.2.6 Data Analysis ...32
2.3 Results and Discussion ...32
2.3.1 Microsctructural Characterization with Raman Spectroscopy ...32
2.3.2 Dynamic and Static Waveform Potentials Alter the Carbon Surface ...37
2.3.3 Dynamic and Static Pretreatments Differentially Affect Electrochemical Performance ...41
2.3.4 Rate of Change Comparison ...46
2.3.5 Surface Response to Alternating Static Potentials ...48
2.4 Conclusions ...50
2.5 References ...52
CHAPTER 3: Recessed Carbon-Fiber Microelectrodes for Use with Amperometry At Single Cells and FSCV in Brain Slice Preparations ...57
3.1 Introduction ...57
3.2 Experimental Section ...60
3.2.1 Chemicals ...60
3.2.2 Microelectrode Fabrication ...61
3.2.4 Fast-Scan Cyclic Voltammetry ...62
3.2.5 Raman Spectroscopy ...62
3.2.6 Brain Slice Preparation ...63
3.2.7 Primary Bovine Chromaffin Cell Culture ...63
3.2.8 Single Cell Experiments ...64
3.2.9 Amperometry Data Acquisition and Analysis ...65
3.2.10 Slow-Scan Cyclic Voltammetry ...65
3.2.11 Data Analysis and Statistics ...66
3.3 Results and Discussion ...66
3.3.1 Etching Carbon-Fiber Microelectrodes ...66
3.3.2 Controlling Cavity Depth ...69
3.3.3 Electrochemical Characterization ...70
3.3.4 Monitoring Neurotransmitter Release in Live Tissue ...78
3.3.5 Monitoring Individual Exocytotic Events at Single Cells ...80
3.4 Conclusions ...84
3.5 References ...86
CHAPTER 4: Intracellular Chemical Measurements Using Nanocone Electrodes ...92
4.1 Introduction ...92
4.2 Experimental Section ...95
4.2.1 Chemicals ...95
4.2.3 Flow Injection ...96
4.2.4 Electrochemical Data Acquisition ...97
4.2.5 Primary Bovine Chromaffin Cell Culture ...98
4.2.6 Single Cell Experiments ...99
4.2.7 Data Analysis ...99
4.3 Results and Discussion ...99
4.3.1 Electrode Fabrication ...99
4.3.2 Electrochemical Characterization ...106
4.3.3 Intracellular Voltammetry ...112
4.4 Conclusions ...119
4.5 References ...120
CHAPTER 5: A Double Voltammetric Waveform for Distinguishing Overlapping Signals from pH and Hydrogen Peroxide ...123
5.1 Introduction ...123
5.2 Experimental Section ...126
5.2.1 Chemicals ...126
5.2.2 Electrode Fabrication ...126
5.2.3 Flow Injection ...127
5.2.4 Electrochemical Data Acquisition ...127
5.2.5 InVivo Data Collection ...128
5.2.6 Data Analysis ...129
5.3.1 H2O2 and ΔpH Investigated with Single Waveform Cyclic
Voltammetry ...129
5.3.2 Cyclic Voltammetry with a Double Waveform ...132
5.3.3 Constructing the Training Set ...134
5.3.4 pH Subtraction Extended to In vivo Data ...137
5.4 Conclusions ...139
5.5 References ...141
CHAPTER 6: Summary and Outlook ...143
APPENDICIES ...146
APPENDIX A: Supplemental Information to Chapter 3 ...147
A.1 Supporting Information ...147
APPENDIX B: Characterization of Abiotic Manganese Dioxide Reactivity Using Voltammetry ...149
B.1 Introduction ...149
B.2 Experimental Section ...151
B.2.1 Chemicals ...151
B.2.2 Preparation of Manganese Minerals ...151
B.2.3 Electrochemical Data Acquisition ...151
B.2.4 Data Analysis ...152
B.3 Results and Discussion ...152
B.3.2 Verification of the MnO2 Voltammetric Signal ...155
B.3.3 Zinc and Arsenic Doped MnO2 ...157
B.3.4 Electron Transfer Rate Measurements ...159
B.4 Conclusions ...162
B.5 References ...164
LIST OF TABLES
Table 2.1 Microcrystallite Dimensions for the Different States of the P-55
Carbon Fiber ...36 Table 2.2 Peak-to-Peak Separation for the Detection of 2 µM Dopamine ...45 Table B.1 Calculated electron transfer rates for the reduction of abiotic
manganese oxides ...162 Table B.2 Average manganese oxidation numbers for abiotic manganese oxides ...162
LIST OF FIGURES
Figure 1.1 Cellular communication with neurons ...3
Figure 1.2 Diagram depicting process for background subtracted FSCV ...10
Figure 1.3 Diagram depicting process for constructing color plots used for analysis ...13
Figure 1.4 Images of commonly used carbon-fiber microelectrodes ...15
Figure 2.1 Experimental design ...33
Figure 2.2 Polishing increases disorder on carbon surface ...35
Figure 2.3 Dynamic and static conditioning paradigms elicit distinct changes to the carbon surface ...37
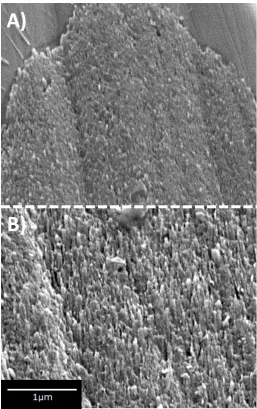
Figure 2.4 Surface changes can be visualized using SEM ...40
Figure 2.5 Conditioning affects electrochemical performance ...41
Figure 2.6 Electrochemical conditioning does not increase electrode surface area ...44
Figure 2.7 Conditioning alters electrochemical response for ascorbic acid ...46
Figure 2.8 Static conditioning with positive potentials rapidly changes the carbon surface ...47
Figure 2.9 Carbon surface changes are dynamic ...49
Figure 3.1 Fabrication of cavity electrodes ...68
Figure 3.2 Cavity electrodes ...70
Figure 3.4 Field Emissions SEM and Raman imaging on plasma-etched
electrodes ...75
Figure 3.5 Voltammetric estimation of surface area ...78
Figure 3.6 Diminished mass transport in live tissue ...79
Figure 3.7 Amperometric recording of individual exocytotic events at single bovine chromaffin cells ...81
Figure 4.1 Wet etching provides a facile means for producing conical electrodes ...101
Figure 4.2 Electrodes are masked and insulated ...103
Figure 4.3 Scanning electron micrograph of an insulated conical carbon fiber ...104
Figure 4.4 Wax coating was removed with repeated application of waveform ...106
Figure 4.5 Electrodes with polymer and wax bilayer coating show a stable response ...107
Figure 4.6 Electrochemical characterization of dopamine at conical electrodes ...108
Figure 4.7 Conical electrodes detect individual exocytotic events at single cells ...109
Figure 4.8 Insertion of an electrode into a single cell ...110
Figure 4.9 Amperometric detection of intracellular vesicle content ...111
Figure 4.10 Intracellular voltammetry ...113
Figure 4.12 Chemical identification and quantification of intracellular
vesicle content ...117
Figure 4.13 Intracellular norepinephrine and epinephrine contents ...118
Figure 5.1 Characteristic colorplots and voltammograms for H2O2 and ΔpH ...130
Figure 5.2 Current is linearly related to the amount of species present ...131
Figure 5.3 Disambiguating H2O2 and ΔpH with a double waveform ...134
Figure 5.4 Building a training set ...136
Figure 5.5 Verification of pH subtraction model with in vivo data ...139
Figure A.1 Plasma etching apparatus ...147
Figure A.2 Cavity carbon-fiber electrodes can be created using FSCV ...148
Figure B.1 Diagram depicting the process used to prepare the electrode for analysis of MnO2 ...154
Figure B.2 Electrochemical measurements of manganese oxides ...155
Figure B.3 Current increases linearly with surface coverage ...156
Figure B.4 Reductive current increases linearly with applied scan rate. ...157
Figure B.5 Voltammetry of metal doped manganese oxides ...158
CHAPTER 1
Introduction to Voltammetric Methods Used to Monitor Neuronal Transmission and Requirements for Technique Optimization
1.1 Neurons and Chemical Signaling
Our understanding of how the nervous system works has come a long way from the days of Cajal, who showed us that the brain is composed of individual cells which are called neurons.1 We have since come to recognize the brain as the most important organ in our body as it dictates everything from how we move and communicate to how we learn and perceive the world around us. The brain functions primarily through a complex system of electrical and chemical signaling pathways that when altered can modify behavior in significant ways.2, 3 There have been many significant advances over the years toward helping us better understand how the brain functions, but we are still woefully lacking a clear understanding of the molecular mechanisms that underlie many neurodegenerative diseases.4 As the average age of the population continues to increase5 and neurological disorders continue to appear in younger populations 6, it is clear why it is imperative that we continue
to seek a better understanding of how the brain functions.
dendrites, and axon. The axon from one neuron projects to other neurons where they meet at a junction called the synapse. There are trillions of synapses in the human brain and they can form between the axon of once neuron and either the soma or dendrites of another neuron.8 It is at synapses where signals are propagated from one cell to another.
Signal propagation through neurons occurs when the cell receives an electrical impulse called an action potential.9 Action potentials are formed when ions cross the cell membrane and cause a depolarization of the neuron. Once an action potential begins it travels down the axon to its terminal region. It is at this point that there is an influx of calcium via the opening of calcium channels and chemical messengers packaged in vesicles are released across the membrane through a process called exocytosis. These released chemicals are referred to as neurotransmitters. Once released into the synaptic cleft the neurotransmitters can bind to receptors on the post-synaptic neuron in order to transmit a specific signal. Neurotransmitters can also be reuptaken into the pre-synaptic cell where they can be repackaged in vesicles, enzymatically degraded, or diffuse into the extracellular space.
Figure 1.1 Cellular communication with neurons. A neuron is shown with dendrite and axon projections along with a presynaptic and postsynaptic terminal forming a synapse. Vesicles in the terminal of the presynaptic neuron release their contents into the synaptic cleft where they can subsequently bind with receptors on the postsynaptic neuron. (https://commons.wikimedia.org/wiki/Neuron#/media/File:Derived_Neuron_schema_with_n o_labels.svg; https://commons.wikimedia.org/wiki/File:Synapse_blank.png)
1.2 Neuroscience Research Methods
Slices from animal brain tissue are another common avenue for conducting neuroscience research.10 Brain slices can be kept alive in oxygenated buffer solution for
several hours which allows time for experiments to be carried out. With brain slices it is possible to visibly place a sensor in a specific region of the brain in order to make measurements. This alleviates a lot of the complications that arise when working with a live animal and the brain circuitry can be less complicated to understand and manipulate. Brain slices do limit the conclusions that can be drawn from a study, however, because interconnected pathways have likely been disconnected during the slicing of the tissue. Single cells in culture, such as PC12 and chromaffin cells, are another environment that has been widely investigated because they offer an easier way of directly measuring phenomena such as exocytosis.11-13
A flow injection apparatus is a valuable tool that is often used during the development of new electrochemical sensors and for calibration of sensors used in vivo.14 A flow injection apparatus is an in vitro system that allows for placement of an electrode within a continuous flow of buffered electrolyte. To replicate neuronal transmission, a high performance liquid chromatography valve is used to inject a short bolus of analyte into the flowing electrolyte. This allows for the analyte to quickly pass over the electrode before being swept away, thereby simulating chemical release events in the brain.
1.3 Analytical Methodologies for Measuring Neurotransmission
technologies developed during the 20th century, doors were opened that made new research avenues possible in the neuroscience field.
A number of methods have been created or adapted for conducting neuroscience research. As with any analytical methodology there are figures of merit that must be considered when assessing the usefulness of a technique for a particular research goal. A few of the key figures of merit to consider with techniques for neuroscience research include chemical selectivity, spatial resolution and temporal resolution.
A high degree of chemical selectivity is required in order to verify the signal you are measuring because the brain is a complicated environment with a myriad of analytes that could potentially be detected. The brain is also composed of many regions with vast functional diversity. Therefore a high degree of spatial resolution is vital for disentangling the role of individual brain regions. In addition, neuronal firing occurs on millisecond time scales, so a high temporal resolution is necessary for monitoring distinct events.
1.3.1 Electrophysiology
1.3.2 Microdialysis
Microdialysis is a powerful technique for sampling a multitude of neurotransmitters.16
It is performed by inserting a probe into the brain region of interest and running a perfusion fluid within the membrane of the probe. As the perfusion fluid is pumped through, molecules are able to pass across the semi permeable membrane of the probe and be collected for analysis.17 Analysis is typically done offline by first separating the molecules with high performance liquid chromatography (HPLC) or capillary electrophoresis (CE).17
Many different detection methods have been used including UV-Vis, electrochemical, and mass spectrometry.
Excellent chemical selectivity is achieved with microdialysis because of the coupling with HPLC. It is simple enough to correlate peaks with their corresponding molecule on the chromatogram by running known standards. However, microdialysis has limitations associated with spatial and temporal resolution. A typical microdialysis probe is about 200-400 µm in diameter and 1-4 mm in length.18 This is much larger than individual release sites at synapses, and thus results in wide spatial averaging. The large probe size also damages a significant portion of the tissue surrounding the probe, thereby altering chemical diffusion to the membrane.19 The perfusion fluid is typically pumped at a rate of 1 µL/min, resulting in
1.3.3 Spectroscopic Techniques
The main advantage of using a spectroscopic method is that it is possible to implement on human subjects. However, this approach is impractical for small mammals, such as the rat or mouse, unless the subject is anesthetized. Two principle techniques are positron emission tomography (PET) and functional magnetic resonance imaging (fMRI). PET requires the subject to intake a radiolabeled chemical that will emit positrons. The chosen chemical will interact with receptors for a specific neurotransmitter and scanners are able to measure and record this interaction.20 fMRI measures variations in hydrogen spins that occur from changes in blood flow. Such changes indicate areas of brain activity. While it is possible to see a particular region that becomes activated, it is impossible to know what specific neurotransmitters are involved unless some type of pharmacological intervention is done. It is also difficult to incorporate this technique into behavioral studies.
1.3.4 Electrochemical Methods
describe the thermodynamics of this process is the Nernst Equation which relates the concentration (𝐶) of the analytes to the potential of the electrode (𝐸).
𝐸𝑞𝑢𝑎𝑡𝑖𝑜𝑛 1 𝐸 = 𝐸𝑜′+𝑅𝑇
𝑛𝐹ln (
𝐶𝑜𝑥𝑖𝑑𝑖𝑧𝑒𝑑 𝑠𝑝𝑒𝑐𝑖𝑒𝑠
𝐶𝑟𝑒𝑑𝑢𝑐𝑒𝑑 𝑠𝑝𝑒𝑐𝑖𝑒𝑠)
Some of the most commonly studied neurotransmitters such as dopamine, epinephrine, norepinephrine, and serotonin undergo this oxidative and reductive process easily. Additionally, the electrode can even be modified with enzymes so that molecules that are not electroactive, such as acetylcholine, can be detected by their enzymatic products.23-25 While there are many variations of electrochemical methods, for the purpose of this discussion we will limit our consideration to amperometry and voltammetry.
In amperometry the electrode is held at a constant potential in relation to a reference electrode. The holding potential is sufficient to oxidize or reduce the analyte under study. As soon as molecules come into contact with the electrode, current is passed and recorded. Calibration of electrodes with amperometry is not usually performed, but instead the total amount of species present is determined quantitatively by Faraday’s law26:
𝐸𝑞𝑢𝑎𝑡𝑖𝑜𝑛 2 𝑄 = 𝑛𝐹𝑚
oxidize within the holding potential will be detected. As stated above, any molecules that are electroactive at the holding potential will produce current and will contribute to the total measured signal. This makes it impossible in a complex matrix to say with certainty what species was detected.
With voltammetry, the potential of the electrode is swept across a range of potentials. The potential limits are generally set to contain the oxidation and the reduction potentials of the analyte under study. The current generated at specific potentials from the oxidation and reduction of a molecule during the sweep is plotted against the applied potential, which results in a voltammogram. Molecules will generate voltammograms with different shapes and features that can serve to identify the specific analyte. For this reason, there is much greater chemical selectivity inherent to cyclic voltammetry than amperometry.
1.4 Fast-Scan Cyclic Voltammetry
voltammograms are collected every second. This type of experiment allows for dynamic changes in chemical transmission to be monitored over time.
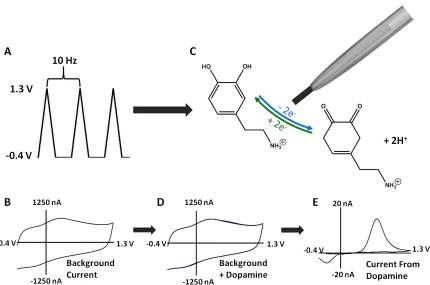
Figure 1.2 Diagram depicting process for background subtracted FSCV. A) A triangular waveform is continually applied at a high repition rate to the electrode. B) The fast scan rates that are used generate a large background current. C) Analyte, such as dopamine, that pass across the electrode surface undergo traditional redox processes. D) Faradaic current generated from oxidation and reduction of dopamine is added to the background current. E) The background current is subtracted from the faradaic current generated from dopamine to give a characteristic voltammogram.
𝐸𝑞𝑢𝑎𝑡𝑖𝑜𝑛 3 𝑖𝑝 = (2.69 𝑥 105)𝑛 3 2𝐴𝐷
1 2𝐶∗𝑣
1
2
where ip is the peak current, n is the number of electrons transferred, A is the area of the electrode, D is the diffusion coefficient of the analyte, 𝐶∗ is the concentration of the analyte in the bulk solution, and 𝑣 is scan rate. As shown here, the faster the scan rate that is implemented, the greater the current that will be generated, which is advantageous for improving the sensitivity of the technique.
The principle disadvantage of the fast scan rate is that it increases the amount of double-layer charging or background current collected at the electrode. This is illustrated in equation 4.
𝐸𝑞𝑢𝑎𝑡𝑖𝑜𝑛 4 |𝑖𝑐| = 𝐴𝐶𝑑𝑣
1.5 Data Analysis
It is common for FSCV experiments to last for 20 seconds or more. A new cyclic voltammogram is collected at a rate of 10 Hz and there are 1000 data points in every voltammogram. For a 20 second experiment this results in 200 voltammograms and 200,000 data points. To aid in data analysis, color plots are used to illustrate anodic and cathodic currents recorded during an experiment.27
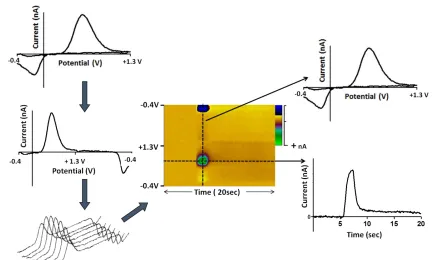
Figure 1.3 Diagram depicting process for constructing color plots used for analysis. Voltammograms are collected and unfolded at the switching potential and plotted in a linear fashion. The voltammograms are subsequently concatenated in the order they were collected in and false color is used to illustrate positive (green) and negative (blue) changes in current, thereby creating the color plot. From the color plot, the original voltammograms can be extracted by taking vertical slices at individual time points. Current verse time profiles at a single potential can also be extracted.
1.6 Carbon-Fiber Microelectrodes
offer, carbon-fiber microelectrodes (Figure 1.4) have proven to be the electrode of choice for coupling with FSCV.28
Carbon fibers are approximately 10 µm in diameter and as an electrode they are often either cut to 100 µm in length or polished in a disk geometry. This small size provides a number of useful benefits. First, the decreased size reduces the voltage drop across the electrode that is common in larger electrodes. This makes the use of an auxillary electrode unnessary and allows for a two electrode system, which is easier to implement in vivo.26 In
Figure 1.4 Images of commonly used carbon-fiber microelectrodes. A) Cylindrical electrode formed by heat sealing into a glass capillary and cutting the exposed carbon to 100 µm. B) Disk electrode formed by cutting the electrode shown in A at the glass seal, sealing in epoxy, and polishing on a diamond wheel.
Microelectrodes constructed from different metals have also been utilized with FSCV but carbon fiber boasts a number of advantages that make it preferrable to metal electrodes.28, 30 Carbon fibers resist biofouling better than metals. This is important since experiments are
done in the brain where many contaminants are present. Carbon-fibers also have a much wider potential window, are relatively inexpensive, and have a renewable surface.31, 32
of the electrode is also thought to be impacted by the presence of these oxygen groups at the surace.31 For example, it has been shown that the detection of dopamine is greatly enhanced
when the waveform applied to the electrode reaches +1.3 V and greater.38 It is thought that the higher potential increases the oxygen population by oxidizing the surafce, which incresases available adsorption sites.
Many research groups have investigated graphitic surfaces seeking to better understand their properties, using techniques such a Raman spectroscopy, X-ray photoelectron spectroscopy (XPS), and various microsccopies among other techniques.39-49 Raman spectroscopy with graphitic samples was first reported on in 1970 and has been widely used since as a means of determining microstructure characterisitcs.50 The sp2 hybridized carbon in graphitic samples as well as defects in the lattice are both easily identifiable in Raman spectra.51, 52 Changes in the microstructure have often been monitored
by comparing the ratio of the graphitic and defect like structures in the carbon sample. Part of the work described in Chapter 2 of this dissertation uses Raman spectroscopy to correlate the microstrucutral changes in the surface to electrochemical performance.
XPS is a common surface analysis technique that is capable of providing qualitative and semi-quantitative information on various elemental compositions.53 Analysis of single
even electrochemical techniques.55-57 Since the tag can be easily measured with the technique it is applicable with, it provides an indirect means of quantifying specific oxygen groups. For instance, the molecule 2,4-dinitrophenylhydrazine is able to specifically bind with quinone like groups. Using this molecule, McCreery and co-workers determined that quinone like groups are found on approximately 1.2% of the carbon atoms at the surface of glassy carbon.55
Many attempts have also been made at improving the electrochemical performance of carbon-fiber microelectrodes through various modification methods. One popular method of modifying the electrode is to add some type of coating to the surface.58 For instance, Nafion is a cation exchange polymer that has been successfully added to carbon electrodes and implemented with in vivo experiments.30, 59-61 With Nafion, electrodes display an increased sensitivity toward catecholamines which are positively charged at physiological pH. The Nafion membrane also helps block interferents, such as the anion ascorbic acid, from reaching the electrode surface and confounding the signal.
Carbon nanotubes have also shown promise for improving the electrochemical performance of carbon-fiber electrodes. Venton and co-workers have shown that carbon nanotubes can be coated onto carbon-fiber microelectrodes and coupled with FSCV.63-65 They found that sensitivity toward dopamine was enhanced with electrodes that had the carbon nanotubes attached versus bare carbon fibers. In addition to modifications, it is also possible to replace the carbon fiber material entirely with other carbon materials. For example, microelectrodes have been made recently enitrely out of carbon nanotube yarn material. The carbon nanotube yarn electrodes displayed faster apparent electron transfer properties and increased sensitivity to dopamine when compared to traditional carbon-fiber microelectrodes.66
As highlighted above, carbon-fiber microelectrodes are a powerful tool for neuroscience related research and much effort has gone into studying and exploiting their characteristic properties. This theme is continued in this dissertation as much of the research presented was aimed at advancing FSCV by better understanding and improving the carbon-fiber electrode.
1.7 Dissertation Overview
The remainder of this dissertation is composed of five additional chapters and highlights research done that expounds on the topics covered in Chapter 1.
characterization was correlated with electrochemical data, providing useful information for developing modified waveforms.
Chapter 3 details the steps taken to create a unique cavity electrode through a plasma etching procedure. This work highlights the application of the cavity electrode for making chemical measurements at both brain slices and single cells and shows how a cavity can provide beneficial information that is lost with traditional disk electrodes.
The first display of intracellular measurements with chromaffin cells using FSCV is described in Chapter 4. This work details the fabrication steps taken in constructing a novel nanocone electrode that was capable of penetrating the cell wall in order to make
electrochemical measurements. The entire electrode was insulated except for a reproducible length of exposed carbon at the tip, which ensured that sampling was done only in the
intracellular space and that the extracellular environment was excluded. Norepinephrine and epinephrine content in vesicles were successfully distinguished intracellularly using FSCV.
One of the challenges that arises when collecting voltammetric data in vivo is interpreting the data when separate components are detected simultaneously. Chapter 5 explains an approach taken to remove the current generated from pH, which overlaps and interferes with the detection of hydrogen peroxide. By using a double waveform,
1.8 References
1. (1998) Life and Discoveries of Santiago Ramón y Cajal, http://www.nobelprize.org/nobel_prizes/medicine/laureates/1906/cajal-article.html. 2. Grote, H., and Hannan, A. (2007) Regulators of adult neurogenesis in the healthy and
diseased brain, Clinical and Experimental Pharmacology and Physiology 34, 533-545.
3. Tayebati, S. (2006) Animal models of cognitive dysfunction, Mechanisms of Ageing and Development 127, 100-108.
4. Kazantsev, A. (2007) Cellular pathways leading to neuronal dysfunction and degeneration, Drug News & Perspectives 20, 501-509.
5. Ghosh, J. (2006) Human development report 2005: International cooperation at a crossroads: Aid, trade and security in an unequal world., Development and Change 37, 1417-1423.
6. Pritchard, C., Mayers, A., and Baldwin, D. (2013) Changing patterns of neurological mortality in the 10 major developed countries - 1979-2010, Public Health 127, 357-368.
7. Kadakkuzha, B., and Puthanveettil, S. (2013) Genomics and proteomics in solving brain complexity, Molecular Biosystems 9, 1807-1821.
8. Mouton, P., Price, D., and Walker, L. (1997) Empirical assessment of synapse numbers in primate neocortex, Journal of Neuroscience Methods 75, 119-126.
9. Kandel, E. R., Schwartz, J. H., and Jessell, T. M. (2000) Principles of neural science, 4th ed., McGraw-Hill, Health Professions Division, New York.
10. John, C. E., and Jones, S. R. (2007) Fast Scan Cyclic Voltammetry of Dopamine and Serotonin in Mouse Brain Slices, CRC Press/Taylor & Francis, Boca Raton, FL. 11. Chen, G., and Ewing, A. G. (1997) Chemical analysis of single cells and exocytosis,
Critical reviews in neurobiology 11, 59-90.
13. Kim, D., Koseoglu, S., Manning, B. M., Meyer, A. F., and Haynes, C. L. (2011) Electroanalytical eavesdropping on single cell communication, Anal Chem 83, 7242-7249.
14. Roberts, J. G., Lugo-Morales, L. Z., Loziuk, P. L., and Sombers, L. A. (2013) Real-time chemical measurements of dopamine release in the brain, Methods Mol Biol 964, 275-294.
15. Hodgkin, A. L., and Huxley, A. F. (1939) Action potentials recorded from inside a nerve fibre, Nature 144, 710-711.
16. Perry, M., Li, Q., and Kennedy, R. (2009) Review of recent advances in analytical techniques for the determination of neurotransmitters, Analytica Chimica Acta 653, 1-22.
17. Watson, C., Venton, B., and Kennedy, R. (2006) In vivo measurements of neurotransmitters by microdialysis sampling, Analytical Chemistry 78, 1391-1399. 18. Schltz, K., and Kennedy, R. (2008) Time-Resolved Microdialysis for In Vivo
Neurochemical Measurements and Other Applications, Annual Review of Analytical Chemistry 1, 627-661.
19. Clapp-Lilly, K., Roberts, R., Duffy, L., Irons, K., Hu, Y., and Drew, K. (1999) An ultrastructural analysis of tissue surrounding a microdialysis probe, Journal of Neuroscience Methods 90, 129-142.
20. Benadiba, M., Luurtsema, G., Wichert-Ana, L., Buchpigel, C., and Busatto, G. (2012) New molecular targets for PET and SPECT imaging in neurodegenerative diseases, Revista Brasileira De Psiquiatria 34, S125-S148.
21. ADAMS, R. (1976) PROBING BRAIN CHEMISTRY WITH
ELECTROANALYTICAL TECHNIQUES, Analytical Chemistry 48, 1126-&. 22. KISSINGE.PT, HART, J., and ADAMS, R. (1973) VOLTAMMETRY IN
BRAIN-TISSUE - NEW NEUROPHYSIOLOGICAL MEASUREMENT, Brain Research 55, 209-213.
24. Llaudet, E., Botting, N., Crayston, J., and Dale, N. (2003) A three-enzyme microelectrode sensor for detecting purine release from central nervous system, Biosensors & Bioelectronics 18, 43-52.
25. Cevik, S., Timur, S., and Anik, U. (2012) Biocentri-voltammetric biosensor for acetylcholine and choline, Microchimica Acta 179, 299-305.
26. Bard, A. J. F., L. R. (2001) Electrochemical methods : fundamentals and applications, 2nd ed., John Wiley, New York.
27. Michael, D., Travis, E. R., and Wightman, R. M. (1998) Color images for fast-scan CV, Analytical Chemistry 70, 586a-592a.
28. Robinson, D., Hermans, A., Seipel, A., and Wightman, R. (2008) Monitoring rapid chemical communication in the brain, Chemical Reviews 108, 2554-2584.
29. Peters, J., Miner, L., Michael, A., and Sesack, S. (2004) Ultrastructure at carbon fiber microelectrode implantation sites after acute voltammetric measurements in the striatum of anesthetized rats, Journal of Neuroscience Methods 137, 9-23.
30. Roberts, J. G., Hamilton, K. L., and Sombers, L. A. (2011) Comparison of electrode materials for the detection of rapid hydrogen peroxide fluctuations using background-subtracted fast scan cyclic voltammetry, Analyst 136, 3550-3556.
31. McCreery, R. (2008) Advanced carbon electrode materials for molecular electrochemistry, Chemical Reviews 108, 2646-2687.
32. Takmakov, P., Zachek, M., Keithley, R., Walsh, P., Donley, C., McCarty, G., and Wightman, R. (2010) Carbon Microelectrodes with a Renewable Surface, Analytical Chemistry 82, 2020-2028.
33. Robinson, R., Sternitzke, K., Mcdermott, M., and Mccreery, R. (1991) Morphology And Electrochemical Effects Of Defects On Highly Oriented Pyrolytic-Graphite, Journal of the Electrochemical Society 138, 2412-2418.
34. Bowling, R., Packard, R., and Mccreery, R. (1989) Activation Of Highly Ordered Pyrolytic-Graphite For Heterogeneous Electron-Transfer - Relationship Between Electrochemical Performance And Carbon Microstructure, Journal of the American Chemical Society 111, 1217-1223.
36. Banks, C., and Compton, R. (2005) Edge plane pyrolytic graphite electrodes in electroanalysis: An overview, Analytical Sciences 21, 1263-1268.
37. Boehm, H. P. (1994) Some Aspects of the Surface-Chemistry of Carbon-Blacks and Other Carbons, Carbon 32, 759-769.
38. Heien, M., Phillips, P., Stuber, G., Seipel, A., and Wightman, R. (2003) Overoxidation of carbon-fiber microelectrodes enhances dopamine adsorption and increases sensitivity, Analyst 128, 1413-1419.
39. Roberts, J., Moody, B., McCarty, G., and Sombers, L. (2010) Specific Oxygen-Containing Functional Groups on the Carbon Surface Underlie an Enhanced Sensitivity to Dopamine at Electrochemically Pretreated Carbon Fiber Microelectrodes, Langmuir 26, 9116-9122.
40. Hu, I. F., Karweik, D. H., and Kuwana, T. (1985) Activation and Deactivation of Glassy-Carbon Electrodes, Journal of Electroanalytical Chemistry 188, 59-72.
41. Pimenta, M. A., Dresselhaus, G., Dresselhaus, M. S., Cancado, L. G., Jorio, A., and Saito, R. (2007) Studying disorder in graphite-based systems by Raman spectroscopy, Physical Chemistry Chemical Physics 9, 1276-1291.
42. Wang, Y., Alsmeyer, D. C., and McCreery, R. L. (1990) Raman-Spectroscopy Of Carbon Materials - Structural Basis Of Observed Spectra, Chemistry of Materials 2, 557-563.
43. Kozlowski, C., and Sherwood, P. M. A. (1985) X-Ray Photoelectron-Spectroscopic Studies of Carbon-Fibre Surfaces .5. The Effect of Ph on Surface Oxidation, J Chem Soc Farad T 1 81, 2745-2756.
44. Pellenbarg, T., Dementev, N., Jean-Gilles, R., Bessel, C., Borguet, E., Dollahon, N., and Giuliano, R. (2010) Detecting and quantifying oxygen functional groups on graphite nanofibers by fluorescence labeling of surface species, Carbon 48, 4256-4267.
45. Wildgoose, G. G., Abiman, P., and Compton, R. G. (2009) Characterising chemical functionality on carbon surfaces, J Mater Chem 19, 4875-4886.
47. Alsmeyer, D. C., and Mccreery, R. L. (1992) Insitu Raman Monitoring of Electrochemical Graphite-Intercalation and Lattice Damage in Mild Aqueous Acids, Analytical Chemistry 64, 1528-1533.
48. Proctor, A., and Sherwood, P. M. A. (1983) X-Ray Photoelectron Spectroscopic Studies of Carbon-Fiber Surfaces .2. The Effect of Electrochemical Treatment, Carbon 21, 53-59.
49. Kozlowski, C., and Sherwood, P. M. A. (1984) X-Ray Photoelectron Spectroscopic Studies of Carbon-Fiber Surfaces .4. The Effect of Electrochemical Treatment in Nitric-Acid, J Chem Soc Farad T 1 80, 2099-&.
50. Tuinstra, F., and Koenig, J. (1970) Raman Spectrum Of Graphite, Journal of Chemical Physics 53, 1126-&.
51. Mildred S. Dresselhaus, A. J., Mario Hofmann, Gene Dresselhaus, Riichiro Saito. (2010) Perspectives on Carbon Nanotubes and Graphene Raman Spectroscopy, Nano Letters 10, 751-758.
52. Matthews, M., Pimenta, M., Dresselhaus, G., Dresselhaus, M., and Endo, M. (1999) Origin of dispersive effects of the Raman D band in carbon materials, Physical Review B 59, R6585-R6588.
53. Turner, N. H., and Schreifels, J. A. (2000) Surface analysis: X-ray photoelectron spectroscopy and auger electron spectroscopy, Analytical Chemistry 72, 99r-110r. 54. Blyth, R. I. R., Buqa, H., Netzer, F. P., Ramsey, M. G., Besenhard, J. O., Golob, P.,
and Winter, M. (2000) XPS studies of graphite electrode materials for lithium ion batteries, Appl Surf Sci 167, 99-106.
55. Fryling, M. A., Zhao, J., and Mccreery, R. L. (1995) Resonance Raman Observation of Surface Carbonyl Groups on Carbon Electrodes Following Dinitrophenylhydrazine Derivatization, Analytical Chemistry 67, 967-975.
56. Collier, W. G., and Tougas, T. P. (1987) Determination of Surface Hydroxyl-Groups on Glassy-Carbon with X-Ray Photoelectron-Spectroscopy Preceded by Chemical Derivatization, Analytical Chemistry 59, 396-399.
58. Singh, Y. S., Sawarynski, L. E., Dabiri, P. D., Choi, W. R., and Andrews, A. M. (2011) Head-to-Head Comparisons of Carbon Fiber Microelectrode Coatings for Sensitive and Selective Neurotransmitter Detection by Voltammetry, Analytical Chemistry 83, 6658-6666.
59. Gerhardt, G. A., Oke, A. F., Nagy, G., Moghaddam, B., and Adams, R. N. (1984) Nafion-coated electrodes with high selectivity for CNS electrochemistry, Brain Res 290, 390-395.
60. Qi, L. J., Thomas, E., White, S. H., Smith, S. K., Lee, C. A., Wilson, L. R., and Sombers, L. A. (2016) Unmasking the Effects of L-DOPA on Rapid Dopamine Signaling with an Improved Approach for Nafion Coating Carbon-Fiber Microelectrodes, Analytical Chemistry 88, 8129-8136.
61. Brazell, M. P., Kasser, R. J., Renner, K. J., Feng, J., Moghaddam, B., and Adams, R. N. (1987) Electrocoating Carbon-Fiber Microelectrodes with Nafion Improves Selectivity for Electroactive Neurotransmitters, Journal of Neuroscience Methods 22, 167-172.
62. Lugo-Morales, L. Z., Loziuk, P. L., Corder, A. K., Toups, J. V., Roberts, J. G., McCaffrey, K. A., and Sombers, L. A. (2013) Enzyme-modified carbon-fiber microelectrode for the quantification of dynamic fluctuations of nonelectroactive analytes using fast-scan cyclic voltammetry, Anal Chem 85, 8780-8786.
63. Swamy, B. E. K., and Venton, B. J. (2007) Carbon nanotube-modified microelectrodes for simultaneous detection of dopamine and serotonin in vivo, Analyst 132, 876-884.
64. Xiao, N., and Venton, B. J. (2012) Rapid, Sensitive Detection of Neurotransmitters at Microelectrodes Modified with Self-assembled SWCNT Forests, Analytical Chemistry 84, 7816-7822.
65. Ross, A. E., and Venton, B. J. (2012) Nafion-CNT coated carbon-fiber microelectrodes for enhanced detection of adenosine, Analyst 137, 3045-3051.
CHAPTER 2
Spectroelectrochemical Characterization of the Carbon Fiber Surface in Response to Electrochemical Conditioning
This work was completed in collaboration with: Dunaway, L.E., McCarty, G.S., and Sombers, L.A.
2.1 Introduction
Fast scan cyclic voltammetry (FSCV) continues to grow in popularity for neuroscience research because it offers considerable advantages over other electrochemical techniques. FSCV through the current voltage response enables analytes identification unlike competing electrochemical techniques, such as amperometry or chronoamperometry. The approach also provides excellent sensitivity 1, 2 and data can be collected with millisecond temporal resolution due to the fast scan rates employed. For these reasons, FSCV is well suited for measuring neurochemical release events that happen on the millisecond time scale in the complex chemical environment of the brain.3-6 Despite these benefits, the technique is only valuable if it is coupled to an equally powerful sensing platform, such as carbon-fiber microelectrodes.
inexpensive and easily fabricated, offer a wide potential window, and resist biofouling.7-10 These properties have made CFMs the preferred sensor for bioanalytical studies over metal electrodes. They have even been shown to have a renewable surface when a sufficiently positive potential is applied.11, 12 These electrodes are effective at detecting a large variety of common neurotransmitters.3, 13-15 The carbon fiber surface has also proven amenable to various coatings such as Nafion, a well characterized cation exchange polymer, or chitosan with entrapped glucose oxidase to enable detection of non-electroactive glucose.16-18
Most carbon fibers are derived either from polyacrylonitrile or a mesophase pitch based source subjected to a series of heating processes that result in graphitization of the carbon.19, 20 The choice of precursor material and differences in the graphitization process give rise to structural variations that result in intrinsic differences in electrical conductivity, thermal conductivity, strength, and other properties across fiber types. 19, 20 These properties
chemistry affect electrode performance, this work characterizes the surface using Raman spectroscopy during application of static and dynamic waveforms, and correlates measured changes with both electrochemical performance and physical changes evident in scanning electron micrographs. A range of positive potential limits (+1.0 - +1.4 V) are investigated, as are conditioning schemes that use a single potential, in order to generate insight to the effects of these treatments on the electrode surface. The results can be utilized to inform the development of new waveforms to overcome limitations when electrochemically targeting complex molecules, or those that are present in low concentrations.
2.2 Experimental Section 2.2.1 Chemicals
All chemicals were purchased from Sigma Aldrich Co. (St. Louis, MO) and were used without additional processing. Aqueous solutions were made using doubly deionized water (Barnstead Easy Pure II, Dubuque, IA). Unless otherwise noted, all electrochemical experiments were carried out in Tris buffered electrolyte (15 mM Tris, 3.25 mM KCl, 1.20 mM CaCl2, 1.2 mM MgCl2, 2 mM Na2SO4, 1.25 mM NaH2PO4, and 145 mM NaCl ) with a pH of 7.4.
2.2.2 Electrode Fabrication
used (Narishige, Tokyo, Japan) to form a tapered seal. The carbon fiber was then cut at the glass seal and dipped in epoxy and dried in an oven. The electrode was subsequently polished at 30o before use. An electrolyte solution (4 M potassium acetate, 150 mM KCl) was used to backfill the electrode and a lead was inserted to establish an electrical connection with the fiber.
2.2.3 Flow Injection
Electrochemical data were collected using a flow injection apparatus that was housed within a custom built Faraday cage to reduce interference from outside noise. The working electrode was positioned in the electrochemical cell using a micromanipulator (World Precision Instruments, Inc., Sarasota, FL). Buffered electrolyte was passed continuously over the working and reference electrode at 1 mL/min using a syringe pump (New Era Pump Systems, Inc., Wantagh, NY). A digital valve interface (Valco Instruments Co., Inc., Houston, TX) was used to control an air actuator connected to a six-port HPLC valve in order to make two second bolus injections of analyte across the working electrode. Electrode sensitivity was determined from calibrations of dopamine using three concentrations.
2.2.4 Electrochemical Data Acquisition
accomplished using custom instrumentation (University of North Carolina at Chapel Hill, Department of Chemistry, Electronics Facility). Waveforms were output using a DAC/ADC card (NI 6251 M) with TH-1 software (ESA, Chelmsford, MA). Static potentials were applied to the electrodes using a waveform generator (Agilent 33220A). The flow injection system was coordinated with the electrochemical experiment using a second card (NI 6711). Background subtraction and signal averaging was software controlled. Electrode areas were compared by measuring the limiting current generated from the reduction of hexaamineruthenium(III) chloride with scan rates of 100 mV/s (WaveNano, Pine Instruments Company, Durham, NC). Analysis was done with Aftermath software (Version 1.4.7714, Pine Instruments Company). Solutions were prepared as previously shown and were deoxygenated with argon prior to use.33 Electrodes were conditioned with dynamic waveforms in phosphate-buffered saline (0.1 M PBS) at pH 7.4 prior to limiting current analysis.
2.2.5 Surface Analysis
Raman spectra were collected for 30 seconds with a 60x objective using a custom spectrometer that has been described previously.34 All spectra were collected while the
2.2.6 Data Analysis
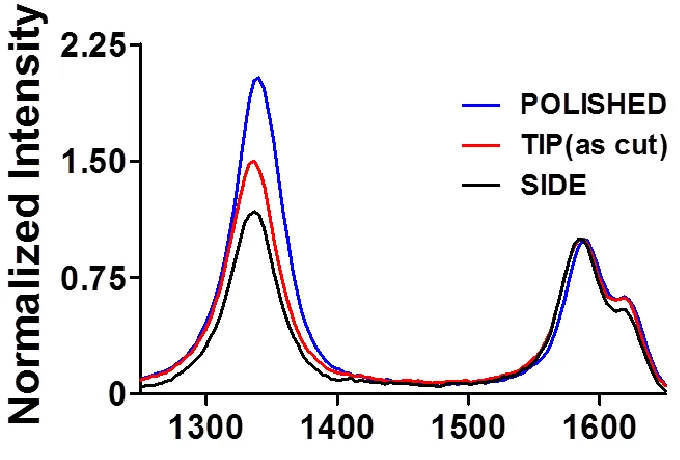
Data in figures is shown as the mean + standard error of the mean. Data in tables is presented as mean + standard deviation. Graphical and statistical analysis was performed with Graph Pad Prism 5 (GraphPad Software, Inc., La Jolla, CA). Electrode response time was calculated as the time it took to rise from 10% to 90% of the maximum peak current for an injection. All analysis of Raman spectra was done using Matlab (The Mathworks, Inc., Natick, MA). Background intensity was subtracted and spectra were lowered to the baseline using a spline fitting procedure. Intensity values used to calculate the ID/IG and ID’/IG were taken from peak fitting parameters of the three peaks shown. The D peak (~1330 cm-1), G peak (~1580 cm-1), and D’ peak (~1620 cm-1) were fit using a Lorentzian, Breit-Wigner-Fano, and Gaussian peak shape respectively.35, 36
2.3 Results and Discussion
2.3.1 Microstructural Characterization with Raman Spectroscopy
Figure 2.1 Experimental design. Raman spectra were collected for carbon fibers during electrochemical conditioning.
peak. The peaks at approximately 1330 cm-1 and 1610 cm-1 have been related to a breaking of the symmetry in the graphitic lattice. For this reason they are referred to as ‘disorder related’ and are labeled D and D’, respectively. The ratio of D and G peaks (ID/IG) is commonly used as a measure of graphitic disorder in the system. In a graphitic sample that has long range crystalline order, the D and D’ peaks will be low or undetected. As the highly organized graphitic structure is disrupted, the disorder related peaks grow in intensity and ID/IG increases. This continues until a high level of amorphous carbon is present, at which point ID/IG decreases.40-42 These trends make ID/IG a convenient and sensitive measurement to use for monitoring relative changes in the carbon structure. Therefore, the ratios of the disorder to graphitic peaks are used in this paper to compare structural changes that occur at the surface in response to the application of different potentials.
Figure 2.2 Polishing increases disorder on carbon surface. Representative spectra collected at the side, tip (as cut), and polished carbon fiber surfaces.
Previous studies have demonstrated a linear relationship between ID/IG and the crystallite dimension along the a-axis (La), such that as La decreases there is an increase in ID/IG. 38-41, 44 The equation that relates ID/IG to La is written as:
𝐿𝑎(𝑛𝑚) = (2.4 𝑥 10−10)𝜆 𝑙𝑎𝑠𝑒𝑟 4 (𝐼𝐷
𝐼𝐺)
−1
, (1)
where λlaser is the wavelength of the laser in nm.38 Using this equation, La was estimated for
surface induces crystallite defects (disorder) to the carbon structure, consistent with previous work. 45
Table 2.1 Microcrystallite Dimensions for the Different States of the P-55 Carbon Fiber Surface Type La (nm)
Side 31.5 + 1.8
2.3.2 Dynamic and Static Waveform Potentials Alter The Carbon Surface
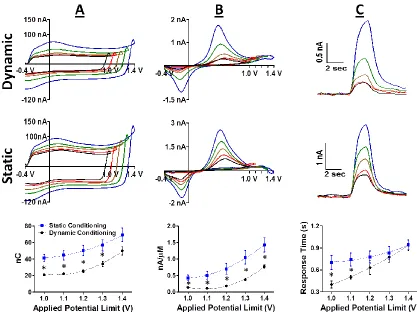
To mimic preconditioning methods commonly used in voltammetric experiments, dynamic waveforms with holding potentials of -0.4 V and switching potentials ranging from +1.0 to +1.4 V were applied for 20 minutes at a frequency of 60 Hz to freshly polished electrodes immersed in Tris buffer. In order to isolate the effect of the positive switching potential, another set of electrodes was subjected to static waveforms ranging from +1.0 to +1.4 V for 10 minutes. Representative spectra are presented in Figure 2.3A. Each demonstrates the three bands characteristic of graphitic materials (vide supra); however, the intensity of the D and D’ bands decreases as the magnitude of the applied potential (dynamic or static) is increased. Figure 2.3B plots the magnitude of ID/IG and ID’/IG versus the highest potential applied to the electrode. Both ratios decrease as the potential is increased when either dynamic waveforms (data plotted vs. switching potential) or static potentials are applied to the electrode. Despite similar trends, there is a significant difference in ID/IG between static and dynamic waveforms for potentials of +1.1 to +1.3 V (p<0.05, n=4 dynamic, n=4 static). This difference decreases as potentials increase, demonstrating a growing similarity in the surface characteristics of the carbon.
2.3.3 Dynamic and Static Pretreatments Differentially Affect Electrochemical Performance
Experiments were done to see how the structural changes described above correlate with electrochemical performance. Electrodes were conditioned with either a dynamic (60 Hz for 20 minutes) or static waveform (1 minute), and then a triangular waveform with a positive potential limit equal to the limit used for conditioning was used for data collection. The collection waveforms ranged from -0.4 to +1.0 up to +1.4 V with a scan rate of 400 V/sec. It has been shown previously that the magnitude of the background current is predictive of electrode sensitivity.47 As expected, the background currents increased as the
switching potential was raised for both dynamically and statically conditioned electrodes (Figure 2.5A). The background current is a combination of capacitive current and current generated from redox processes, most likely quinone like oxygen groups, at the carbon surface.48 The area under the quinone related peak was integrated to estimate the population of oxygen on the surface of the electrode. The data suggest that the electrodes that were conditioned statically were significantly more oxidized (p<0.05, one-tailed t test, n=6 dynamic, n=8 static) than those that were dynamically preconditioned, except for the +1.4 switching potential. Oxygen populations for dynamically preconditioned electrodes remained relatively low until potentials of +1.3 and +1.4 V were reached.
that response time slows as oxidation of the surface is increased.28, 49 Figure 2.5C plots response time against the positive potential limit. The response times are slowed as the positive limit is increased for both sets of conditioned electrodes. Interestingly, the response time for static preconditioning is slow even when the lower potentials of +1.0 and +1.1 V are used. This again highlights the structural modifications and oxidation that occur at the carbon surface, even at these lower potentials.
It is plausible that the increased sensitivity to dopamine that develops as the positive potential limit is increased might be the result of an increase in electrode surface area, due to surface roughening or a similar phenomenon. To test this hypothesis, voltammograms for hexaamineruthenium(III) chloride were collected on electrodes that were freshly polished, and then again on the same electrodes after dynamic conditioning for 20 minutes at 60 Hz. The equation for limiting current is:
𝑖𝑙𝑖𝑚= 𝑛𝐹𝐴𝑚𝑜𝐶 (2)
and chemical changes at the surface of the carbon electrode, rather than from gross increases in electrode surface area.
Figure 2.6 Electrochemical conditioning does not increase electrode surface area. Limiting current from reduction of hexamineruthenium(III) chloride was collected at electrodes after polishing (grey) and after conditioning the polished electrodes with +1.0 and +1.4 V dynamic waveforms (black). No significant difference was detected (p>0.05, paired t-test, n=3 for both conditioning methods).
indicates that the surface becomes better suited for dopamine oxidation and reduction as the positive potential limit is extended. The detection of ascorbic acid was also characterized on the same set of electrodes (Figure 2.7). When using dynamically preconditioned electrodes, the oxidation wave for ascorbic acid does not become well defined until limits of +1.4 V are applied. However, statically conditioned electrodes show a clear oxidation peak for ascorbic acid even when the positive potential limit only extended to +1.0 V. This interesting result indicates that lower potentials (+1.0 V) are sufficient to prepare the surface for oxidation of ascorbic acid when statically applied.
Table 2.2 Peak-to-Peak Separation for the Detection of 2 µM Dopamine
* p<0.05, one-way Anova, n=6 (dynamic), n=9 (static), Tukey post hoc, values compared to +1.0 V
Conditioning Method
1.0 V 1.1 V 1.2 V 1.3 V 1.4 V
Figure 2.7 Conditioning alters electrochemical response for ascorbic acid. Averaged background subtracted voltammograms collected for 200 µM ascorbic acid using electrodes conditioned with A) dynamic and B) static potentials. Holding potential was -0.4 V and switching potentials vary from +1.0 V (black), +1.1 V (red), +1.2 V (gold), +1.3V (green), to +1.4 V (blue).
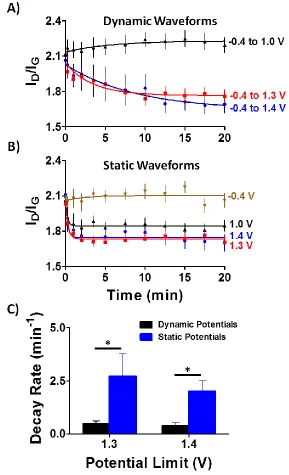
2.3.4 Rate of Change Comparison
As expected, microstructural changes at dynamically conditioned electrodes (Figure 2.8A) occur more slowly than those at statically conditioned electrodes (Figure 2.8B). Indeed, the rate of decay, as determined from the fit of the data, demonstrates that static conditioning using +1.3 V (*p<0.05, two-tailed t-test, n=5 static, n=9 dynamic) and +1.4 V (*p<0.05, two-tailed t-test, n=7 static, n=7 dynamic) changes the surface significantly faster than dynamic conditioning with these potential limits (Figure 2.8C). It is worth noting that dynamic conditioning at +1.0 V and static conditioning at -0.4 V lead to no noticeable changes in the carbon microstructure whereas static conditioning with +1.0 V generates structural changes similar to those observed in response to higher applied potentials.
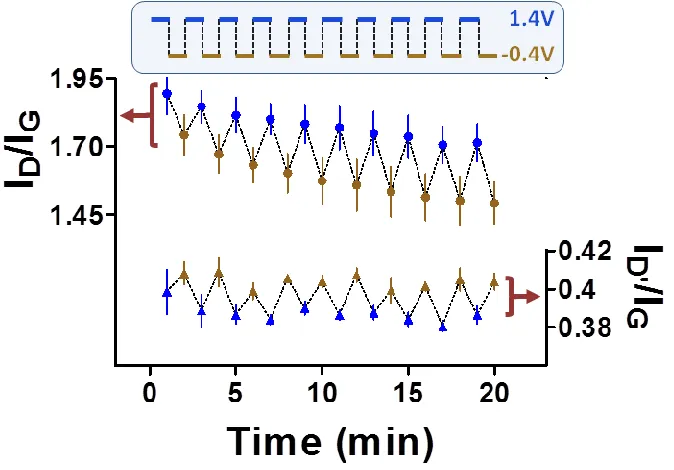
2.3.5 Surface Response to Alternating Static Potentials
Figure 2.9 Carbon surface changes are dynamic. Plots of ID/IG (left y-axis) and ID’/IG (right
y-axis) as a function of time as static potentials of +1.4 and -0.4 V were alternately applied to the electrode (top).
2.4 Conclusions
The electrochemical performance of carbon fiber microelectrodes is highly dependent on the surface characteristics of the fiber. Using Raman spectroscopy we have shown that the carbon surface dynamically responds to applied potentials, and that positive potentials are more effective than negative potentials at eliciting a microstructural response (Figure 2.3, 2.9). In addition, static potentials are more effective than dynamic waveforms at eliciting microstructural changes to the carbon surface (Figure 2.3), changes which result in enhanced electrochemical performance (Figures 2.5, 2.7) even for lower statically applied potentials. For example, conditioning with a static potential of +1.0 V is sufficient to enable the voltammetric detection of ascorbic acid; however, conditioning with a dynamic waveform with a positive potential limit of 1.0 V is not. Likewise, conditioning with a static +1.0 V leads to a surface structure resembling that attained after conditioning with dynamic waveforms with a larger positive potential limit (Figures 2.3, 2.8).
2.5 References
1. Bucher, E. S., and Wightman, R. M. (2015) Electrochemical Analysis of Neurotransmitters, Annual Review of Analytical Chemistry 8, 239-261.
2. Kile, B. M., Walsh, P. L., McElligott, Z. A., Bucher, E. S., Guillot, T. S., Salahpour, A., Caron, M. G., and Wightman, R. M. (2012) Optimizing the Temporal Resolution of Fast-Scan Cyclic Voltammetry, Acs Chemical Neuroscience 3, 285-292.
3. Robinson, D., Hermans, A., Seipel, A., and Wightman, R. (2008) Monitoring rapid chemical communication in the brain, Chemical Reviews 108, 2554-2584.
4. Robinson, D. L., and Wightman, R. M. (2007) Rapid Dopamine Release in Freely Moving Rats, Front Neuroeng 1, 17-34.
5. Garris, P. A., and Wightman, R. M. (1995) Regional Differnces in Dopamine Relesase, Uptake, and Diffusion Measured by Fast-Scan Cyclic Voltammetry, The Human Press Inc, Totowa, New Jersey.
6. Robinson, D. L., Venton, B. J., Heien, M. L. A. V., and Wightman, R. M. (2003) Detecting subsecond dopamine release with fast-scan cyclic voltammetry in vivo, Clin Chem 49, 1763-1773.
7. Armstrong-James, M., and Millar, J. (1979) Carbon fibre microelectrodes, J Neurosci Methods 1, 279-287.
8. Huffman, M. L., and Venton, B. J. (2009) Carbon-fiber microelectrodes for in vivo applications, Analyst 134, 18-24.
9. Wightman, R. (2006) Probing Cellular Chemistry in Biological Systems with Microelectrodes, Science 311, 1570-1574.
10. Kawagoe, K. T., Zimmerman, J. B., and Wightman, R. M. (1993) Principles of Voltammetry and Microelectrode Surface-States, Journal of Neuroscience Methods 48, 225-240.
11. Takmakov, P., Zachek, M., Keithley, R., Walsh, P., Donley, C., McCarty, G., and Wightman, R. (2010) Carbon Microelectrodes with a Renewable Surface, Analytical Chemistry 82, 2020-2028.