Data Driven Crowd Management System
using an Android Application
Leeza Sharma1, Divya Bansal2
M.Tech Scholar, Dept. of CSE, PEC, Chandigarh, India1
Associate Professor, Dept. of CSE, PEC, Chandigarh, India 2
ABSTRACT: Crowd management is crucial to improve incident response for enhancing Public Safety and National
Security. It is important to manage crowd before, during and after the event. Crowd control is necessary to prevent outbreak of crowd. Crowd management is required not only during riots or disasters, It also need to manage crowd in useful and constructive large scale events for safety and enjoyment of everyone present there. So, there is a need of system which helps people to prevent themselves from any tragedy.
We deployed an application which allows people to avoid going to the location which is already more crowded than usual so that any mishappening can be avoided before it happens. Our Application collects GPS data using mobile phones with unique id of each user and then using clustering, it quantifies the actual number of users present at any particular location. It gives an alert when numbers of people are more than normal according to historical data of that location, so that concerned people and authorities can take actions accordingly
Validation is done using 3 metrics Recall, Precision and F1 Score which gives output values as 0.98, 0.95, 0.97 respectively and overall Accuracy of System is 94 % which are good enough that we can use this application to prevent people from any emergency situation.
KEYWORDS: GPS sensor, DBSCAN algorithm, crowd.
I. INTRODUCTION
Gathering of large masses of people at any place is nor-mal situation but when this number increases or decreases expeditiously and suddenly, then there may be some anomaly, whether the reason for that anomaly is natural disaster (e.g.: Floods, Earthquake etc) or man-made disaster (e.g.: Terrorist attacks, Protests etc) or any festival which means people gathered for good purpose.
Crowd Management also includes prevention of any stampede or rush anywhere by notifying people about the situation prior to their reach at the location so that they can avoid going there if possible and save themselves from any mishap-penning. Recently tragedy struck Elphinstone road railway station stairs in central Mumbai during the morning rush hour on 29 September 2017 resulted in death of 23 people and nearly 40 injured terribly[1]. Another case was there in which people protested in favour of Ram Rahim Singh but after his conviction, Situation like riots happened at various places, particularly at Punchkula and Sirsa where people gathered in very large masses resulted in death of nearly 30 people and large number of people were injured[2]. So, we need crowd management or crowd control method for the safety of people.
automatically sent to server for computations. Smart phones already have several sensors: camera, microphone, GPS, ac-accelerometer, light sensor, Bluetooth as proximity sensor. Thus, mobile people- centric sensing can be a scalable and cost-effective alternative.
Geospatial data can be used to localize the individuals. Geospatial data or GPS data is represented by numerical values for any object or individual in geographic coordinate system. Crowd control is necessary to prevent outbreak of crowd. There are some characteristics of Crowd including Physical Presence, Temporary Social group, Unorganized, Anonymity, Narrow Attention, Irresponsibility. So, Crowd management is required in all type of events by event organisers and also during time of riots or disasters to safeguard people from any misfortune.
In this work, we made an application to make people remain safe by giving them alert about the mishappening occurred near them. It also notifies the police and other related authorities about the event so that they can take rescue steps as early as possible. The main objectives of our findings are:
Use of both participatory and opportunistic based mobile sensing techniques for collecting data. To get the actual number of users present at any location Sending notification to multiple users at same time. To evaluate proof of concept using real time testing and validations in real time context.
So, we evaluate this system by collecting real time data at different locations in Chandigarh which gives good accuracy. In section 2, we outline the related work on crowd management. In section 3, we describe android application. Section 4 gives details of methodology of whole work. In section 5, we outline results and with section 6, we conclude the work.
II. RELATEDWORK
Different methods of Automatic Crowd Monitoring and Management are proposed by many authors using mobile phones, cameras, RFID tags etc. Ulf Blanke, Gerhard Troster et al.[4] proposed data collection experiment for capturing crowd at the Zuri Fascht 2013.This app is only for three days and also for that particular place only as they geofence the location.Adiba Abidin et al. [5] presented system for identification of pilgrims using card based on RFID technology. Users have to carry cards with rfid tags all the time which is not convenient way to manage crowd at all places.Maciej Szczodrak et al .[6] implemented crowd management system using cameras. But cameras are not present everywhere. So, It’s not a global approach for crowd management.
Thomas Ludwig et al.[7] designed Crowd Monitor application which detects the physical and digital activities. It provides functionality for gathering on the ground movements, requesting data publically and access to social media information. It did not include mechanism for movement predictions based on provided location information.
Kasthuri Jayarajah et al. [8] introduced EiM framework which characterizing micro-events via social sensing of image-sharing social network, like Instagram. This system discards the untagged posts instead of estimating the geotags which are required for crowd management.Mulin Chen et al. [9] proposed Anchor based manifold ranking method to detect groups including topological relationship of individuals, no. of groups detected automatically but did not recognize events or crowd counting which are necessary for crowd management.
Chon et al.[10] proposed a method of crowd sensing which uses locations with Wi-Fi or GPS and also audio and video hints from opportunistic data. For evaluation of place categorization model, they have used two metrics accuracy and distribution of place category topics. Their results show that places are automatically characterized into seven different places. But the disadvantage of this paper is that the data collected in audio and images form has a lot of noise.
The Application which is proposed in this work will be used globally without any restriction for particular place or event. Also, it only uses smart phones GPS sensor which is easily accessible to all users.
III.METHODOLOGY
historical data for that location, then it will trigger notification. Notification will be sent to same application with which data is collected. This is explained in detail section wise as follows:
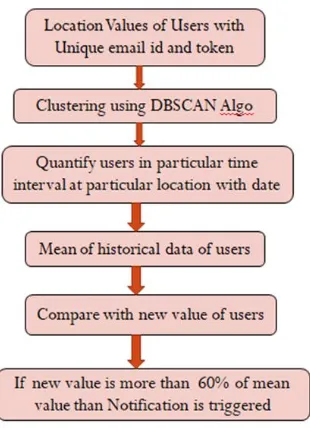
Fig. 1: Methodology
IV.EXPERIMENTALRESULTS
A. App Interface
We developed the android application for users to interact at the front end and data is collected using application at backend. Notification alert is also sent to this app when crowd is more than normal number so that preventive measures can be taken by people.
(a) Sign up (b) Login
User needs to sign up for application with unique email id and existing user can sign in shown in figure 2. we are collecting data of GPS Coordinates so user needs to turn on GPS Settings. Privacy Policy is also included in the application because location data of users are collected which is further used for crowd management. Once user register App, token is generated for particular device and stored in database, which is used to send notification.
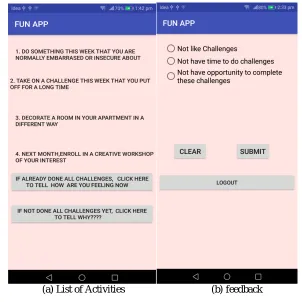
At the front end, User can do some interesting activities if he or she is getting bored. There is list of some activities as shown in figure 3(a). If person have completed all activities, then he can give ratings that how he is feeling now. If user cannot do activities, he can give feedback that why he was unable to perform activities as shown in figure3 (b) so that application can be updated according to user requirements.
(a) List of Activities (b) feedback
Fig. 3: App interface
B. Data Collection
The data was collected using Android Smartphone. Each user had one Smartphone placed anywhere. The Smartphone captures location values of users and thus, sends latitude and longitude values to server with logging interval of 10 seconds. User must be logged in and location must be on so that GPS sensor sends accurate value of location.
Device Android Phone
Sensor Used GPS
Logging Interval 10 sec
Location PEC Chandigarh, ISBT
sector-43, Sector-17
Number of users 65
Duration of Data collection 2 months
TABLE I: Summary of Data Collection
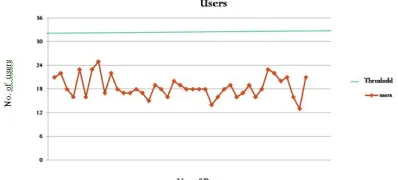
The graphs shown below presents data collection at three different locations of 65 Volunteers in total for almost 2 months with 15 minutes time interval at same location daily. Figure 4 shows the data at sector-43 Chandigarh on different days. Green line presents the threshold value and Red line is number of users. Threshold is set by taking 1.6 times the mean of previous values. Figure 5 shows the data at PEC, Chandigarh. In this green line indicates the threshold value which is around 40 as mean of previous values is 25 so, 1.6 times of mean is threshold. The day when number is 45, it will trigger notification.Similarly, Figure 6 shows the data at Sector 17, Chandigarh on different days.
Fig. 4: Users at sector-43 on different days Fig. 5: Users at PEC on different days
C. Clustering
Clusters are made using DBSCAN algorithm with collected data of locations. DBSCAN is Density Based Spatial Clustering of Applications with Noise. It uses the idea of density reachability and density connectivity. It can form arbitrarily sized and arbitrarily shaped clusters. Therefore, can be used for any type of location data. We have to set epsilon value 4 and number of minimum samples according to application of algorithm. We have used this algorithm because of two main reasons: It does not require specifying the number of clusters in the data priory and also robust to outliers.
The only thing is we have to set parameters accurately according to our requirement so that it can give good results. As we have taken minimum samples 20 in algorithm so if a person is present in any cluster for 2-3 minutes and then leaves, it should not contribute to crowd present at particular place for that time interval. So, we need to discard that person.
This work is done by DBSCAN algorithm automatically as in 2-3 minutes number of samples logged by application are 12-18 accordingly as logging interval of app is 10 sec. Thus, Algorithm itself discards this type of outliers and help in getting more accurate results.
This help in making clusters of people at particular location so that numbers of users are quantified further with unique email id to get the actual number of users present at location.
D. Anomaly Detection
This is explained using flow chart in figure 7. The unique users are quantified using email id for specific cluster or location for particular time interval and date. The data is collected on daily basis in different table in database which stores the location information, Date Time and number of people in each cluster or particular location.
Next step for crowd management is calculation of mean of all the values except the latest value present in database for all locations or clusters differently and then mean is compared with latest value in database. If new value is 1.6 times the mean of historical values, then it will send notification to users who have installed the application. Notification is generated by registering app in Firebase Cloud Messaging Console.
1.6 threshold value is sum of mean value and 60 % of mean which is set experimentally as this value give better results for more use cases(railway stations, ISBTs, Airports, shopping malls, Parks, roads, hospitals and educational institutes, festivals, marathons, protests, Rallies, concerts etc) with 94 % accuracy.
This helps the people to prevent them from any tragedy. Also authorities like Police, Fire brigade, Ambulance or any other rescue team at time of natural disaster or man-made disaster can help people if they get warning at right time. So, this application can help massive movements of public in emergency situations.
V. CONCLUSION
We presented an application which collects data and gives alert to users which help in improving incident response for enhancing public safety and national security. This application is not location specific or event specific. It can be used globally. Also, we have made front-end of Application in a way which is liked by users. They can enjoy using application and doing activities given in application. There is also a rating method and options to give reason why users did not perform activities so that we can update the application in future according to user requirements and make it more users friendly. Thus, Application can be used for entertainment and at the same time it helps users to prevent them from any mishappening.
Experiments help in validating the algorithm and shows that application is capable of detecting unusual increase in number of users with 94 % accuracy. In details, evaluation can be done using 3 metrics Recall, Precision and F1 Score which gives output values as 0.98, 0.95, and 0.97 respectively which are good enough that we can use this application to prevent people from any emergency situation.
Our Future work will focus on differentiating the similar type of events like protests, marathons, marching etc by using activity recognition with smart devices such as smart watches etc. This will help people to know that what type of event is actually going on and thus, they can take further decision to go to that place or not and avoid any tragedy.
REFERENCES
[1] https://www.ndtv.com/mumbai-news/rain-to-blame-for-mumbai-stampede-that-killed-23-says-railways-1761509
[2] https://www.ndtv.com/india-news/gurmeet-ram-rahims-100-car-convoy-heads-to-court-ahead-of-verdict-10-points-1741807 [3] https://www.statista.com/statistics/263441/global-smartphone-shipments-forecast/
[4] Blanke, Ulf, et al. ”Capturing crowd dynamics at large scale events using participatory gps-localization.” Intelligent Sensors, Sensor Networks and Information Processing (ISSNIP), 2014 IEEE Ninth International Conference on. IEEE, 2014.
[5] Abidin, et al. ”Advanced crowd management using ICT for just in time monitoring and real time alerts.” Cloud Computing, Data Science and Engineering-Confluence, 2017 7th International Conference on. IEEE, 2017
[6] Szczodrak, Maciej, et al.”Behaviour analysis and dynamic crowd management in video surveillance system.” Database and Expert Systems Applications (DEXA), 2011 nal Workshop on. Cloud Computing, Data Science and Engineering - Confluence, 2017
[7] Ludwig, Thomas, et al.”Crowd Monitor: Mobile crowd sensing for assessing physical and digital activities of citizens during emergencies.” Proceedings of the 33rd Annual ACM Conference on Human Factors in Computing Systems. ACM, 2015
[8] Jayarajah, Kasthuri, and Archan Misra. ”Can Instagram posts help characterize urban micro-events?.” Information Fusion (FUSION), 2016 19th International Conference on. IEEE, 2016
[9] Chen, Mulin, Qi Wang, and Xuelong Li.”Anchor-based group detection in crowd scenes.” Acoustics, Speech and Signal Processing (ICASSP), 2017 IEEE International Conference on. IEEE, 2017
[10]Chon, Y. et al. automatically characterizing places with opportunistic crowd sensing using smart phones, Proceedings of the 2012 ACM Conference on Ubiquitous Computing - UbiComp 12, p. 481. doi:10.1145/2370216.2370288.