REVIEW
A survey of methods and tools to detect
recent and strong positive selection
Pavlos Pavlidis
*and Nikolaos Alachiotis
Abstract
Positive selection occurs when an allele is favored by natural selection. The frequency of the favored allele increases in the population and due to genetic hitchhiking the neighboring linked variation diminishes, creating so-called selective sweeps. Detecting traces of positive selection in genomes is achieved by searching for signatures intro-duced by selective sweeps, such as regions of reintro-duced variation, a specific shift of the site frequency spectrum, and particular LD patterns in the region. A variety of methods and tools can be used for detecting sweeps, ranging from simple implementations that compute summary statistics such as Tajima’s D, to more advanced statistical approaches that use combinations of statistics, maximum likelihood, machine learning etc. In this survey, we present and discuss summary statistics and software tools, and classify them based on the selective sweep signature they detect, i.e., SFS-based vs. LD-based, as well as their capacity to analyze whole genomes or just subgenomic regions. Additionally, we summarize the results of comparisons among four open-source software releases (SweeD, SweepFinder, Sweep-Finder2, and OmegaPlus) regarding sensitivity, specificity, and execution times. In equilibrium neutral models or mild bottlenecks, both SFS- and LD-based methods are able to detect selective sweeps accurately. Methods and tools that rely on LD exhibit higher true positive rates than SFS-based ones under the model of a single sweep or recurrent hitchhiking. However, their false positive rate is elevated when a misspecified demographic model is used to repre-sent the null hypothesis. When the correct (or similar to the correct) demographic model is used instead, the false positive rates are considerably reduced. The accuracy of detecting the true target of selection is decreased in bottle-neck scenarios. In terms of execution time, LD-based methods are typically faster than SFS-based methods, due to the nature of required arithmetic.
Keywords: Positive selection, Selective sweep
© The Author(s) 2017. This article is distributed under the terms of the Creative Commons Attribution 4.0 International License (http://creativecommons.org/licenses/by/4.0/), which permits unrestricted use, distribution, and reproduction in any medium, provided you give appropriate credit to the original author(s) and the source, provide a link to the Creative Commons license, and indicate if changes were made. The Creative Commons Public Domain Dedication waiver (http://creativecommons.org/ publicdomain/zero/1.0/) applies to the data made available in this article, unless otherwise stated.
Background
Evolution by natural selection is based on a simple princi-ple: traits that increase the chance of survival and repro-duction have a higher tendency to be transmitted to the next generation. The beauty of evolution by natural selec-tion is in the simplicity with which adaptaselec-tion is achieved over time. The definition is universal since it does not dis-tinguish between the various forms of natural selection, such as positive selection, negative selection, balancing selection, and frequency-dependent selection, neither does it depend on the fitness landscape nor on the way that a population explores it. In addition, it does not
differentiate between single-locus and multi-loci traits, and it does not assume any independence between loci or any form of epistasis. The generality of the natural selec-tion concept, however, yields the detecselec-tion of traits that have contributed to the adaptation of organisms a rather challenging task. The definition itself is intuitive, clear, and well-understood. Yet, it does not provide any means on how to detect adaptive traits. Therefore, research has predominantly focused on the various forms of natural selection (e.g., positive, negative, balancing etc.) in order to understand and describe them, as well as to provide the means and tools to detect them.
Positive (or directional) selection is among the most extensively studied forms of selection, occurring when an allele is favored by natural selection. In that case, the fre-quency of the beneficial/favored allele increases over time,
Open Access
potentially becoming fixed in the population (substituting the non-beneficial one) when the effective population size (Ne) is large and back mutations occur infrequently. In a seminal study, Maynard Smith and Haigh [1] showed that when a beneficial allele substitutes a neutral allele, the fre-quencies of closely linked neutral alleles change as well. Those alleles that were originally linked to the benefical allele increase in frequency, whereas the remaining—non-linked—ones decrease in frequency. Maynard Smith and Haigh [1] coined the term ‘hitchhiking’ to describe this effect, because a neutral allele can get a lift by a closely linked beneficial allele. They also showed that heterozygo-sity at a linked locus is proportional to c/s, where c is the fraction of recombination rates between the neutral and the beneficial loci, while s is the selection coefficient of the beneficial allele. The fraction of recombination rate c delimits the effect of hitchhiking locally in the genome. At distant locations, recombination breaks the physical link-age to the beneficial allele and therefore distant regions evolve independently of the selective sweep. Interestingly, the motivation of Maynard Smith and Haigh to study the hitchhiking effect came from an observation by Lewontin [2], that the extent of enzyme polymorphisms is surpris-ingly constant between species of very different effective population sizes (see Box).
Effective population size
The concept of the Effective Population Size was firstly introduced by Sewall Wright in 1931 [3]. Wright introduced N (the symbol Ne is mostly employed today instead) to describe the size of a diploid breeding population, which is smaller than the total number of individuals of all ages. He shows that population size fluctuations brings the effective N
closer to the smaller actual population size. Also, the unequal numbers between males and females reduce the effective N. Finally, variations on the offspring numbers also reduce the effective population size. The effective population size is almost always smaller than the actual population size. A notable exception is the case of seedbanks, where the effective population size (hidden in forms of seeds) may be orders of magnitudes greater than the actual number of developed organ-isms [4, 5].
Assuming that the Ne is sufficiently large, Maynard Smith and Haigh [1] showed that the hitchhiking effect can have a considerable aggregate effect on the reduc-tion of the polymorphism levels within populareduc-tions. This result is roughly correct for finite population sizes as well [6, 7]. Therefore, the effect of Ne on the polymorphism level would be buffered by the hitchhiking effect, and dif-ferences on the heterozygosity between populations of very different effective population sizes will not be as sig-nificant as predicted by neutrality:
where u is the mutation rate, and H is the amount of heterozygosity. Using the wording from Maynard Smith (1) H =4Neu/(1+4Neu),
and Haigh: “If H lies between 0.1 and 0.5, then Ne lies between 0.028 and 0.25 u−1, and it is not plausible that the effective population sizes of all species lie within such narrow limits”.
Due to its simplicity, as well as the potential to generate testable hypotheses, the hitchhiking effect motivated the study of the various signatures that a beneficial allele leaves locally on the genome upon fixation. A first prediction is the reduction of the polymorphism level locally on the genome. Because of this property of the hitchhiking effect to sweep the neutral polymorphisms in the neighborhood of a beneficial mutation, the term ‘selective sweep’ has been coined. In fact, according to the hitchhiking model, genomic regions with low recombination rates (per base pair and per individual) exhibit less diversity. In Dros-ophila, studies have confirmed this prediction in regions of reduced recombination. In D. melanogaster, Aguade et al. [8] studied the yellow-achaete-scute complex located in a region of reduced crossing over, close to the telomere, and observed that the level of diversity is reduced in rela-tion to regions of normal crossing over, consistently with the hitchhiking effect hypothesis. In D. ananassae, Stephan and Langley [9] also reported reduced genetic variability in a region of reduced recombination rate. They studied the vermilion locus in the centromeric region, concluding that their results are consistent with the hitchhiking model. A second signature that hitchhiking leaves on the genome is a particular shift of the Site Frequency Spectrum (SFS) [10,
11]. Specifically, an increase of high- and low-frequency derived variants is expected in the proximity of the benefi-cial mutation. A third signature is associated with the level of Linkage Disequilibrium (LD). As shown by [12, 13], the LD levels remain high at each side of the beneficial muta-tion, and drop dramatically for loci across the beneficial mutation. These three signatures motivated the design of several tests to detect genomic regions subject to genetic hitchhiking.
Testing for the effect of genetic hitchhiking, typically referred to as selective sweep detection, is achieved by a variety of means, ranging from simple summary statistics to standalone software tools. These tests vary on the sig-natures they detect, such as SFS- vs. LD-based methods, and/or on the applicability of the implementations, such as genome-wide vs. subgenomic regions.
Crisci et al. [15] reviewed several widely-used approaches to detect recent and strong positive selection, such as SweepFinder [16], SweeD [17], OmegaPlus [18], and iHS [19]. The study mostly focuses on the type I and II error of the methods, the effect of population param-eters, such as population substructure and/or population size, and the length of the sequenced region. The authors performed simulations to demonstrate the efficiency of the different methods, finding that LD-based methods outperform other methods in both equilibrium and non-equilibrium evolutionary scenarios.
Vitti et al. [20], in an extended review, reported ideas and concepts that have been used to detect selection on a macroevolutionary or microevolutionary scale. They go beyond the classical model of selection (complete or ongoing selective sweeps) and discuss more complex models of natural selection, i.e., soft selective sweeps or selection on polygenic traits. Finally, they report a list of the most important genes found to be evolved under selection.
Pool et al. [21] review the challenges posed by new gen-eration sequencing data, particularly with respect to data quality and missing values. They assess the challenges of analyzing polymorphisms on the whole-genome scale, and the potential analyses that can provide insights into the inference of population genetics parameters using whole-genome data.
In this review, we survey methods and tools that can be used to detect recent and strong positive selection, or equivalently, so-called ‘hard’ selective sweeps. We pro-vide insights into performance issues of the methods, as well as their accuracy to detect the target of selection in natural populations. The remaining of this survey is organized as follows: in section "Sweep footprints and problems caused by demography", we describe the three different signatures of a selective sweep, and discuss the problems introduced in the detection process by neutral demographic events. In "Methods and tools" we present summary statistics and stand-alone software tools. We classify them based on the signature they detect and the applicability on whole genomes or subgenomic regions. Evaluation results regarding sensitivity, specificity, and execution times are presented in section "Evaluation". The subsequent section "Detection of soft sweeps" pre-sents methods for detecting soft selective sweeps, while the "Discussion" section focuses on interpretation, per-formance, and efficiency issues.
Sweep footprints and problems caused by demography
Detecting sweeps based on diversity reduction
The most striking effect of genetic hitchhiking is the reduction of the polymorphism (diversity) level. Maynard
Smith and Haigh [1] predicted the reduction of hete-rozygosity as a consequence of the hitchhiking effect in large (infinite) populations, immediately after the fixa-tion of the beneficial mutafixa-tion. After the complefixa-tion of the hitchhiking effect, when the beneficial mutation has been fixed, neutral variation will start to accumulate again on the genomic region and heterozygosity will increase. A prediction of the hitchhiking effect is that in genomic regions with reduced recombination rate per physical distance, the amount of diversity decreases if the hitchhiking effect is recent. Subsequent studies [7–9,
22–25] confirmed this prediction for D. melanogaster, D. simulans, and D. ananassae species. A similar pre-diction, however, holds for background selection [26] as well. More specifically, if neutral variants are linked to a strongly deleterious mutation, the level of polymorphism also deteriorates, since the deleterious mutation is gradu-ally removed from the population. The amount of poly-morphism reduction depends on the selection coefficient of the deleterious mutation [27]. For example, there is no effect when the linked deleterious mutation is lethal, since it is being directly removed from the population. Even though both evolutionary forces predict the reduc-tion of the diversity level, it has been demonstrated [28] that, in a hitchhiking model, the estimated level of diver-sity, θˆ, is negatively correlated with θ /ρˆ , where ρ is the recombination rate, whereas in a background selection model, the estimated level of diversity is positively cor-related with the same quantity (see also [29] for a review).
Detecting sweeps based on the SFS
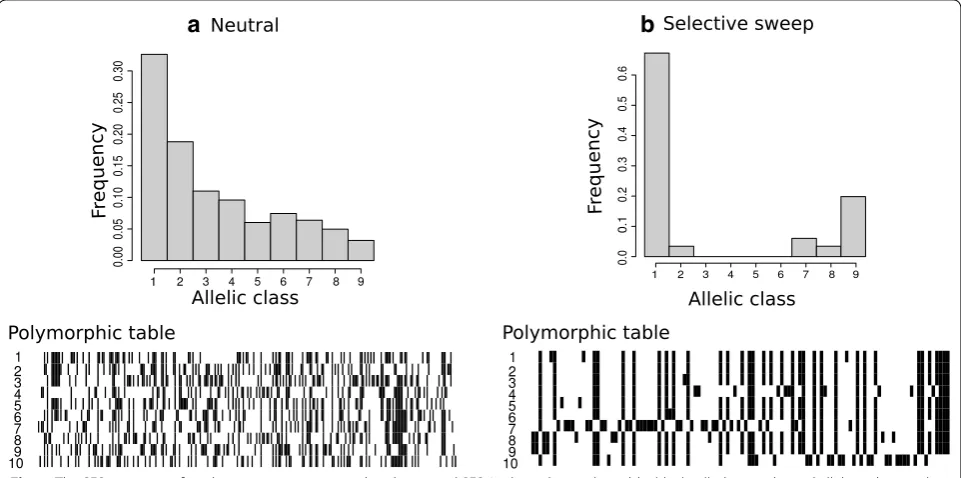
The studies by [10, 11] showed that a selective sweep trig-gers a shift of the SFS toward high- and low-frequency derived variants. This is attributed to the fact that neu-tral variants that are initially linked to the beneficial vari-ant, increase in frequency, whereas those ones that are initially not linked to the beneficial variant decrease in frequency during the fixation of the beneficial mutation. Figure 1 illustrates the shift of the SFS after a selective sweep and the corresponding polymorphic table.
A breakthrough on detecting selective sweep approaches was the test proposed by [30], known as the Kim and Stephan test for selective sweeps. They devel-oped a composite-likelihood-ratio (CLR) test to com-pare the probability of the observed polymorphism data under the standard neutral model with the probability of observing the data under a model of selective sweep. For the selective sweep model, and for each value of the selec-tion intensity (a=4Nes), where s is the selection
strength of selection as well. The Kim and Stephan test was the first to implement a CLR test on sweep detection, and it has been used to detect selection on candidate loci [31, 32]. It adopts, however, several oversimplified assumptions. First, the neutral model was derived by an equilibrium neutral population, i.e., a population with constant population size. Second, the selection model was derived by Fay and Wu’s model [11], where only the low- and the high-frequency derived classes are assumed. Concerning the execution of the Kim and Stephan test, run time and memory requirements are extensively large, yielding the approach not suitable for genome-scale detection of selective sweeps.
Detecting sweeps based on LD
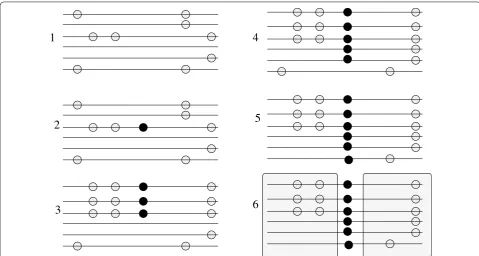
The third signature of a selective sweep consists of a spe-cific pattern of LD that emerges between SNPs in the neighborhood of the target site for positive selection. Upon fixation of the beneficial mutation, elevated levels of LD emerge on each side of the selected site, whereas a decreased LD level is observed between sites found on different sides of the selected site. The high LD levels on the different sides of the selected locus are due to the fact that a single recombination event allows existing poly-morphisms on the same side of the sweep to escape the sweep. On the other hand, polymorphisms that reside on different sides of the selected locus need a minimum of two recombination events in order to escape the sweep.
Given that recombination events are independent, the level of LD between SNPs that are located on different sides of the positively selected mutation decreases. Fig-ure 2 shows an example of the LD patterns emerging after a sweep.
The LD-based signature of a selective sweep was thor-oughly investigated by Kim and Nielsen [12]. In this study, they introduced a simple statistic, named ω-
sta-tistic, that facilitates the detection of the specific LD pat-terns that emerge after a sweep. For a window of W SNPs that is split into two non-overlapping subregions L and R, with l and W−l SNPs, respectively, the ω-statistic is
computed as follows:
Jensen et al. [33] evaluated the performance of the
ω-statistic in terms of the capacity to separate between
neutral demographic models and selective sweeps, and showed that the ω-statistic accurately detects the targets
of positive selection for demographic parameters rele-vant to natural non-equilibrium populations, such as the cosmopolitan population of D. melanogaster.
The role of demography in selective sweep detection Demography introduces severe challenges on the detec-tion process for positive selecdetec-tion due to its confounding
(2) ω=
l
2
+W−l
2
−1
i,j∈Lr2ij+
i,j∈Rrij2
(l(W −l))−1
i∈L,j∈Rrij2
.
a
b
nature regarding the signatures of genetic hitchhiking. Selective sweep detection becomes feasible mainly due to two factors: (a) the fixation of the beneficial muta-tion, and b) the fact that coalescent events occur at a higher rate in the presence of a sweep than they do in its absence. It is these two factors, along with recombination events, that generate the specific signatures of a selective sweep, enabling us to detect traces of positive selection in genomes. However, additional factors can also trigger a high rate of coalescent events, leading to the generation of similar (to a selective sweep) signatures in the genome, and thus misleading current selective sweep detection approaches. For instance, assume a bottleneck event that is characterized by three phases: (a) a recent phase of large effective population size, (b) a second phase, prior to the first one, of small population size, and (c) an ances-tral one of large population size. It is due to the decrease of the effective population size in the second phase that a high rate of coalescent events occur, thus raising the pos-sibility of observing a large number of coalescent events in a relatively short period of time. Furthermore, if the second phase is not too severe, lineages can escape the bottleneck, passing to the ancestral phase of large effec-tive population size, and therefore requiring more time to coalesce. In a recombining chromosome, genomic
regions that have witnessed a massive amount of coales-cent events during the bottleneck phase may alternate with genomic regions with lineages that have escaped the bottleneck phase (Fig. 3). Such alternations can generate SNP patterns that are highly similar to those generated by a selective sweep, yielding the detection process very challenging, if not unfeasible [34].
It is well known that certain demographic scenarios generate spurious SNP patterns that resemble a selec-tive sweep. Yet, it is generally believed that, unlike the localized effect of a selective sweep, neutral demographic changes generate genome-wide patterns. This idea of ‘local sweep effects’ vs. ‘global demographic effects’ has been extensively used to regulate the demography-induced false positive rates [16, 17, 35]. In SFS-based sweep scans, this idea translates to a two-step computa-tional approach that entails the initial estimation of an average, genome-wide SFS (background SFS) followed by a detection step, for those genomic regions that fit the selection model but not the background SFS. An issue with such an approach, however, is that it does not take into account the variation of the SFS in different regions of the genome, and it assumes an approximately uni-form behavior of the SFS along a recombining genome. This is not the case for demographic models, such as
1
2
3
4
5
6
bottlenecks, which generate great variance along a recombining chromosome [34, 36–38]. Therefore, under certain bottleneck demographic scenarios, there can be neutral-like genomic regions, as well as sweep-resem-bling ones, regardless of the actual existence of a selective sweep. Since both recombination and the alternation of genealogies along a recombining chromosome are sto-chastic, it is highly challenging to determine which gene-alogies are shaped by the neutral demographic process and which genealogies are shaped by the action of posi-tive selection at a certain location in the genome. Cur-rent approaches are not able to completely overcome the confounding effect of bottlenecks on positive selection in recombining chromosomes, therefore users should be careful when interpreting results of selective sweep scans. It should be noted however, that, several tools, such as SweepFinder, SweepFinder2, SweeD, and Omega-Plus, and/or the deployment of the demographic model as the null model, contribute to alleviating the problem generated by the confounding effects of demography.
Demography not only affects the False Positive Rate (FPR) of the detection methods, or our ability to distin-guish it from selective sweeps, but additionally repre-sents an obstacle in the detection process. This derives from the fact that the SNP patterns which emerge from the combined action of demography and selection are unknown. For instance, the SFS-based tools Sweep-Finder and SweeD (presented in a following section), assume that if a lineage escapes the selective sweep due to a recombination event, then, prior to the sweep, its
frequency is given by the neutral (or background) SFS. This is valid if the selective sweep has occurred in a con-stant-size population. If, however, the population has experienced population size changes (or other demo-graphic events such as migrations), this assumption does not necessarily hold.
Given the difficulties that bottlenecks pose on identify-ing accurately the footprints of selection, it is unfortunate (even though expected) that most natural populations have experienced bottlenecks during their evolutionary history. For example, the European population of D. mel-anogaster experienced a severe bottleneck about 15,800 years ago, when the European population diverged from the African population. The duration of the bottleneck was about 340 years and the effective population size during the bottleneck was only 2200 individuals [39]. Regarding the demography of human populations, the proposed models suggest several bottleneck (founder) events and interactions (gene flow) between subpopula-tions [40]. Domesticated animals have also experienced a series of bottleneck events during the domestica-tion process. Using only mtDNA and the Approximate Bayesian Computation methodology, Gerbault et al. [41] report that goats have experienced severe bottleneck events during their domestication. Approximate Bayesian Computation was also used to provide insights into the demographic history of silkworm [42]. Using 17 loci in the domesticated silkworm, they reported that the most plausible scenario explaining the demographic history of silkworm comprises both bottleneck and gene flow events [42].
Methods and tools Summary statistics
Summary statistics are inexpensive calculations on the data, typically implemented following a sliding window approach where the window slides along the genome with a fixed step. Simpler statistics such as Tajima’s D or the SNP count do not require sequencing, but only SNP calling, whereas LD-based ones, like counting the num-ber of haplotypes or measuring haplotypic heterozygosity require sequencing prior to scanning the genomes. Sev-eral summary statistics serve as neutrality tests due to the fact that their distributions differ distinctively between neutrality and the presence of strong positive selection.
Relying on Tajima’s D, Braveman et al. [10] were able to detect genomic regions affected by recent and strong positive selection in simulated datasets, as well as to demonstrate that regions of low genetic diversity and low recombination rate (e.g., around centromeres or at telom-eres) are not compatible with a simple hitchhiking model. Since then, Tajima’s D has been deployed in numerous studies as a neutrality test to detect selection [43–49].
This summary statistic captures the difference between two estimates of the diversity level θ =4Neµ, where µ is the mutation rate. The first estimate, π, is based on
the number of pairwise differences between sequences, while the second one, Watterson’s θ (θW), is based on the number of polymorphic sites. Tajima’s D obtains nega-tive values in the proximity of a selecnega-tive sweep, since
π decreases with both high- and low-frequency derived
variants, while θW remains unaffected.
In 2000, Fay and Wu [11] proposed a new statistic, the well-known Fay and Wu’s H, which obtains low val-ues in regions where high-frequency derived variants are overrepresented. To distinguish between high- and low-frequency derived variants, Fay and Wu’s H relies on information derived from an outgroup species. The ancestral state is considered to be the one that is com-mon between the ingroup and the outgroup. Addition-ally, Fay and Wu [11] invented a new unbiased estimator for θ, named θH, which assumes high values in regions
with overrepresented high-frequency derived variants. The H statistic is defined as the difference between π and
θH, and as such it becomes significantly negative in the
proximity of a beneficial mutation. Since a backmutation will result in the incorrect inference of the derived poly-morphic state, Fay and Wu’s H requires the probability of mis-inference to be incorporated in the construction of the null distribution of the statistic. In 2006, Zeng et al. [50] improved the H statistic by adding the variance of the statistic in the denominator, thus scaling H by the variance of the statistic.
Depaulis and Veuille [51] introduced two neutrality tests that rely on haplotypic information. The first sum-mary statistic, K, is simply the number of distinct haplo-types in the sample, assuming low values in the proximity of the beneficial mutation. The second test measures haplotype diversity, denoted by H (or DVH, Depaulis and Veuille H, to be distinguished from Fay and Wu’s H). DVH is calculated as DVH =1−K
i=1p
2
i, where
pi is the frequency of the ith haplotype. Both the DVH
and the K summary statistics are conditioned on the number of polymorphic sites, s, which yields the con-struction of the null (neutral) distribution of the statistic rather problematic. Depaulis and Veuille simulated data using a fixed number of polymorphic sites s, and without conditioning on the coalescent trees. This approach is incorrect because the number of polymorphic sites is a random variable that follows a Poisson distribution, and it is determined by the total length of the (local) coales-cent tree and the mutation rate. Thus, to construct the null distribution of the statistic, a two-step approach is required: first, a coalescent tree is generated accord-ing to the demographic model and mutations are placed randomly on its branches (this step can be achieved
using Hudson’s ms [52]), and second, a rejection process is applied in order to condition on the number of poly-morphic sites s, during which only the simulations that produced s segregating sites are kept while the rest are discarded.
Typically, summary statistics are applied on whole genome data following a sliding-window approach, which allows inexpensive computations on large data-sets for those statistics used as neutrality tests. However, two problems exist with the use of summary statistics as neutrality tests. The first problem is that the window size is fixed, which, regardless of the way it is measured, i.e., either as number of SNPs or as number of base pairs, it can be of critical importance for the acceptance or rejec-tion of the null hypothesis. For example, it is possible to not reject neutrality when using Tajima’s D on 1-kb win-dows, while rejecting neutrality when using the same summary statistic on 2-kb windows. More advanced tests, such as SweepFinder/SweepFinder2, SweeD, and OmegaPlus implement variable-sized windows (see below). While evaluating windows of varying sizes does not solve the problem completely, due to the inevitable existence of lower and upper bounds for the window sizes, such tests are more robust to the window size parameter. The second problem, which is common for most neutrality tests, is that they are not robust to demo-graphic changes of the population. For instance, Tajima’s D can assume negative values in a population expansion scenario as well as locally in genomic regions under a bottleneck scenario. It also becomes negative in genomic regions that have experienced purifying selection. Fay and Wu’s H can become negative in demographic models that increase the high-frequency derived variants. Such demographic models include gene flow [53] or sampling from one deme that is part of a metapopulation [54] (Pavlidis, unpublished data).
Detecting sweeps in subgenomic regions
In addition to summary statistics, which due to low com-putational costs are highly suitable for scanning whole genomes, various stand-alone software implementations have also been released in the previous years, with initial releases focusing mostly on the analysis of subgenomic regions with limited number of SNPs, due to increased computational requirements.
Kim and Stephan test [30]
whereas under a neutral model, the probability to observe a mutation of certain frequency is given by the standard neutral SFS. Then, a Composite Likelihood Ratio test (CLR) is performed. High CLR values denote a candidate region for a selective sweep. To obtain a threshold value for the CLR, simulations should be performed under a reference demographic model (without selection). The Kim and Stephan test can be only applied on subgenomic data.
Pavlidis et al. [55]
The detection approach proposed by Pavlidis et al. [55] relies on a machine-learning paradigm to detect selective sweeps in candidate subgenomic regions. This approach implements a support vector machine (SVM) classifier to separate neutral datasets from datasets with selection and demography. SVM classifiers, and in general super-vised machine learning approaches, require a training phase, where the algorithm “learns” to separate neutral from selection scenarios based on concrete simulated examples, either neutral or selected ones. In the train-ing phase, neutral models incorporate the demographic model, whereas selection models incorporate both the demographic model and selection. One problem that arises from such an approach is that a multitude of models might exist for the models with selection (e.g., time of the onset of beneficial mutation and selection coefficient). Pavlidis et al. [55] used a mixture of selec-tion models with various selecselec-tion coefficients and vari-ous onset times of the beneficial mutation. The method evaluation revealed satisfying results, but the required training phase of the SVM prevented the application of this approach at a full-genome scale, due to prohibitively large execution times.
Detecting sweeps in whole genomes
The advent of Next Generation Sequencing (NGS) paved the way for the analysis of whole genomes at different geographic locations and environmental conditions, and revealed a need for more efficient processing solu-tions in order to handle the increased computational and/or memory requirements generated by large-scale NGS data. While typical summary statistics are gener-ally suitable for NGS data, they are applied on fixed-size windows, and as such they do not provide any insight on the extent of a selective sweep. More advanced meth-ods that rely on the CLR test (e.g., SweepFinder [16], SweepFinder2 [56], and SweeD [17]) or on patterns of LD (e.g., OmegaPlus [18, 57]), perform a window-size optimization approach that provides information on the genomic region affected by a selective sweep at the cost of increased execution times. The aforementioned meth-ods have been widely used to detect recent and strong
positive selection in a variety of eukaryotic or prokaryotic organisms, such as human [16, 58, 59], D. melanogaster [60–63], lizards [64], rice [65], butterflies [66], and bac-teria [67].
SweepFinder
In 2005, Nielsen et al. [16] released SweepFinder, an advanced method to detect selective sweeps that relies on information directly derived from the SFS. SweepFinder implements a composite likelihood ratio (CLR) test, with the numerator representing the likelihood of a sweep at a given location in the genome, and the denominator accounting for the neutral model. An important feature of SweepFinder is that neutrality is modeled based on the empirical SFS of the entire dataset. All SNPs are con-sidered independent, therefore allowing the likelihood score per region for the sweep model to be computed as the product of per-SNP likelihood scores over all SNPs in a region. SweepFinder was among the first software releases with the capacity to analyze whole genomes via a complete and standalone implementation.
SweepFinder can process small and moderate sam-ple sizes efficiently. However, the source code does not include support for a large number of sequences, yielding analyses with more than 1027 sequences numerically unstable due to unhandled floating-point underflows [17]. Additionally, SweepFinder only executes sequentially, therefore not exploiting all the computa-tional resources in modern x 86 processors (e.g., multiple cores and intrinsic instructions).
SweeD
Pavlidis et al. [17] released SweeD (Sweep Detector), a parallel and optimized implementation of the same CLR test as SweepFinder. SweeD can parse various input file formats (e.g., Hudson’s ms, FASTA, and the Variant Call Format) and provides the option to employ a user-speci-fied demographic model for the theoretical calculation of the expected neutral SFS. Pavlidis et al. [17] showed that sweep detection accuracy increases with an increasing sample size, and altered the mathematical operations for the CLR test implementation in SweeD to avoid numeri-cal instability (floating-point underflows), allowing the analysis of datasets with thousands of sequences.
SweepFinder2
More recently, DeGiorgio et al. [56] released Sweep-Finder2. SweepFinder2 uses the statistical framework of SweepFinder, and additionally it takes into account local reductions in diversity caused by the action of negative selection. Therefore, it provides the opportu-nity to distinguish between background selection and the effect of selective sweeps. Thus, it exhibits increased sensitivity and robustness to background selection and mutation rate variations. Besides the ability to account for reductions in the diversity caused by background selection, the implementation of SweepFinder2 is very similar to SweepFinder. However, there exist code modi-fications that increase the stability of SweepFinder2 on
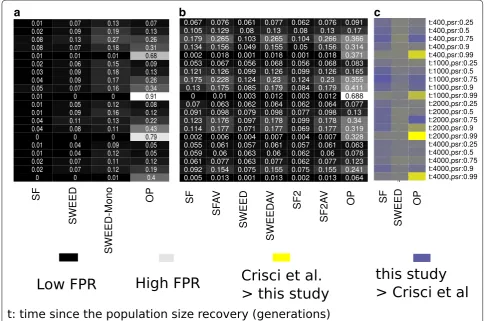
the calculation of likelihood values. Using simulated data with constant mutation rate and in the absence of nega-tive selection, SweepFinder2 results in more similar to SweeD than to the initial SweepFinder implementation (see Fig. 4).
OmegaPlus
In 2012, Alachiotis et al. [18] released a high-performance implementation of the ω-statistic [12] for the detection of
selective sweeps by searching for a specific pattern of LD that emerges in the neighborhood a recently fixed ben-eficial mutation. The ω-statistic assumes a high value at a
specific location in the genome, which can be indicative of a potential selective sweep in the region, if extended
a
b
c
contiguous genomic regions of high LD are detected on both sides of the location under evaluation, while the level of LD between the high LD regions remains rela-tively low.
OmegaPlus evaluates multiple locations along a dataset following an exhaustive per-region evaluation algorithm which was initially introduced by Pavlidis et al. [55]. The algorithm by Pavlidis et al. [55] required large memory space for the analysis of many-SNP regions and exhib-ited increased complexity, yielding the analysis of regions with thousands of SNPs computationally unfeasible. OmegaPlus introduced a dynamic programming algo-rithm to reduce the computational and memory require-ments of the exhaustive evaluation algorithm, enabling the efficient analysis of whole-genome datasets with millions of SNPs. OmegaPlus exhibits a series of four different parallelization alternatives [57, 69] for the dis-tribution of computations to multiple cores to overcome the load balancing problem in selective sweep detection due to the difference in SNP density between regions in genomes.
MFDM test
In 2011, Li et al. [70] presented a neutrality test that detects selective sweep regions using the Maximum Fre-quency of Derived Mutations (MFDM), which is a para-mount signature of a selective sweep. According to [70], the MFDM test is robust to processes that occur in a sin-gle and isolated population. This is because there is no demographic scenario in single and isolated populations that generates a non-monotonic SFS and increases the amount of high-frequency derived variants. Thus, at least in theory, the test is robust to demographic models, such as bottlenecks, when they occur in isolated populations.
There are, however, four severe problems regarding the robustness of the test, which broadly apply to other tests of neutrality as well: (a) although bottlenecks gen-erate monotonic average SFSs, certain genomic regions may locally exhibit increased amounts of high-frequency derived variants, even in the absence of positive selec-tion, (b) high-frequency derived variants are a signa-ture of selective sweeps in constant populations but it is not known whether and how they will be affected by the combined action of selection and demography, (c) in
populations that exchange migrants with other demes (non-isolated), the frequency of high-frequency derived variants may increase (e.g. [53]), and (d) backmutations (in general, the violation of the infinite site model) may also increase the amount of high-frequency derived vari-ants (Pavlidis, unpublished data).
Evaluation
The aforementioned software tools (SweepFinder, Sweep-Finder2, SweeD, and OmegaPlus, see Table 1) have been independently evaluated by two studies: Crisci et al. [15] studied the effect of demographic model misspecification on selective sweep detection, while Alachiotis and Pav-lidis [69] conducted a performance comparison in terms of execution time for various dataset sizes and number of processing cores. We summarize these results in the following subsections and partially reproduce the FPR evaluation analysis by Crisci et al. [15], including Sweep-Finder2. Besides demography, we also demonstrate how the number of polymorphic sites affects the outcome of SFS-based and LD-based neutrality tests. Note that, the iHS software [19] is also considered in both studies, but is not included in the following comparison summary due to its different scope: iHS detects ongoing sweeps relying on extended haplotypes, and not complete sweeps.
Detection accuracy
Crisci et al. [15] calculate the FPR for the neutrality tests using the following pipeline: (1) simulations from equi-librium models using Hudson’s ms [52] and constant number of SNPs. This set of simulations is used only for the determination of the thresholds for the tools; (2) simulations using sfscode [71] (constant or bottlenecked population). These data are called empirical datasets, and are used for the estimation of the FPR; (3) execu-tion of the neutrality tests on the empirical datasets. The FPR is estimated by assigning each empirical dataset to a threshold value from an equilibrium model with simi-lar number of SNPs. Note that, such an approach differs from the approach that has been followed by other stud-ies (e.g. [72, 73]), where the null model is specified by the inferred neutral demographic model. Specifying the null model by the inferred neutral demographic model con-trols efficiently for the FPR. Thus, Crisci et al. effectively
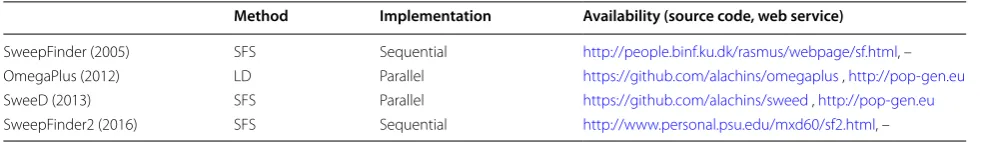
Table 1 List of software tools for selective sweep detection
Method Implementation Availability (source code, web service)
SweepFinder (2005) SFS Sequential http://people.binf.ku.dk/rasmus/webpage/sf.html, –
OmegaPlus (2012) LD Parallel https://github.com/alachins/omegaplus , http://pop-gen.eu
SweeD (2013) SFS Parallel https://github.com/alachins/sweed , http://pop-gen.eu
studied how demographic model misspecification affects the FPR. Another major difference between the approach followed by Crisci et al. and other studies is that, for the SFS-based methods (SweepFinder, SweeD), Crisci et al. calculate the neutral (or prior-to-sweep) SFS using the candidate region itself (here 50 kb), instead of the aver-age SFS on a chromosome-wide scale. Even though the first approach might have a lower FPR, the later is more powerful to detect selective sweeps: when the neutral SFS is calculated by a small genetic region that poten-tially includes a sweep, the affected (by the sweep) SFS is assumed to represent neutrality. Thus, the CLR test will assume lower values. For neutral equilibrium models, i.e., constant population size, they find that the FPR for SweepFinder ranges from 0.01 to 0.18, depending on the mutation and recombination rate: the lower the mutation and recombination rates the higher the FPR of Sweep-Finder. The FPR for SweeD ranges between 0.04 and 0.07. For OmegaPlus, the FPR ranges between 0.05 and 0.07. In general, the FPR for all tools is low when the demo-graphic model is at equilibrium.
When the assumption of an equilibrium population is violated and the empirical datasets are derived from bottlenecked populations, the FPR increases. Such an increase of the FPR is more striking when the average SFS of the empirical dataset is used to represent the SFS of the null model. The reason for such an increase is that bottlenecked datasets show great variance of the SFS from a region to another. Thus, even though, on aver-age, a bottlenecked population will have a monotonically decreasing SFS [74], there might be regions that show an excess of high-frequency and low-frequency derived vari-ants, and thus they mimic the SFS of a selective sweep.
Interestingly, Crisci et al. report low FPR for Sweep-Finder and SweeD. For OmegaPlus, the FPR they report is high for the very severe bottleneck scenario, where the population size has been reduced by 99%. For Sweep-Finder and SweeD, the FPR ranges between 0 and 0.08, and 0 and 0.13, respectively. For OmegaPlus, they report FPR between 0.05 and 0.91. We repeated the analysis of Crisci et al. for SweeD, SweepFinder, and Omega-Plus, including also SweepFinder2. Furthermore, we have included execution results of SweepFinder, SweeD and SweepFinder2 using the average SFS instead of the regional SFS. We used Hudson’s ms for all simulations, whereas Crisci et al. have used sfs_code for the empirical simulated data. In general, our results are comparable to Crisci et al., but we report higher FPR than Crisci et al. A notable exception is the case of OmegaPlus in the severe bottleneck case, where our FPR are considerably lower. Perhaps this is due to the simulation software, as we used Hudson’s ms (coalescent) simulator, and Crisci et al. used sfs_code (forward). FPR results are shown in Fig. 4.
Since FPR is considerably increasing when a false model (e.g., equilibrium) is used to construct the null hypothesis, we repeated the aforementioned analysis using a bottleneck demographic model. Using a bottle-neck demographic model for the construction of the null hypothesis reduces the FPR to very low values (Fig. 5). Here, we have used the bottleneck model characterized by a population size reduction of 0.99, a recovery time of 1000 generations, and bottleneck duration of 4000 gen-erations, even though empirical datasets were composed by additional models. The ancestral population size was equal to the present day population size.
Regarding the True Positive Rate (TPR), Crisci et al. report that under strong selection in an equilibrium pop-ulation (2Nes=1000, where s is the selection coefficient), TPR for SweepFinder and SweeD is moderate and ranges between 0.32 and 0.34. For OmegaPlus, TPR is higher and equals to 0.46. For weaker selection (2Nes=100), Omeg-aPlus also remains the most powerful tool to detect selec-tive sweeps. For selecselec-tive sweep models in bottlenecked populations, OmegaPlus outperforms SFS-based methods and it is the only test studied by Crisci et al. able to detect selective sweeps. Finally, regarding recurrent hitchhiking event (RHH), OmegaPlus reports higher values of TPR.
Execution time
The performance comparisons conducted by [69] aimed at evaluating the effect of the number of sequences and SNPs on execution time, as well as the capacity of each code to employ multiple cores effectively to achieve faster execution. Table 2 shows execution times on a single processing core for different dataset sizes, ranging from 100 sequences to 1000 sequences, and from 10,000 SNPs up to 100,000 SNPs. Additionally, the table provides (in parentheses) how many times faster are SweeD and OmegaPlus than SweepFinder.
The comparison between SweepFinder and SweeD is the most meaningful one since both tools implement the same floating-point-intensive CLR test based on the SFS, thus requiring the same type and amount of arithmetic operations. The significantly faster execution of Omega-Plus on the other hand, which relies on LD, is attributed to the fact that a limited number of computationally intensive floating-point operations are required, with the majority of operations being performed on integers, such as the enumeration of ancestral and derived alleles.
and OmegaPlus exhibit poorer parallel efficiency, which is attributed to load balancing issues that arise with an increasing variance in the SNP density along the datasets.
Detection of soft sweeps
The methods and approaches reviewed in this manu-script are appropriate for the detection of complete selec-tive sweeps that originate from a new beneficial variant.
Such selective sweeps are called ‘hard’ selective sweeps. If positive selection acts, however, on variation already segregating in the population, or if multiple beneficial alleles arise independently, the models of ‘hard’ selective sweeps do not apply. Hermisson and Pennings [75–77] coined the term ‘soft’ selective sweeps to describe such alternative models of positive selection. Soft sweeps have been documented in sticklebacks [78] and beach mice [79]. In humans, several cases of selection from stand-ing genomic variation have been reported [80–82]. The detection of soft sweeps is notably more challenging than the detection of ‘hard’ selective sweeps, because soft selective sweeps do not affect linked neutral polymor-phism to the same extent as hard selective sweeps.
Ferrer-Admetlla et al. [83] described a haplotype-based statistic, called nSL: number of Segregating sites by Length, designed to detect both soft and hard selective sweeps. nSL uses phased data and it calculates the ratio
Fig. 5 False positive rates for the selective sweep detection process under various algorithms and demographic models when the demographic model used for the construction of the threshold value is a bottleneck model instead of an equilibrium model. To compute all threshold values, we have used the bottleneck model characterized by a population recovery at time t=1000 generations, and bottleneck population size reduction by
0.90. The duration of the bottleneck was 4000 generations. FPR values have been reduced considerably compared to the case that the equilibrium model was used for the calculation of the threshold values (Fig. 4)
Table 2 Comparison of execution times (in seconds) for different dataset sizes (Fomat: D-number of sequences-number of SNPs) on a single processing core [69]
D-102–104 D-102–105 D-103–104 D-103–104
of haplotype homozygosity for the derived and ancestral state alleles. Such an approach is also taken by the iHS statistic [19]. In contrast to iHS, however, nSL meas-ures the length of a segment of haplotype homozygosity between a pair of haplotypes in terms of number of muta-tions in the remaining haplotypes, in the same region. Therefore, a genetic map is not required and nSL is more robust to recombination and mutation rate fluctuations.
Garud et al. [84] developed several haplotype homozy-gosity statistics to capture the increase of haplotype homozygosity observed in both hard and soft sweeps. According to [84], haplotype homozygosity is defined as
H1=n 1p
2
i, for n distinct haplotypes. The H1 statistic is equivalent to the haplotype heterozygosity statistic of Depaulis and Veuille [51] (see above), and assumes high values in a hard sweep case because heterozygosity in a region affected by a hard selective sweep is dramatically decreased. However, for soft selective sweeps, the power of H1 is expected to decrease because additional haplo-types are present. Two additional statistics were devel-oped by Garud et al. [84], which mainly facilitate the detection of soft sweeps: (a) the H12 statistic, defined as: H12=(p1+p2)2+ni>2p
2
i =H1+2p1p2, in which
the frequencies of the first and the second most common haplotypes are combined into a single frequency, and (b) the H123 statistic, in which the frequencies of the three most common haplotypes are combined into a single measurement. Since the frequencies of the most abun-dant haplotypes are separated into an additional value, the values of H12 and H123 are considerably increased in the proximity of a soft sweep.
Soft selective sweeps have attracted attention in recent literature mainly because they are not restricted by the limited amount of new beneficial mutations (in con-trast to hard selective sweeps), and because of the lim-ited amount of hard selective sweep patterns found in natural populations (especially human [85] and D. melanogaster [84]). It has been pointed recently by Jensen [86], however, that such an enthusiasm for soft selective sweeps may be unfounded, based on both the-oretical and experimental insights. Jensen [86] stresses as a potential reason for the limited amount of selec-tive sweeps detected in natural populations the reduced power of existing tests to detect hard selective sweeps in the presence of complex demographic models. As argued above, such a lack of power may spring from the fact that under certain demographic models we are forced to increase the detection threshold in order to control the FPR. Therefore, several true targets are also discarded. Additionally, selective sweep models are designed assum-ing a constant, equilibrium population. Different demo-graphic models combined with positive selection may however generate different patterns of selective sweeps,
though have remained unexplored until now. Therefore, it becomes clear that under non-equilibrium demo-graphic models and/or violations of the hard selective sweep model, our ability to detect selection decreases. This, however, does not mean that selection is absent: absence of evidence does not necessarily imply evidence of absence.
Discussion
Overinterpretation of results and storytelling
Identifying genomic regions that have undergone recent and strong positive selection is an important challenge of modern evolutionary biology. Neutral evolutionary pro-cesses, such as random genetic drift enhanced by popula-tion size changes and/or gene flow, increase the rate of false positives and make it more challenging to detect genomic regions which have been targeted by positive selection. Frequently, additional validity of results is pro-vided by the fact that loci identified by selective sweep scans ‘make sense’. Pavlidis et al. [87] showed that such an approach of perceiving an increased validity of results, simply because they make sense can be dramatically misleading. They designed a simple simulation experi-ment, in which a neutrally evolved X-chromosome of D. melanogaster is scanned for selective sweeps. Then, they performed a literature mining for the (by definition false positive) identified selective sweep targets. They showed that by means of gene ontology it would make perfect sense to identify such targets even though they are false positives. The study by Pavlidis et al. [87] showed that interpretation of the results should be treated very care-fully and overinterpretation should be avoided.
applying several neutrality tests and then showing that several of them reject neutrality (or showing only those that reject neutrality) should be avoided. A better prac-tice is to combine the tests in a unified framework and not independently. For example, [55, 88, 89] used super-vised learning algorithms and several neutrality tests (variables) to classify genomic regions as either neutral or selected. Any correlation between the variables is incor-porated implicitly in the learning algorithms and does not affect the accuracy of the classifier. Since, however, a large number of simulations is typically required for the execution of the learning algorithms, the running time of such approaches increases considerably.
The need for high performance
Driven by the advent of DNA sequencing, several pro-jects have focused on sequencing whole genomes from various species in the past years. This has led to the dis-covery of thousands of new SNPs and the availability of a plethora of datasets that are suitable for population genetics analyses. As more genomes are being sequenced, contributing to the increasing dataset sizes, the compu-tational demands for the respective analyses increase as well. This poses a challenge to existing and future soft-ware tools as High Performance Computing (HPC) techniques are becoming a prerequisite for conducting large-scale analyses.
Reducing execution times and enabling processing of large-scale datasets on limited hardware resources, such as off-the-shelf workstations, requires source codes to abide by several basic HPC principles. For instance, understanding how memory accesses affect performance, or which scheduling/communication strategy among multiple cores is the most efficient for a particular task, can substantially reduce execution times by allowing the software to utilize the hardware resources in current x 86 processors in the most effective way. With Moore’s law being continued in the form of an increasing number of cores per processor and an increasing width for vector registers1, not employing multithreading2 and/or vector
intrinsic instructions in newly developed tools can lead to significant underutilization of processors.
However, although optimization techniques such as kernel vectorization have the potential to accelerate pro-cessing, the nature of operations and the computational demands of the target task for performance improvement need to be carefully examined. For instance, a recent study [90] revealed that in order to achieve high-perfor-mance for large-scale LD computations that comprise thousands of sequences and SNPs, vector intrinsics must be avoided. This is due to the fact that the computational bottleneck in LD-based analyses for large sample sizes is the enumeration of ancestral and derived alleles in SNPs. This operation is efficiently implemented via the use of an intrinsic population count command, which how-ever operates only on regular registers, i.e., 32- or 64-bit words. Deploying vector intrinsics for LD leads to poorer performance due to increased data preparation times (storing and retrieving words in vector registers).
In addition to software-level optimizations for faster completion of bioinformatics analyses, a variety of hard-ware-accelerated solutions have also been proposed in the previous years. Hardware platforms, such as Graphics Processing Units (GPUs) and Field Programmable Gate Arrays (FPGAs), have been widely targeted for the accel-eration of large-scale analyses, and a variety of bioinfor-matics algorithms have been successfully ported on these architectures, from sequence alignment kernels [91] and phylogenetic tree scoring functions [92, 93] to large-scale LD computations [90] and epistasis detection in Genome Wide Association Studies [94].
1 Most commodity processors support vector processing, i.e., single instructions that operate on one-dimensional arrays of data that are stored in vector registers.
2 Multithreading is a coding technique that enables the software to deploy multiple cores per processor for parallel processing.
Conclusions
Detecting recent and strong positive selection is a fascinating challenge of modern population genet-ics. In this manuscript, we conducted a survey of approaches, methods, and software packages that can be used to pinpoint the genomic regions where posi-tive selection has operated recently. A multitude of approaches can be used for such a purpose, aiming at capturing genomic selective sweep signatures. Regard-ing computational efficiency, selective sweep detec-tion methods range from computadetec-tionally inexpensive summary statistics to complete software releases with higher computational and memory demands, that offer greater flexibility (variable window size) and are able to estimate selection-related parameters (e.g. selection strength, size of the genomic region affected by the selective sweep). Despite the progress in the develop-ment of approaches to detect selective sweep, scanning for selective sweeps remains a challenging task mainly because of the confounding effect of demography. Thus, even though demography affects the whole genome, its effect is not homogeneous. In contrast, demography, especially bottlenecks, can generate local SNP patterns in the genome that are similar to those patterns gener-ated by positive selection. In a whole-genome analysis it is extremely challenging, if not unfeasible, to sepa-rate such pseudo-selective sweep signatures from real selective sweeps. We emphasize that further research is needed to successfully detect selective sweeps within a non-equilibrium population (e.g., when the popula-tion size changes) because the respective sweep pat-terns may differ from the expected signatures that are detected by existing software tools. Moreover, over-interpretation of the results, in terms of Gene Ontol-ogy, should be avoided. Understanding the strengths and limitations of the methods and tools is crucial to avoid unnecessarily long execution times and/or misled conclusions.
Authors’ contributions
PP and NA designed the study and wrote the manuscript. Both authors read and approved the final manuscript.
Acknowledgements
We would like to thank two anonymous reviewers for their constructive com-ments on earlier version of the manuscript.
Competing interests
The authors declare that they have no competing interests.
Availability of data and materials
Any simulated dataset generated and analyzed during the current study is available from the corresponding author on reasonable request.
Declaration
This article has been published as part of the thematic series “Evolutionary Biology” of Journal of Biological Research-Thessaloniki with guest editors Dr.
Nikolaos Poulakakis (University of Crete) and Prof. Antonis Rokas (Vanderbilt University).
Funding
This study was partially funded by an FP7-PEOPLE Grant [FP7-PEOPLE-2013-IEF EVOGREN (625057)] to PP.
Publisher’s Note
Springer Nature remains neutral with regard to jurisdictional claims in pub-lished maps and institutional affiliations.
Received: 11 August 2016 Accepted: 29 March 2017
References
1. Maynard-Smith J, Haigh J. The hitch-hiking effect of a favorable gene. Genet Res. 1974;23:23–35.
2. Lewontin R. The genetic basis of evolutionary change. New York: Colum-bia University Press; 1974.
3. Wright S. Evolution in mendelian populations. Genetics. 1931;16:97–159. 4. Nunney L. The effective size of annual plant populations: the interaction of a seed bank with fluctuating population size in maintaining genetic variation. Am Nat. 2002;160:195–204.
5. Tellier A, Laurent SJ, Lainer H, Pavlidis P, Stephan W. Inference of seed bank parameters in two wild tomato species using ecological and genetic data. Proc Natl Acad Sci USA. 2011;108:17052–7.
6. Kaplan NL, Hudson RR, Langley CH. The “hitchhiking effect” revisited. Genetics. 1989;123:887–99.
7. Stephan W, Wiehe THE, Lenz MW. The effect of strongly selected substitu-tions on neutral polymorphism: analytical results based on diffusion theory. Theor Popul Biol. 1992;41:237–54.
8. Aguade M, Miyashita N, Langley CH. Reduced variation in the yellow-achaete-scute region in natural populations of Drosophila melanogaster. Genetics. 1989;122:607–15.
9. Stephan W, Langley CH. Molecular genetic variation in the centromeric region of the x chromosome in three Drosophila ananassae populations. i. contrasts between the vermilion and forked loci. Genetics. 1989;121:89–99. 10. Braverman JM, Hudson RR, Kaplan NL, Langley CH, Stephan W. The
hitch-hiking effect on the site frequency spectrum of DNA polymorphisms. Genetics. 1995;140:783–96.
11. Fay JC, Wu CI. Hitchhiking under positive Darwinian selection. Genetics. 2000;155:1405–13.
12. Kim Y, Nielsen R. Linkage disequilibrium as a signature of selective sweeps. Genetics. 2004;167:1513–24.
13. Pfaffelhuber P, Lehnert A, Stephan W. Linkage disequilibrium under genetic hitchhiking in finite populations. Genetics. 2008;179:527–37. 14. Malaspinas A-S. Methods to characterize selective sweeps using time
serial samples: an ancient dna perspective. Mol Ecol. 2016;25:24–41. 15. Crisci JL, Poh YP, Mahajan S, Jensen JD. The impact of equilibrium
assumptions on tests of selection. Front Genet. 2013;4:235. 16. Nielsen R, Williamson S, Kim Y, Hubisz MJ, Clark AG, Bustamante C.
Genomic scans for selective sweeps using snp data. Genome Res. 2005;15:1566–75.
17. Pavlidis P, Živković D, Stamatakis A, Alachiotis N. SweeD: likelihood-based detection of selective sweeps in thousands of genomes. Mol Biol Evol. 2013;30:2224–34.
18. Alachiotis N, Stamatakis A, Pavlidis P. OmegaPlus: a scalable tool for rapid detection of selective sweeps in whole-genome datasets. Bioinformatics. 2012;28:2274–5.
19. Voight BF, Kudaravalli S, Wen X, Pritchard JK. A map of recent positive selection in the human genome. PLoS Biol. 2006;4:e72.
20. Vitti JJ, Grossman SR, Sabeti PC. Detecting natural selection in genomic data. Annu Rev Genet. 2013;47:97–120.
21. Pool JE, Hellmann I, Jensen JD, Nielsen R. Population genetic inference from genomic sequence variation. Genome Res. 2010;20:291–300. 22. Miyashita NT. Molecular and phenotypic variation of the Zw locus region
23. Begun DJ, Aquadro CF. Molecular population genetics of the distal portion of the X chromosome in Drosophila: evidence for genetic hitch-hiking of the yellow-achaete region. Genetics. 1991;129:1147–58. 24. Langley CH, MacDonald J, Miyashita N, Aguade M. Lack of correlation
between interspecific divergence and intraspecific polymorphism at the suppressor of forked region in Drosophila melanogaster and Drosophila simulans. Proc Natl Acad Sci USA. 1993;90:1800–3.
25. Aguadé M, Langley CH. Polymorphism and divergence in regions of low recombination in Drosophila. In: Golding B, editor. Non-neutral evolution. Boston: Springer; 1994. p. 67–76.
26. Charlesworth B, Morgan M, Charlesworth D. The effect of deleterious mutations on neutral molecular variation. Genetics. 1993;134:1289–303. 27. Ewing GB, Jensen JD. The consequences of not accounting for
back-ground selection in demographic inference. Mol Ecol. 2016;25:135–41. 28. Innan H, Stephan W. Distinguishing the hitchhiking and background
selection models. Genetics. 2003;165:2307–12.
29. Stephan W. Genetic hitchhiking versus background selection: the contro-versy and its implications. Philos Trans R Soc B. 2010;365:1245–53. 30. Kim Y, Stephan W. Detecting a local signature of genetic hitchhiking
along a recombining chromosome. Genetics. 2002;160:765–77. 31. Schlenke TA, Begun DJ. Strong selective sweep associated with a
transposon insertion in Drosophila simulans. Proc Natl Acad Sci USA. 2004;101:1626–31.
32. Beisswanger S, Stephan W. Evidence that strong positive selection drives neofunctionalization in the tandemly duplicated polyhomeotic genes in Drosophila. Proc Natl Acad Sci USA. 2008;105:5447–52.
33. Jensen JD, Thornton KR, Bustamante CD, Aquadro CF. On the utility of linkage disequilibrium as a statistic for identifying targets of positive selection in nonequilibrium populations. Genetics. 2007;176:2371–9. 34. Pavlidis P, Hutter S, Stephan W. A population genomic approach to map
recent positive selection in model species. Mol Ecol. 2008;17:3585–98. 35. Li H, Stephan W. Inferring the demographic history and rate of adaptive
substitution in drosophila. PLoS Genet. 2006;2:166.
36. Barton NH. The effect of hitch-hiking on neutral genealogies. Genet Res. 1998;72:123–33.
37. Thornton KR, Jensen JD. Controlling the false-positive rate in multilocus genome scans for selection. Genetics. 2007;175:737–50.
38. Becquet C. Signatures of a population bottleneck can be localised along a recombining chromosome. 2003. http://przeworski.uchicago.edu/cbec-quet/MasterThesis.pdf. Accessed 10 Feb 2017.
39. Li H, Stephan W. Inferring the demographic history and rate of adaptive substitution in Drosophila. PLoS Genet. 2006;2:166.
40. Excoffier L, Dupanloup I, Huerta-Sánchez E, Sousa VC, Foll M. Robust demographic inference from genomic and SNP data. PLoS Genet. 2013;9:e1003905.
41. Gerbault P, Powell A, Thomas MG. Evaluating demographic models for goat domestication using mtDNA sequences. Anthropozoologica. 2012;47:64–76.
42. Yang S-Y, Han M-J, Kang L-F, Li Z-W, Shen Y-H, Zhang Z. Demographic history and gene flow during silkworm domestication. BMC Evol Biol. 2014;14:185.
43. Bachtrog D. Evidence that positive selection drives Y-chromosome degeneration in Drosophila miranda. Nat Genet. 2004;36:518–22. 44. Orengo DJ, Aguadé M. Detecting the footprint of positive
selec-tion in a european populaselec-tion of Drosophila melanogaster: multilo-cus pattern of variation and distance to coding regions. Genetics. 2004;167:1759–66.
45. Sabeti PC, Schaffner SF, Fry B, Lohmueller J, Varilly P, Shamovsky O, Palma A, Mikkelsen TS, Altshuler D, Lander ES. Positive natural selection in the human lineage. Science. 2006;312:1614–20.
46. Bigham AW, Mao X, Mei R, Brutsaert T, Wilson MJ, Julian CG, Parra EJ, Akey JM, Moore LG, Shriver MD. Identifying positive selection candidate loci for high-altitude adaptation in Andean populations. Hum Genom. 2009;4:1. 47. Bigham A, Bauchet M, Pinto D, Mao X, Akey JM, Mei R, Scherer SW,
Julian CG, Wilson MJ, López Herráez D, Brutsaert T, Parra EJ, Moore LG, Shriver MD. Identifying signatures of natural selection in Tibetan and Andean populations using dense genome scan data. PLoS Genet. 2010;6:e1001116.
48. Trujillo JT, Beilstein MA, Mosher RA. The Argonaute-binding platform of NRPE1 evolves through modulation of intrinsically disordered repeats. New Phytol. 2016;212:1094–105.
49. Luo Q, Ahmad K, Fu H-Y, Wang J-D, Chen R-K, Gao S-J. Genetic diversity and population structure of Sorghum mosaic virus infecting Saccharum spp. hybrids. Ann Appl Biol. 2016;169:398–407.
50. Zeng K, Fu Y-X, Shi S, Wu C-I. Statistical tests for detecting positive selec-tion by utilizing high-frequency variants. Genetics. 2006;174:1431–9. 51. Depaulis F, Veuille M. Neutrality tests based on the distribution of
haplo-types under an infinite-site model. Mol Biol Evol. 1998;15:1788–90. 52. Hudson RR. Generating samples under a Wright–Fisher neutral model of
genetic variation. Bioinformatics. 2002;18:337–8.
53. De A, Durrett R. Stepping-stone spatial structure causes slow decay of linkage disequilibrium and shifts the site frequency spectrum. Genetics. 2007;176:969–81.
54. Städler T, Haubold B, Merino C, Stephan W, Pfaffelhuber P. The impact of sampling schemes on the site frequency spectrum in non-equilibrium subdivided populations. Genetics. 2009;182:205–16.
55. Pavlidis P, Jensen JD, Stephan W. Searching for footprints of positive selection in whole-genome SNP data from non-equilibrium populations. Genetics. 2010;185:907–22.
56. DeGiorgio M, Huber CD, Hubisz MJ, Hellmann I, Nielsen R. Sweep-finder2: increased sensitivity, robustness and flexibility. Bioinformatics. 2016;32:1895–7.
57. Alachiotis N, Pavlidis P, Stamatakis A. Exploiting multi-grain parallelism for efficient selective sweep detection. In: Xiang Y, Stojmenovic I, Apduhan BO, Wang G, Nakano K, Zomaya A, editors. International conference on algorithms and architectures for parallel processing. ICA3PP 2012. Lecture Notes in Computer Science. Berlin: Springer; 2012. p. 56–68.
58. Besnier F, Kent M, Skern-Mauritzen R, Lien S, Malde K, Edvardsen RB, Taylor S, Ljungfeldt LE, Nilsen F, Glover KA. Human-induced evolution caught in action: SNP-array reveals rapid amphi-atlantic spread of pesticide resist-ance in the salmon ecotoparasite Lepeophtheirus salmonis. BMC Genom. 2014;15:1.
59. Pickrell JK, Coop G, Novembre J, Kudaravalli S, Li JZ, Absher D, Srinivasan BS, Barsh GS, Myers RM, Feldman MW, et al. Signals of recent positive selection in a worldwide sample of human populations. Genome Res. 2009;19:826–37.
60. Arguello JR, Cardoso-Moreira M, Grenier JK, Gottipati S, Clark AG, Benton R. Extensive local adaptation within the chemosensory system following Drosophila melanogaster’s global expansion. Nat Commun. 2016;13:7. 61. Voigt S, Laurent S, Litovchenko M, Stephan W. Positive selection at the
polyhomeotic locus led to decreased thermosensitivity of gene expres-sion in temperate Drosophila melanogaster. Genetics. 2015;200:591–9. 62. Catalán A, Glaser-Schmitt A, Argyridou E, Duchen P, Parsch J. An indel polymorphism in the mRNA 3’untranslated region is associated with gene expression variation and local adaptation in Drosophila mela-nogaster. PLoS Genet. 2016;12:1005987.
63. Wilches R, Voigt S, Duchen P, Laurent S, Stephan W. Fine-mapping and selective sweep analysis of QTL for cold tolerance in Drosophila mela-nogaster. G3. 2014;4:1635–45.
64. Laurent S, Pfeifer SP, Settles ML, Hunter SS, Hardwick KM, Ormond L, Sousa VC, Jensen JD, Rosenblum EB. The population genomics of rapid adaptation: disentangling signatures of selection and demography in white sands lizards. Mol Ecol. 2016;25:306–23.
65. Caicedo AL, Williamson SH, Hernandez RD, Boyko A, Fledel-Alon A, York TL, Polato NR, Olsen KM, Nielsen R, McCouch SR, et al. Genome-wide patterns of nucleotide polymorphism in domesticated rice. PLoS Genet. 2007;3:163.
66. Martin SH, Möst M, Palmer WJ, Salazar C, McMillan WO, Jiggins FM, Jiggins CD. Natural selection and genetic diversity in the butterfly Heliconius melpomene. Genetics. 2016;203:525–41.
67. Montano V, Didelot X, Foll M, Linz B, Reinhardt R, Suerbaum S, Moodley Y, Jensen JD. Worldwide population structure, long-term demography, and local adaptation of Helicobacter pylori. Genetics. 2015;200:947–63. 68. Ansel J, Arya K, Cooperman G. DMTPC: transparent checkpointing for
cluster computations and the desktop. In: Proceedings of the 2009 IEEE international symposium on parallel & distributed processing. IPDPS ’09. Washington, DC: IEEE Computer Society; 2009. p. 1–12.
69. Alachiotis N, Pavlidis P. Scalable linkage-disequilibrium-based selective sweep detection: a performance guide. GigaScience. 2016;5:7. 70. Li H. A new test for detecting recent positive selection that is free

![Table 2 Comparison of execution times (in seconds) for different dataset sizes (Fomat: D-number of sequences-number of SNPs) on a single processing core [69]](https://thumb-us.123doks.com/thumbv2/123dok_us/400651.1532861/12.595.58.544.85.423/table-comparison-execution-seconds-different-dataset-sequences-processing.webp)

