Measuring Performance Quality of Art2 &
Fuzzy-Art2 Algorithms in Student Knowledge
Modelling
Y.Naser Eldin1, Hythem Hashim2, Mawia Elfaki3, Samani A.Talab4
P.G. Student, Computer Department, Faculty of Sciences and Arts, Ranyah, Taif University, Saudi Arabia1 Assistant Professor, Faculty of Sciences and Arts, Blaqarn, Bisha University, Saudi Arabia 2
Associate Professor, Computer Department, School of Math and Computer sciences, Khartoum University, Sudan 3 Professor,Faculty of Computer Sciences and Technology, ElNeelain University, Sudan 4
ABSTRACT:This article handle the basic structure of the student model used within learning management systems to generate intelligent and adaptive courses using some neural network algorithms, The paper also focuses on how to modelling cognitive cases for Elneelain university students for each goal or concept of education within any subject using the Art2 and Fuzzy-art2 in student records (input vectors) and to classify student records into six varieties: very weak, weak, medium, good, very good and excellent. The paper also focuses on measuring the performance quality of each algorithm using the F-measure standard to choose the most appropriate time and accuracy algorithm to be used consistently within learning management systems.
KEYWORDS:ART2, FUZZY-ART2, Modelling, F-measure, learning management system. I. INTRODUCTION
The student model in learning management systems consists of two parts:
• The basic information of the student: The student's personal information, registration information, and the registration data are preserved.
•The cognitive information of the student: The information that indicates the cognitive level of the student as regards the parts of the curriculum during the educational process are preserved.
This information is a number of parameters that we get through the student's browsing of a course. This information includes:
1. The number of valid answers. 2. The number of wrong answers.
3. The time taken by the student to answer the examples. 4. The time taken by the student to read a specific concept.
5. The number of attempts made by the student to answer a question.
II. RELATEDWORK
According to the previous studies in using the Art2 and Fuzzy-art2 algorithms in structure of the student model used to generate intelligent and adaptive courses using some neural network algorithms, for example, Masun H, Rania and Lutfi andCarroand Rosa Maria andGhias Baraka discuss in their paper Building adaptive web-based educational system using Fuzzy-ART2 for EFL course the using of algorithms in adaptive web-based educational system and we suggest apply the Art2 or Fuzzy-art2 algorithms in structure of the student model within the learning management system after measuring performance of these algorithms.
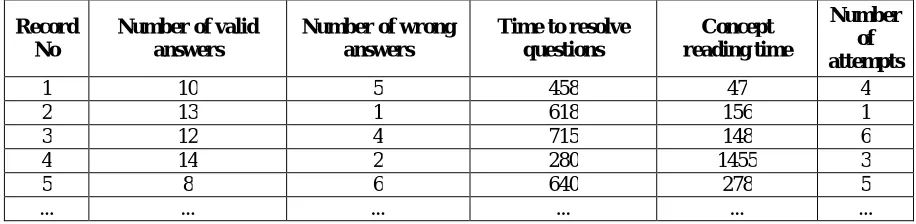
During the interaction of the student with the system, 1300 records (vector) were obtained. These records were used to assess the student and to determine his/her cognitive status at every moment. Table (1) shows examples of the student's interaction with the learning management system.
Table (1) Sample of student interaction data within the learning management system
It can be noticed from table (1), it is very difficult to conclude general laws for the classification of these vectors, so two different algorithms have been used to classify them to determine the best for their permanent use within the learning management system:
• ART2 Algorithm.
• FUZZY-ART2 Algorithm.
ART2 ALGORITHM:
DEFINITION AND ARCHITECTURE:
The Adaptive Resonance Theory network is designed to overcome the problem of stability and resilience (stability-plasticity) experienced by the neural networks under supervision (unsupervised) in the two training exercises and the summons, they can learn new inputs flexible without losing what they have learned before, thereby maintaining their stability using the concept of competitive learning. This network is marked by the resonance that occurs between the lower- upper memory and the upper- lower memory which exist between the output layer F2 and the second input layer F1. The sensitivity parameter (vigilance parameter) plays a significant role in determining the similarity or lack of similarity between them before they reach the stabilization of the training process. Fig. 1. shows the typical structure of an adaptive resonance network consisting of:
1. Input layer F0: its function to do the primary processing of the input vectors.
2. Input layer F1: It is the comparison layer between the models that have been learned in the output layer, and the models entered from the data of the input vectors.
3. Output layer F2: in which the input vectors are classified and preserved.
Number of attempts Concept
reading time Time to resolve
questions Number of wrong
answers Number of valid
Fig.1. The typical structure of an Adaptive Resonance Network
4.Adaptive Filter: it is lower-upper memory from F1 to F2 and works as Long Term Memory. 5. Adaptive Filter: it is upper-lower memory from F1 to F2 and works as Long Term Memory.
6. Reset Subsystem: measure the degree of congruence between the upward signal (lower-upper) and between the low sign (upper-lower) from the cell that learned the characteristics of the input vectors in the output layer. You also decide to restore the status of this cell and search for another cell that achieves a specific similarity, or has learned the salient characteristics of the input vectors.
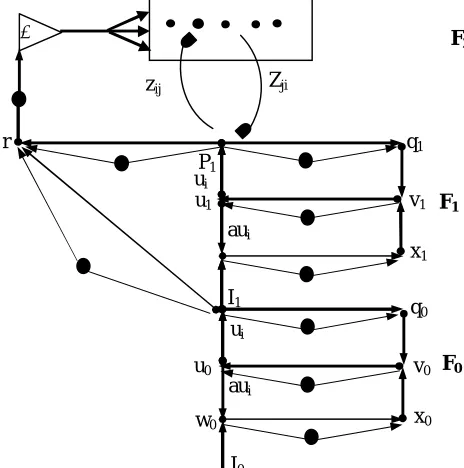
Fig. 2. : The detailed structure of an Adaptive Resonance Network
Output Layer F2
Upper- lower memory Lower- upper memory
Input Layer F1
Input Layer F0
Input sign
y j
zij Zji
r
P1
u1
ui
aui
I1
ui
u0
aui
w0
I0
x0
v0
F2
q0
F1
F0
x1
v1
Fig. 2.
s
howsthe detailed structure of an Adaptive Resonance Network where: i: input vector.
p, q, u, v, x, w: The activities of the neuronal cells of the F0 and F1 input layers.
Y: The role of the neuronal cell activity in the output layer.
Zij: Lower-upper memory. -Zji: Upper- lower memory. [5,6]
TRAINING AND RECALL PHASES
1- Initialize network parameters a, b, c, d,, , .
2- Initialize the input vectors p, q, u, v, x, w, ywith zero values for the F0 and F1 input layers.
3- Initialize the memory vectors Zij , Zji according to equations (1) and (2):
( ) (1) ≤
( )√ (2) Where: M represent the number of input cells for student parameters.
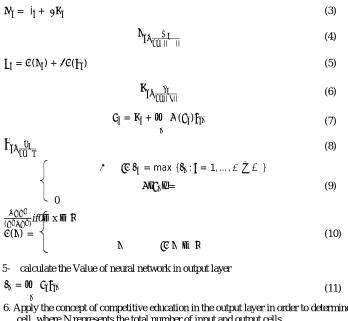
4- Enter input vector i and calculate input layers F0` , F1 according to the following equations:
= + (3)
|| || (4)
= ( ) + ( ) (5)
|| || (6)
= + ( ) (7)
(8)
= max{ : = 1, … , − }
= (9)
0
( )if0≤ x ≤
( ) = (10)
≥
5- calculate the Value of neural network in output layer
= (11)
6. Apply the concept of competitive education in the output layer in order to determine the largest value of the cell, where N represents the total number of input and output cells.
= max{ : = + 1 … } (12)
= {u } Or = { + } (13) 7- check the condition of matching
+ || ||> 1 (14)
Where:
= p + cp
e + | | + || || (15)
8. If the matching condition was met, the network enters the ringing state and moves to step 9, and in the opposite case the grid looks for another cell in the output layer to check the matching condition, so if you don't find any cell, this indicates that the input vector cannot be taught and moves to step 10.
9. The network learns the input vectors provided to it when the Zij and Zji vectors associated with the winning cell
are updated by using the following equations:
= [ − ] (16)
= [ − ] (17)
If there is winning cell the equations (16) and (17) will be:
= − = (1− )
1− − (18)
= − = (1− )
1− − (19)
These differential equations solved by using Rung-kutta method as following:
y = y +k + 2k + k
6 ; = 0,1,2, … … −1 (20)
k =ℎ ( , ) (21)
k =ℎ ( +ℎ
2, + 2) (22)
k =ℎ ( +ℎ
2, + 2) (23)
k =ℎ ( +ℎ, + ) (24) 10. If there are other vectors of input to train them are jumping to step (4).
11- End. [1,3,6,7,9]
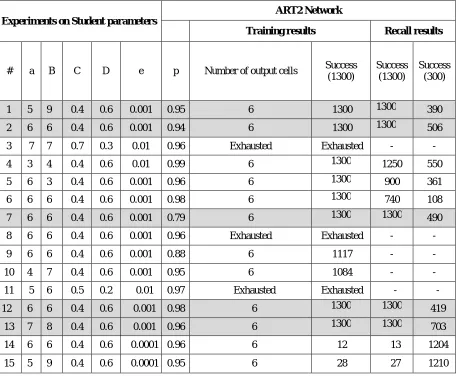
Table (2) shows the output results for the network during the training and calling processes.
Experiments on Student parameters
ART2 Network
Training results Recall results
# a B C D e p Number of output cells Success (1300)
Success (1300)
Success (300)
1 5 9 0.4 0.6 0.001 0.95 6 1300 1300 390 2 6 6 0.4 0.6 0.001 0.94 6 1300 1300 506 3 7 7 0.7 0.3 0.01 0.96 Exhausted Exhausted - - 4 3 4 0.4 0.6 0.01 0.99 6 1300 1250 550 5 6 3 0.4 0.6 0.001 0.96 6 1300 900 361 6 6 6 0.4 0.6 0.001 0.98 6 1300 740 108 7 6 6 0.4 0.6 0.001 0.79 6 1300 1300 490 8 6 6 0.4 0.6 0.001 0.96 Exhausted Exhausted - - 9 6 6 0.4 0.6 0.001 0.88 6 1117 - - 10 4 7 0.4 0.6 0.001 0.95 6 1084 - - 11 5 6 0.5 0.2 0.01 0.97 Exhausted Exhausted - - 12 6 6 0.4 0.6 0.001 0.98 6 1300 1300 419
13 7 8 0.4 0.6 0.001 0.96 6 1300 1300 703 14 6 6 0.4 0.6 0.0001 0.96 6 12 13 1204 15 5 9 0.4 0.6 0.0001 0.95 6 28 27 1210
Table 2: Output results for the ART2 network during the training and calling processes.
DISCUSSION:
• The results of the experiments (1, 2, 7, 12 and 13) are considered to be better than a large number of experiments conducted on the web until they reached their optimal response, it is noted that all of the input vectors representing students’ qualities have been identified and distributed to 6 cells in the network's output layer during the training process. Also, during the recognition process, the network was able to call all the old or trained (1300) and new (300) input vectors at a rate of 87.68% and in a stable manner.
• The network was able to learn at an average time of 22.6 seconds per vector, while it was able to identify them with an average time of 21.1 seconds.
• Sometimes, the network cannot summon the input vectors that it has previously learned if inappropriate parameters are used. This experience reflects the problem (4, 5, 6).
• Network parameters affect the network's training rate and play an important and vital role in speeding up the process of identification, classification and calling of the network. This can be observed by comparing the experiments (9, 10) and the experiments (1, 2, 7, 12, 13).
• In the experiment No. 12, the network was able to learn and summon all applicable input vectors, while in the experiment No. 5 it can be noted that the network has been able to learn 1300 inside vector, but it couldn’t call all the inside vector although it used the parameters of the experiment No. 12 but there is a decrease in the value of the user's sensitivity factor. A network is less cautious in the classification process when the sensitivity factor is low. The network can mug a new cell in the output layer (new cognitive condition) if the input vector representing the student's qualities is completely different on all the input vectors that are taught when the value of the sensitivity factor rises.
• The number of input vectors plays an important role in the network identification process. Despite the fact that the same parameters which were used in the experiments No. 1 and 2 were used in the experiments No. 14 and 15, the network was unable to identify all the input vectors provided to it.
• Figure 3, shows the vector of input (1) in cell (0) during 400 cycles, and that the value of Zji starts from scratch and even increases until it stabilizes and almost reaches an equal value to cell p values which represents the new input vector after the levelling process that occurred in the F1 and F2 layers.
Fig.3. Zji chart to learn cell (0) input vector (1)
FUZZY – ART2 ALGORITHM
DEFINITION AND ARCHITECTURE:
Fuzzy Adaptive Resonance Theory (Fuzzy-ART2) is a neural network topology with dynamics based on Adaptive Resonance Theory (ART). ART was the result of an attempt to understand how biological systems are capable of retaining plasticity throughout life, without endangering the stability of previously learned patterns [5, 6, 9].
Fuzzy-ART2 neural network consists of two subsystems (see figure 1), the attentional subsystem, and the orienting subsystem. The attentional subsystem consists of two fields: a feature representation field (F1), that includes several processing levels and a category representation field (F2), where competitive learning takes place. The combination of contrast enhancement, noise suppression, normalization, and pattern matching
0.005 0.01 0.015 0.02 0.025 0.03
0
51 101 151 201 251 301 351 401
1
.
is produced in F1. The two fields F1 and F2 are linked by bottom-up and top-down connections called adaptive filters or Long Term Memory (LTM). The orienting subsystem measures the degree of match between the bottom-up input pattern and top-down template pattern. [5, 6, 9].
Two preprocessing stages of the input patterns take place before they are presented F1 field. The first stage transforms the M-dimensional input pattern into an output vector a=(a1,…,aM), with each component in the interval [0, , while in the second stage complement coding is applied to generate the vector.
TRAINING AND RECALL PHASES
1- Initializing weight vectorwitha value of one.
2- InitializingFuzzy-ART2parameters: a,b,c,d,p,, [0,1]., 0, [0,1].
3- Presentaninputpatternfromtrainingsetwhichrepresentsstudent’sparametersobtainedduringtheirinteractionwiththes ystem.
4- Applyingcomplementcodingtothe inputpatterninorderto generatethe normalizedinput as following:
I =(a,ac) (25) 5- CalculatingShort Term Memory(STM) inF1[5].
(0) = (0) = 1 (26)
6-Calculating value of input layers F0 andF1:
= + (27)
=
+ || || (28)
= ( ) + ( ) (29)
=
+ || || (30)
= + ( )
(31)
=
+ || || (32)
7-Calculating theTj activityof eachnode ofF2:
(1) = | |
| | (33)
WherethefuzzyANDoperatorÙisgivenby:
(pq)imin(pi,qi) (34) Andthenorm|.|by:
| p|i1 | p i| (35) 8- ChoosingthewinningnodeJfromF2,whichhas thehighest activationTj
Tj max {Tj : j1...N} (36) 9-Ifthewinningnodedoesnotrespectthevigilancecriterion,thenode
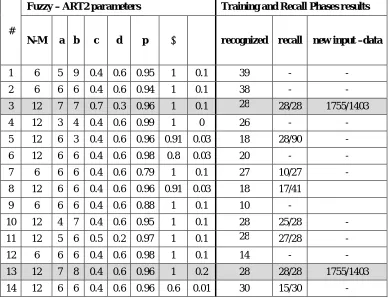
The determined number of network neural cells in the input layer have been doubled when compared with the (5) parameters of the student. That is, 10 cells, in order to apply the integrative coding process. As concerns the number of neuronal cells in the output layer, it is determined by twice the number of cognitive cases of the student, i.e , (2 * 6) = 12 so that each cell represents a single knowledge state. Then , many experiments have been conducted and also changes of the network parameters a,b,c,d,p,, have occurred to get the best result in recognition, classification and calling for the student qualities in the F2 output layer. Table (3) shows the output results for the network during the training and recall processes for the same input vectors previously used in Art2.
#
Fuzzy – ART2 parameters Training and Recall Phases results
N-M a b c d p recognized recall new input –data
1 6 5 9 0.4 0.6 0.95 1 0.1 39 - - 2 6 6 6 0.4 0.6 0.94 1 0.1 38 - - 3 12 7 7 0.7 0.3 0.96 1 0.1 28 28/28 1755/1403 4 12 3 4 0.4 0.6 0.99 1 0 26 - - 5 12 6 3 0.4 0.6 0.96 0.91 0.03 18 28/90 - 6 12 6 6 0.4 0.6 0.98 0.8 0.03 20 - - 7 6 6 6 0.4 0.6 0.79 1 0.1 27 10/27 - 8 12 6 6 0.4 0.6 0.96 0.91 0.03 18 17/41
9 6 6 6 0.4 0.6 0.88 1 0.1 10 -
10 12 4 7 0.4 0.6 0.95 1 0.1 28 25/28 - 11 12 5 6 0.5 0.2 0.97 1 0.1 28 27/28 - 12 6 6 6 0.4 0.6 0.98 1 0.1 14 - - 13 12 7 8 0.4 0.6 0.96 1 0.2 28 28/28 1755/1403 14 12 6 6 0.4 0.6 0.96 0.6 0.01 30 15/30 -
Table 3: Output results for the Fuzzy-ART2 network during the training and calling process
DISCUSSION
The experiments (1, 4, 12) show that the network has not been able to learn because of the high value of the sensitivity factor while it was able to learn in experiment 7 by using a low sensitivity factor (0.79) but the network couldn't recognize all the old or trained input vectors. This means that the best parameters were not used during the training process. This is, also, showed by the experiments (5 ,7, 10, 11).
When fast learning is applied using = 1and close to zero, the new weight of the first cell that is drawn in the output layer for the first vector of input to be presented to grid equals the highest value in the input vector. Thus, the network does not enter search rings for the most appropriate cell. Also, and a change the weight matrix for each vector of input does not occur. In this case, the one-time radiography is provided to the network, although some can select new cells during the training process.[2,7,8]
• During the experiment, the FUZZY-ART2 network was able to reach its optimization by using a lower number of input vectors (28) compared to the number used with the ART2 Network (1300).
• By applying rapid network learning and the integrative coding process, the average training time has been reduced from (22.6 seconds) to (20.3 seconds) compared to the ART2 network.
• The FUZZY-ART2 network was able to recognize old and new input vectors with an average time of 19.4 seconds per vector submitted to it. This, also, reduced the average time of recognition compared to the ART2 network.
III.MEASURING THE PERFORMANCE QUALITY OF ALGORITHMS
In order to measure the quality of the classification processes without supervision for algorithms: Art2 and Fuzzy-art2, the F-measure standard is used according to the equation (37):
F = (β + 1) /[ + ] (37)
Where:
• (precision) P: The standard of adjustment given by the following equation: P = TP / (TP + FP) (38)
• (recall) r: The standard of invocation or sensitivity given by the following equation: r = TP / (TP + FN) (39)
• , =1 , to be given to both criteria, call and adjust, weight value (0.5).
• (true positive) TP: Represents the number of input vectors that are correctly categorized in a cell.
• (False positive) FP: Represents the number of input vectors that are categorized in a cell in an incorrect way.
• (True Negative) FN: represents the number of input vectors that should not be categorized in a cell and are not actually categorized in this cell.[8,9]
F-measure has been used because it is distinguished with the following:
• Because it can change the importance of both the standard of adjustment and the standard of calling by changing the value, here it is given a weight of 0.5 in order to give them the same importance, i.e. the f-measure represents the average of the two criteria.
IV.EXPERIMENTAL RESULTS
Tables (4) and (5) show the results of the f-measure standard for algorithms used in the modelling of student knowledge.
Id Manual distribution
of input vector TP FP FN P R F-measure
0 51 43 7 210 0.86 0.170 0.283 1 55 46 8 208 0.85 0.181 0.298 2 42 37 4 205 0.90 0.152 0.260 3 50 44 6 217 0.88 0.168 0.284 4 58 47 9 212 0.83 0.181 0.297 5 44 35 3 203 0.92 0.147 0.255 300 289 0.873 166.5 0.279
Table (4), results of the performance quality of the ART2 network
As shown in table (4), we have calculated the performance of the Art2 algorithm in the modelling of student knowledge depending on Manual distributionof input vector, TP, FB, FN values and calculate the precision (p) , recall (R) and F-meature of any record according to the equations and relations uphove.
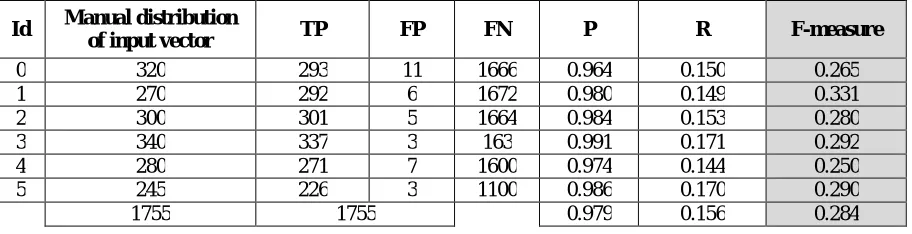
Id Manual distribution
of input vector TP FP FN P R F-measure
0 320 293 11 1666 0.964 0.150 0.265 1 270 292 6 1672 0.980 0.149 0.331 2 300 301 5 1664 0.984 0.153 0.280 3 340 337 3 163 0.991 0.171 0.292 4 280 271 7 1600 0.974 0.144 0.250 5 245 226 3 1100 0.986 0.170 0.290 1755 1755 0.979 0.156 0.284
Table (5), results of the performance quality of the Fuzzy-ART2 network
As shown in table (4), we have calculated the performance of the Art2 algorithm in the modelling of student knowledge depending on Manual distribution of input vector,TP , FB , FN values and calculate the precision (p) , recall (R) and F-meature of any record according to the equations and relations uphove.
Method Average time of training
Average time of recognition
Recognition
rate F-measure
ART2 22.6 sec 21.1 sec 87.68 % 0.279 Fuzzy-ART2 20.3 sec 19.4 sec 96.22 % 0.284
Table (6), comparison of the algorithms used in the student Vector modelling
From table (6), it can be said that the FUZZY-ART2 algorithm has been relied on within the learning management system, because its results are optimized compared to the rest of the algorithms, for the following reasons: 1. To get the highest percentage of recognition (96.22 % ).
2. To get the highest quality standard performance rating process compared to the rest of the algorithms, which are 0.284.
3. Although the value of the standard f-measure for the FUZZY-ART2 algorithm is the highest for the FUZZY-ART2 algorithm, but this was at the expense of the average time of its recognition
V. CONCLUSION
The results obtained in the presentation of students ' grades were presented and discussed in the Art2 and Fuzzy-art2, with the aim of classifying them to six levels representing the different cognitive situations of the student. The results show that the Fuzzy-art2 method is the best due to the highest rate you of recognition 96.22% with the highest value of the performance quality standard for the vector classification student (f-measure = 0.284) through a time that suits the live self-teaching processes on the web. These results have helped to tailor the curriculum's map to the different knowledge situations of the student in relation to each concept of the curriculum.
That is, it is better to use the student's brain cognitive mapping by the student's model of the learning management system. All this occurs through using the FUZZY-ART2 algorithm.
Finally, the quality of the student's knowledge classification in the learning management systems is considered to be an important factor in securing and presenting an appropriate learning syllabus adapted to the his / her cognitive situation. Thus increasing the student's interest in the follow-up and finalization of the curriculum.
REFERENCES
[1] Boucher P. et al., Compounds: An Intelligent Tutoring System, for Learning to Use Compounds in English, Computer Assisted Language Learning (CALL), vol.6, pp.249-72, 1993.
[2] Brusilovsky P. and PEYLO, CH., Adaptive and intelligent Web-based educational systems, International Journal of Artificial Intelligence in Education vol.13, pp.156-169,2003.
[3] CARPENTER G.A. and GROSSBERG S., ART2-A an Adaptive Resonance Algorithm for Rapid Category Learning and Recognition, vol.6, pp.493-504, 1987.
[4] MAGOULAS G.D., et al., Towards a Computationally Intelligent Lesson Adaptation for a Distance Learning Course. 13 (1999) [5] MENGEL S., and LIVELY W, Using a Neural Network to Predict Student Responses, vol.14,pp.669 – 676,1992.
[6] Read T., et al. I-PETER, Modelling personalized and material selection, Lecture Notes in Artificial Intelligence, vol.6, pp.148-157, 2002. [7] SERIDI-BOUCHELAGHEM H. et al., Approach for Adaptive Lesson Generating, The Kluwer Proceedings of the international
Conference. 17,2004.
[8] SERIDI-BOUCHELAGHEM H. et al., A Neural Network for Generating Lessons, Journal of Computer Science 1, Science Publications vol.18pp.232-243,2005