Abstract
The Global System for Mobile communication (GSM) radio network's latest development status and its prominent interference problems were discussed. The limitations of the cellular radio network analysis using the traditional drive test and frequency scanning technology were discussed, which led to the inaccurate interference location and inefficient interference optimization. A new training sequence parallel detection technology base on timeslot sliding window was proposed. The timeslot sliding window mechanism and the training sequence parallel correlative detection algorithms were discussed in detail, and the advantage of these technologies was discussed though comparative analysis. With the successful application cases of the engineering practice in Zhejiang Province of China, the important value of the new technology proposed in this paper in the radio network planning and optimization engineering applications was proved.
Keywords:Timeslot sliding window; Training sequence; Parallel detection; Cellular radio network
1 Introduction
With high growth of mobile communication business, the load of Global System for Mobile communication (GSM) radio network increases daily. The frequency bands of GSM900, DCS1800, and EGSM have been massively implemented. The number of sites with high carrier configuration and density of frequency reuse increase constantly while the distance between base sta-tions of cellular networks is decreasing. At present, the GSM radio network of China Mobile Communications Corporation has widespread problems of excessive over-lapping coverage, severe cross-boundary coverage, and rapidly increasing probability of co-channel interference (CCI) and adjacent channel interference (ACI), which led to radio signal quality's degrading, the mobile sta-tions' (MS) reception (Rx)-Quality level 5 to 7 (received signal quality, range from level 0 to 7, level 0 to 4 indi-cates good radio signal quality and level 5 to 7 indiindi-cates poor radio signal quality) proportion's significant in-creasing, and user perception's obvious declining [1].
Analytical methods [2-4] of traditional regular hexa-gon cell clusters for interference and coverage cannot
meet the requirement of increasing complexity of radio network analysis. Moreover, traditional regular testing methods including drive test and frequency scanning test cannot locate specific interfered frequency, interference levels of serving cell, and the location of interference source cell, which becomes a technical bottleneck for further detailed optimization of current radio network.
Traditional Broadcast Channel (BCCH) frequency scan-ning data is common measuring data source of present in-tegral network structure assessment including coverage and interference [1], which can accurately reflect the radio signal coverage status of BCCH frequency [5]. There are researches on the traditional BCCH carrier frequency scan-ning technique, such as the literature [6,7]. However, trad-itional frequency scanning devices can only measure and decode BCCH channel without effectively distinguishing and measuring received power of the same traffic channel (TCH) carrier frequency coming from different cells.
Under normal circumstances, BCCH carrier frequency is full-power transmitted in normal working condition of each cell while the transmitting power of TCH frequency is influenced by factors of frequency hopping, discontinu-ous transmission (DTX), power control, etc.; in addition, BCCH frequency and TCH frequency have different reuse densities, so there is a large difference between the system noise floor levels of two types of carrier frequency. In * Correspondence:[email protected]
2
School of Telecommunications Engineering, Beijing University of Posts and Telecommunications, Beijing 100876, China
Full list of author information is available at the end of the article
different regions (grids) of cells, the received power, carrier interference ratio (C/I), and noise floor level of BCCH and TCH carrier frequency certainly have differences.
Hence, improving accurate frequency scanning meas-urement for TCH frequency besides BCCH frequency scanning measurement no doubt has significant engin-eering application value for radio network problems' analysis and optimization.
It is very important for exploring the new measuring technical means and corresponding analysis methods to tap the radio network performance potential fundamen-tally. First, new measuring technology should be researched to measure the radio network more efficiently and suffi-ciently; second, new measurement data analysis method should be researched to analyze the massive measurement data more scientifically and accurately. Thus, more precise problem location and optimization solution could be got-ten to improve and upgrade the overall performance of the radio network sufficiently.
A kind of new whole-band and high-accuracy traffic timeslot scanning technology is proposed in this paper - a training sequence parallel detection technology base on timeslot sliding window. According to the distribution of different training sequence codes that are obtained from each cell of radio network, it can distinguish and measure received power, C/I, and noise floor of co-channel fre-quency coming from different co-channel cells in radio net-worksa. It supplies new frequency scanning measurement and scientific analysis methods for accurate positioning and optimization solution of radio network interference and coverage problemsb.
The research on training sequence detection in the industry mostly focuses on the channel estimation, synchronization maintenance, and power measurement inner mobile communication system, as reflected in the literature [8-10]. The frequency scanning measurement based on the training sequence detection and its corre-sponding analysis techniques outside the system, as a new application direction, has little relevant research literature.
2 Timeslot measuring frequency scanning technology
2.1 Necessity of timeslot measurement
The high-precision timeslot measuring frequency scanning proposed in this paper can perform accurate measurement of each traffic timeslot signal power for each frequency in whole-band in period of full-frame for both BCCH and TCH carrier frequency, which is an innovative radio net-work measuring technique method in the present industry. In different test areas, it can accurately measure the re-ceived power level and C/I in different timeslots of each carrier frequency from different overlapping coverage co-channel cells associated with the training sequence code (TSC) allocation for each cell in the radio network. So, this new measuring technique method can be supplied for the
depth profiling of cellular radio network coverage and interference.
Scanning per timeslot for each carrier frequency can effectively distinguish each timeslot's idle state and traf-fic state: in the idle state of timeslot, the corresponding correlative power of all training sequence code C/I is less than 0 (C/I < 0) where the timeslot power reflects the noise floor of radio networks, so the measuring in the idle state of timeslot supplies more fine grid's accur-ate measuring data source and new analysis methods for more precise estimation of noise floor; in the traffic state of timeslot, the corresponding correlative power of all training sequence code C/I is larger than 0 (C/I > 0) under normal conditions, so whether the carrier power comes from serving cells or interference cells can be de-cided according to training sequence allocation. It offers the most scientifically objective accurate measuring data for carrier coverage and interference problems analysis.
2.2 Principle of timeslot measuring technique
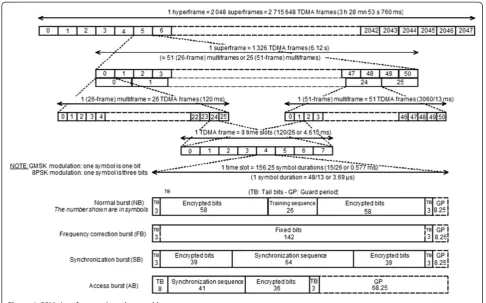
The time slot is a time interval of 576.9μs (15/26 ms), that is 156.25 bit durations, and its physical content is called a burst. Four different types of bursts exist in the system. Structure of these bursts appears in Figure 1 [11].
The most traffic in GSM is carried by normal burst (NB). NB is used to carry information on traffic and con-trol channels, except for Random Access Channel (RACH). It contains 116 encrypted bits and includes a guard time of 8.25 bit durations (30.46μs).
GSM defines nine groups of training sequence code (TSC) [12] for NB; eight groups of which are used for the cell traffic channel. The remaining group is used for transmitting signal power filling of BCCH carrier fre-quency dummy burst, which is shown in Expression (1).
Training bits¼
The downlink timeslot signal of different cells using the same carrier frequency can use different training sequences to make the distinction. This supplies an effective technical method for the distinguishing of interference signal power between different cells.
High-accuracy traffic timeslot scanning measurement provides accurate measurement for carrier timeslot sequen-ce's power and C/I in the time dimension besides measures all carriers in frequency dimension.
The core of high-accuracy timeslot measuring technique is to perform signal sampling over one frame period (eight timeslots) for every carrier frequency. Taking into account the lack of orthogonal property between nine training se-quence codes, training sese-quence parallel detection tech-nology base on timeslot sliding window proposed in this paper is used for every timeslot sampled signal detection, and performing the correlative power detection of nine training sequence codes can accurately measure the max-imum correlative power and C/I and detect corresponding TSC of training sequence code block for each timeslot.
3 Timeslot sliding window parallel detection technology
3.1 Timeslot sliding window parallel detection
In consideration of GSM as an asynchronous system, downlink signals between each base station do not
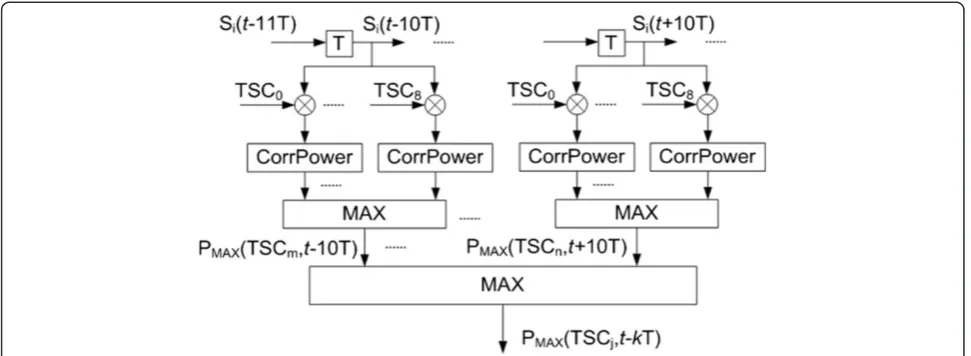
perform timeslot synchronization. The boundary of each timeslot would not coincide in one physical frame period in the received sampled signal of the same carrier com-ing from different cells. Hence, the detection for every timeslot power must perform sliding widow detection in a burst over one timeslot period. Moreover, parallel de-tecting using nine groups of training sequence code for every time-delay signal is to detect whether this timeslot exists in traffic occupancy and also to detect the corre-sponding training sequence code of maximum correla-tive power signal when timeslot is existing in traffic occupancy. Figure 1 shows the parallel sliding window time slot detection technology method.
The parallel detection sliding window that Figure 2 shows consists of 21 delayers. Time delay period of every delayer T is 1μs (T= 1μs). The whole length of sliding
window that is extended for 10 μs to both sides from
central point is totally 21μs. The sampled signal delayed every time is performed parallel correlative detection with nine groups of training sequence codes.
sequence detection method, and each delayer has 1 μs time delay.
Five bits at the beginning and 5 bits at the end that are from training sequence of 26 bits for each group are obtained by 16 bits (located in the center point) ori-ginal sequence's performing period expanding, so there will be both 5 zero points on both sides of correlative peak value when using 16 original bits to perform cor-relative detecting for transmitted timeslot signal of the cell.
It totally needs 21 parallel strongest training sequence code correlative power detections in all for the measur-ing of a timeslot.
3.2 Timeslot power detection
Timeslot power detection mainly contains timeslot train-ing sequence maximum correlative power detection, time-slot mean power detection, and timetime-slot noise floor power detection.
Timeslot training sequence code maximum correla-tive power detection is to detect the maximum training sequence code correlative power and C/I in one time-slot period. If one timetime-slot SLOTuof carrier frequency
fp is occupied by the traffic of serving cell CELLh
(means thehth cell in the radio network, which is allo-cated withlth training sequence code TSCl, 0≤l≤8) in
the specified test zone (grid)gq(means the qth grid in
the cellular radio network, 0≤q≤Q, on the assumption that the cellular radio network is divided intoQgrids)
and in the test time t, TSCl's maximum correlative
powerPcorrMAX(SLOTu, TSCl, t−kT) and C/I from cell
CELLh (means the hth cell in the cellular radio
net-work, 0≤h≤H, on the assumption that there are H
cells in the cellular radio network) can be detected. The
algorithm ofPcorrMAX(SLOTu, TSCl,t−kT) is expressed as
Equation (2).
PcorrMAXðSLOTu;TSCl;t−kTÞ ¼ MAX10 k¼−10 MAX
8
TSCi;i¼0Pcorr½SLOTu;TSCm;Siðt−kTÞ ð2Þ
where the symbol MAX(⋅) means the max value of
array element within parentheses is obtained. SLOTu
means the uth timeslot in one frame, 0≤u≤7. The
algorithm of training sequence code maximum corre-lative power in one frame PFcorrMAX is expressed as Equation (3).
PF
corrMAX¼ MAX 7
SLOTu;u¼0 MAX 10
k¼−10 MAX 8
TSCi;i¼0Pcorr½SLOTu;TSCm;Siðt−kTÞ ð3Þ
where PF
corrMAX¼PcorrMAXðFRAMEw;SLOTv;TSCl;t−kTÞ,
and the FRAMEwmeans thewth frame was measured.
The maximum training sequence code correlative power and the corresponding timeslot central point in one frame, eight timeslots, period is chosen as the detecting time ref-erence of timeslot analytical timeslot central point in one frame period at this time. Moreover, each timeslot central point and timeslot boundaries' dividing in one frame period is performed based on this time reference. Figure 3 shows that the training sequence code correlative power received by SLOT3is strongest within one frame period.
The rest of timeslot central points and timeslot boundar-ies' positioning extension in the whole frame period is im-plemented based on the corresponding of peak time of training sequence code correlative power received by SLOT3which is chosen as SLOT3timeslot central point
code correlative peak power detection in one whole frame period are performed on this basis.
The algorithm of traffic occupancy timeslot SLOTv's
timeslot mean received power PðSLOTv;t−kTÞ is expressed as Equation (4).
PðSLOTv;t−kTÞ ¼N1 XN−1
n¼0
ISðSLOTv;n;t−kTÞ
j j2
þjQSðSLOTv;n;t−kTÞj2Þ
ð4Þ
where IS(SLOTv, t−kT) and QS(SLOTv, t−kT),
respect-ively, are timeslot SLOTvtime periods' I and Qtwo-way
base band complex signal of received sampled signal -GSM modulating signal symbol series.Nis a SN modulat-ing symbolic number in a timeslot period. And also IS
(SLOTv,t−kT) andQS(SLOTv,t−kT) are given by
ISðSLOTv;t−kTÞ ¼fISðSLOTv;n;t−kTÞ; n¼0;1;2;…;N−1g
ð5Þ
QSðSLOTv;t−kTÞ ¼fQSðSLOTv;n;t−kTÞ;n¼0;1;2;…;N−1g
ð6Þ
3.3 Timeslot C/I detection
The signal-to-noise ratio (SNR) CtoI(SLOTv, t−kT) of
timeslot occupied by traffic can be calculated based on the measurement of PMAX(SLOTv, TSCl, t−kT) and P
SLOTv;tkT
ð Þ, the algorithm of which is expressed as
Equation (7).
3.4 Timeslot noise floor detection
For the vacant timeslot SLOTvnot occupied by traffic, the
corresponding C/I of detected training sequence code maximum correlative power is less than 0 (C/I < 0), where the timeslot detecting power is the noise floor of fp
fre-quency's radio network. All the noise floor statistic of va-cant timeslot in the specified test grid is mean noise floor of this carrier frequency Nfloor fp;t−kT
, the algorithm
of which is expressed as Equation (8).
Nfloor fp;t−kT
¼ 1
count½v;CtoI SLOTð v;t−kTÞ<0
X7
v¼0;CtoI SLOTvð ;t−kTÞ<0
PðSLOTv;t−kTÞ
ð8Þ
where count[v, CtoI(SLOTv, t−kT) < 0] is the timeslot
number of CtoI < 0 in Equation (8). Nfloor fp;t−kT
is
mean noise floor in one frame period. In the practical ap-plication, the statistical averaging of noise floor for several frame periods of several test loops from the same carrier frequency in specified test grid can be performed. It can increase effective signal's sampling quantity of the vacant timeslot to eliminate the effect brought by signal rapid fading, so that the mean value of noise floor can reflect the real situation of radio networks more accurately.
3.5 The advantage of the timeslot measurement
At present, the industry of traditional frequency scanner can only measure the BCCH frequency and the Received Signal Strength Indication (RSSI) of TCH carrier frequency and cannot distinguish and measure the co-channel TCH
CtoI SLOTð v;t−kTÞ ¼10 lgP PcorrMAXðSLOTv;TSCl;t−kTÞ SLOTv;t−kT
ð Þ−PcorrMAXðSLOTv;TSCl;t−kTÞ ð7Þ
carrier signal from different overlaying coverage cells, which has great limitation to effectively analyze and accur-ately locate wireless network problems. The literature [1] describes the algorithm theory and its application for wire-less network analysis based on the presumption that trad-itional BCCH carrier frequency measurement equivalent to TCH carrier frequency measurement in one cell. Its shortcomings are mainly in the following two aspects: first, it cannot accurately reflect the transmission power differences between BCCH and TCH the carrier TRX in radio network, which may come from the power control or RF hardware performance difference; and second, it cannot reflect the TCH carrier frequency traffic correl-ation between the different overlaying coverage cells. All these become the root causes that the interference source cannot be accurately located in current cellular wireless network optimization engineering.
Assuming that the analyzed GSM radio network area is in a dense traffic urban area, which has Noverlaying coverage cells, M carrier frequencies could be reused,
each cell has L carrier frequency TRXs on average.
When N×L>M+k,k≥2, then there must be at leastk co-channel interference cell pairs according to the trad-itional analysis presumption that TCH carrier frequency power level measurement results are equaled to BCCH carrier frequency scanning measurement results. With traditional frequency scanning measurement technology, it cannot distinguish and measure the co-channel TCH carrier signal from different overlaying coverage cells in a specific observation period; it also cannot measure the TCH traffic correlation between them, so it cannot lo-cate whether co-channel interference happens among channel cell pair, in which channel cell pair the co-channel pair co-co-channel interference happen, which co-channel cell pair has the most severe co-channel interference, and also could not choose the best carrier frequency to the adjustment and optimization of the in-terfered carrier frequencies.
In the case of traffic occupation, such as in the GSM radio network's busy traffic time, the TCH carrier fre-quencies' co-channel power from different overlaying coverage cells could be distinguished and measured dir-ectly with the training sequence parallel detection tech-nology base on timeslot sliding window proposed in this paper, by which it could locate the co-channel interfer-ence among overlaying coverage cells precisely. Further-more, though all-band frequency scanning measurement parallelly detects all the training sequences' power level in each timeslot in the measurement frame period, the carrier frequencies with low reuse density, low traffic, and low noise floor could be chosen to the adjustment and optimization of the interfered carrier frequencies. In these ways, the performance of the radio network could be fully enhanced.
The advantage of the training sequence parallel detec-tion technology base on timeslot sliding window proposed in this paper is proved through the above comparative ana-lysis, which could fundamentally overcome the problems induced by traditional frequency scanning measurement and its interference analysis presumption - TCH carrier frequency power level equaled to BCCH carrier frequency power level. The GSM cellular radio network's coverage, interference, network structure, and frequency plan could be analyzed, evaluated, and optimized more efficiently, ob-jectively, and precisely based on this new technology. The training sequence parallel detection technology could be a
‘perspective instrument’for GSM cellular radio network.
3.6 Timeslot measurement used in 3/4G network
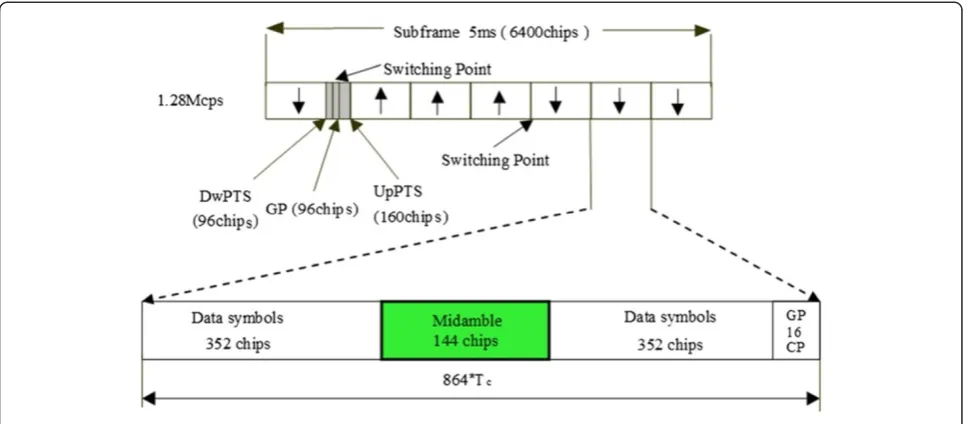
The training sequence parallel detection technology base on timeslot sliding window proposed in this paper could be expanded and used in the channels timeslot measurement of 3/4G cellular radio network. The Time Division Syn-chronous Code Division Multiple Access (TD-SCDMA) time frames, time slots, and bursts structure appear in Figure 4 [14], where Tc= 12.5/16 μs denotes the chip
duration; cyclic prefix (CP) denotes the chip length; chips denote the number of the chips.
The training sequence in TD-SCDMA burst structure is also called midamble code, which is used in channel estimation, synchronization maintaining, power meas-urement, etc.
The midamble codes have a length of 144 chips, which are generated by basic midamble codes though cycle ex-tension. The basic midamble codes have a length of 128 chips in TD-SCDMA system. TD-SCDMA system has 128 basic midamble codes, which are divided into 32 groups of four. Each cell is allocated basic midamble codes in a group. The midamble codes used by different users in a timeslot are generated by the cell's basic mid-amble codes though cyclic shift in a serving cell [15].
TD-SCDMA system is a uplink and downlink synchro-nization system [16]. For the normal timeslot, the parallel detection of the traffic channelization codes' burst midam-ble could be realized based on sliding timeslot window. A midamble codes parallel detection technology based on sliding timeslot window is shown in Figure 5.
midamble codes, which may be from different co-channel cells, could be measured using the midamble codes parallel detection technology based on timeslot sliding window proposed in this paper. These measure-ment data could be used to analyze the coverage and interference condition between co-channel cells pre-cisely, which could provide scientific basis to the high ef-ficient optimization of the TD-SCDMA cellular radio network.
For the 4G Long Term Evolution (LTE) network, its physical layer is based on orthogonal frequency division multiplexing (OFDM) with a cyclic prefix (CP) in the downlink [18]. Cell-specific reference signals (CRS) are equivalent to training sequence in 2/3G network. CRS are transmitted in all downlink subframes in a cell supporting
Physical Downlink Shared Channel (PDSCH) transmission [19], which have a fixed position in time domain and fquency domain. Therefore, the reference symbol (RS) re-ceived power (RSRP) and signal to interference plus noise ratio (SINR) of the co-channel signals from different cells could be distinguished and measured by parallel detection of the CRS based on timeslot, which provides a scientific and efficient measurement means for the interference and coverage analysis and their optimization in LTE cellular radio network.
4 Application of timeslot measurement
4.1 Timeslot measurement data
The training sequence parallel detection technology base on timeslot sliding window proposed in this paper has Figure 4TD-SCDMA time frames, time slots, and bursts structure.
already been developed and realized in the frequency scanner. Also, this kind of timeslot measurement is called as the high accurate traffic channel timeslot scanning.
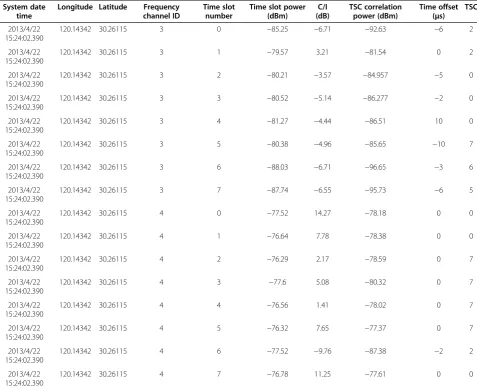
The high accurate traffic channel timeslot scanning data have been used for Zhejiang mobile communication sys-tem daily optimization engineering of positioning prob-lems of interference, evaluating the radio networks' noise floor and rationality of carrier frequencies' coverage, which has achieved the desired results. Table 1 shows the traffic timeslot measurement data. Figure 6a shows the training sequence codes' power measurement of each timeslot for different frequency. Figure 6b presents the C/I measure-ment of each training sequence code for each timeslot and different frequency. For each BCCH frequency, both meas-urement results from training sequence detection match very well with the Frequency Correction Channel (FCCH) measurement with a traditional BCCH frequency scanner. This means that the training sequence parallel detection technology base on timeslot sliding window proposed in
this paper is a perfect way to measure both BCCH and TCH timeslots.
4.2 Conjoint analysis with timeslot measurement data
By two kinds of timeslot measurement with difference training sequence code allocation by each cell, combined with layer 3 location area code (LAC) and cell identifica-tion (CI) decoding of all BCCH channels scanning from the same measuring point, the same carrier frequency transmitted power, and C/I condition coming from dif-ferent cells can be located.
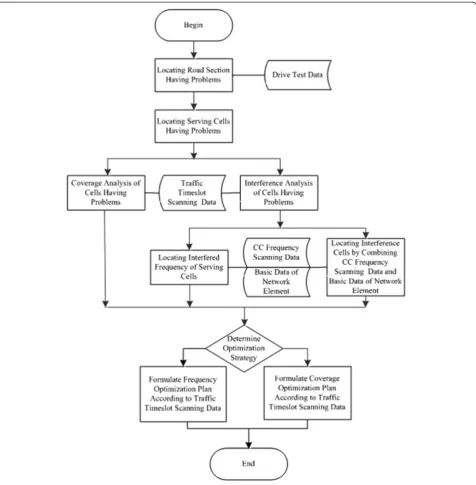
The high accurate traffic timeslot scanning equip-ment usually is used with drive test equipequip-ment in the same car in the practical engineering application, so that it may synchronously measure the traffic timeslot signal occupied by drive test equipment. At the same time, these two measuring data can be analyzed jointly. Figure 7 shows the key technique process of conjoint analysis for high accurate traffic timeslot scanning
Table 1 Traffic timeslot measurement data
frequency and drive test data. The analysis of key process is illustrated below:
(1)Locating serving cells having problems
The serving cell occupied by the present drive test terminal's traffic can be located from test data of drive test which having problems of Rx-Quality Sub, which means the serving cell having problems. (2)Coverage analysis of problem cells
From‘TSC’field and‘Correlation Power’field in the timeslot table of high accurate traffic timeslot scanning data, the coverage signal power level of the present frequency's traffic timeslot can be checked. It can be analyzed and estimated whether the present
receipted signal's bad Rx-Quality Sub is caused by weak coverage. If the max TSC Correlation Power of serving cells in the test road bad Rx-Quality problem section is lower than−85 dBm, then the problem of weak coverage needs selective analysis. Moreover, the cross-boundary coverage problem can be estimated by considering the distance of the test point of section having problems and the site location of serving cell. (3)Interference analysis of problem cells
If the coverage power level of the serving cell frequency in the timeslot table (such as Table1) is normal (for example, TSC Correlation Power >−85 dBm), 0 < C/I < 9 at the same time, then the interference situation of this frequency exists.
(4)Locating interfered frequency
For a serving cell's every frequency of the road section having bad Rx-Quality problems, the C/I value of the serving cell's each TCH timeslot can be viewed from the‘C/I’field in the timeslot table. If the TSC related with the max TSC correlation power is not the TSC of the current serving cell (C/I > 0), then the value of TSC correlation power is the reception signal level from co-channel interfer-ence cells. In addition, the value of C/I is the C/I of
receipt signal that belongs to co-channel interfer-ence cells in the test point having bad Rx-Quality problem.
(5)Locating interfering cells
If a frequency of a serving cell is interfered in the specified road section having bad Rx-Quality prob-lem, the co-channel interference cell interfering the same channel of the serving cell needs to be analyzed and located. The location algorithm of interfering cells is shown below:
For the attention, the probability of existing cells having the co-channel and the same TSC in the cells set B is very small. If it really happens, accurate location of the real interference cell can be performed according to the azimuth angle of cells and distances between cells and the test point of road section having bad Rx-Quality problems. (6)Locating reason of road section having problems
According to high accurate traffic timeslot scanning measurement data, the situation of received signal level and C/I for each cell's each carrier frequency's each timeslot of the road section having bad Rx-Quality problems can be checked from the analysis above. Whether the coverage of cells is reasonable can be analyzed with a map. If the received signal level by the drive test equipment in the road section having bad Rx-Quality problems from a
Ltd in Zhejiang Province. The Beishan Road near the West Lake in Hangzhou that existed bad Rx-Quality Sub problems for a long term was conjointly analyzed by the synchronization test of traffic timeslot scanning measurement data and drive test data. Plenty of prob-lems of coverage and interference were accurately located, which means the remarkable engineering application is effective.
As shown Figure 8, the no. 54 frequency of no. 30984 cell located by timeslot scanning data analysis in the bad quality section of Beishan Road in Hangzhou is severely interfered by several the same frequency cells with no. 54 frequency around it, so the statistic C/I of no. 54 fre-quency in no. 30984 cell is only 5.47. In addition, ac-cording to the analysis of timeslot scanning data for this section, the received power of no. 68 frequency is rela-tively small. It means its multiplexing density in this
section is relatively low, so it is suited to replace the no. 54 frequency of no. 30984 cell, to improve the signal quality for this measurement point.
Timeslot measurement supplies direct measuring techno-logical means for frequency coverage condition analysis, noise floor analysis, interference condition and locating of interference source analysis, radio network structure analysis, etc. Timeslot measurement offers the most im-portant radio measuring technological means for precise optimization and the improvement of radio networks' performance.
4.3 Network structure analysis
Using the high accurate traffic channel timeslot scanning measurement data to evaluate radio network structure mainly can perform assessments such as frequency num-ber of road overlapping coverage, TRX (carrier frequency transceiver) number of road overlapping coverage, fre-quency complexity of roads, and frefre-quency reuse density of roads. Among these assessments, the same frequency is reused forndifferent cells means existingnTRX of co-channel interference in the overlapping coverage region. The theoretical available frequency number of radio net-work is set asM.
Definition. Frequency number of road overlapping coverage NF_overlap(gq) is the (BCCH + TCH) frequency
sum of all cells measured by the high accurate traffic channel timeslot scanning equipment in the specified testing road grid gq when it is lower than the strongest
signal RPmax= 35 dB or higher than the received power
Plow=−85 dBm.
NF overlap gq ¼count i; <fi;gq >
h i
ð9Þ
The function count [•] denotes counting different
elements conforming to the condition <•> in brackets. Definition. Frequency complexity of road FCR(gq) is the
result of frequency number of roads overlapping coverage NF_overlap(gq) divided by theoretical available frequency
number M and multiplied by 100%.
FCR gq ¼NF overlap gq =M100% ð10Þ
Definition. TRX number of road overlapping coverage NTRX_overlap is the combinatorial number (frequency +
TSC) measured by the high accurate traffic channel time-slot scanning equipment in the specified testing road grid gqwhen it is lower than the strongest signal levelRPmax=
35 dB or higher than the received powerPlow=−80 dBm.
NTRX overlap gq ¼count Cð Þi;j <fiTSCj;gq>
h i
ð11Þ
Definition. Frequency reuse density of roads ρF(gq)
equals TRX number of road overlapping coverage divided
by frequency number of road's overlapping coverage mea-sured by the high accurate traffic channel timeslot scan-ning equipment.
ρF gq ¼NTRX overlap gq =NF overlap gq ð12Þ
Definition. Single frequency reuse density ρF(fi, gq) is
the TRX number of road overlapping coverage of the same carrier frequency fi having different TSC measured
by the high accurate traffic channel timeslot scanning equipment in the specified testing road gridgq. It is equal
to co-channel cells number offiexisting correlative traffic.
ρFfi;gq¼count v; <fiðTSCvÞ;gq >
h i
ð13Þ
Single frequency reuse density index can be used to screen the corresponding frequency set whose frequency reuse density is too high in interference road section having problems. Moreover, it is used to perform fquency optimization adjustment by screening lower re-use density frequencies.
The performance of radio network structure could be evaluated objectively and accurately, by using five de-fined network structure indices above, such as perform-ing alertperform-ing when frequency complexity of road (FCR) (gq) is larger than 75%, and optimization adjustment is
needed when FCR (gq) is larger than 100%; performing
alerting when frequency reuse density of road is larger than 1.5, and optimization adjustment is needed when frequency reuse density of roads is larger than 2.
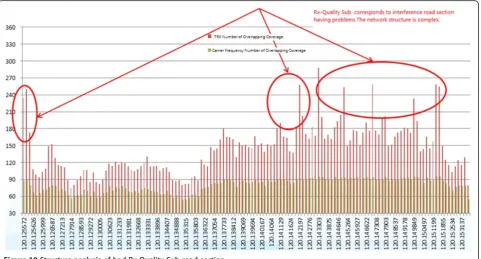
The correlation analysis index of network structure pro-posed in this paper was performed analysis validation in Hangzhou, Zhejiang. The result shows that the analysis is efficient and precise. In the interference road section hav-ing level 6 and level 7 Rx-Quality Sub of Beishan Road West Lakeside Hangzhou shown in Figure 9 (the section of rad circles pointed by arrows and the blue triangles and circles in Figure 9 marks the sites of GSM at 900 MHz outdoor cells and indoor cells, respectively; the green tri-angles and circles in Figure 9 mark the sites of Digital Cel-lular System at 1,800 MHz outdoor cells and indoor cells, respectively), the corresponding FCR is larger than 90%. In addition, frequency reuse density of roads is larger than 2 (shown in Figure 10). The radio network structure is complex, which induces the obvious frequency interfer-ence problems in the system.
targeted efficient optimization of structure problems. It surmounts the subjectivity, inaccuracy, and uncertainty analysis based on traditional BCCH frequency scanning measuring being equivalent to TCH frequency measuring. It also makes the network structure assessment turn into accurate actual measurement phase from traditional in-accurate estimation phase.
On the basis of performing objective analysis for network structure, combining the coverage analysis and interference analysis based on high accurate traffic channel timeslot scanning to perform exquisite and integrated optimization for radio network can furthest excavate and improve the potential performance of radio network.
Figure 9Rx-Quality Sub of Beishan Road, Hangzhou, and interference problem points.
5 Conclusions
The training sequence parallel detection technology base on timeslot sliding window proposed in this paper is a significant innovation of frequency scanning tech-nology. Moreover, its idea could also be applied to the radio networks measurement of 3G and 4G cellular mo-bile communication systems, which has indispensable core value of application for planning and optimizing engineer-ing's accurate analysis of radio network problems and provision of high efficient solution.
Endnotes
a
It should be noted that our training sequence parallel detection technology based on timeslot sliding window is used for downlink power level and C/I measuring, which could distinguish co-channel signal from different overlay coverage cells.
b
The research on the training sequence detection in this paper is aimed at TCH timeslot measuring, and the meas-urement data would be used to analyze and optimize the performance of cellular radio network.
Abbreviations
ACI:adjacent channel interference; BCCH: Broadcast Channel; CC: color code; CCI: co-channel interference; CDMA: Code Division Multiple Access; CI: cell identification; CRS: cell-specific reference signal; CP: cyclic prefix; C/I: carrier interference ratio; DTX: discontinuous transmission; DwPTS: downlink pilot time slot; FCCH: Frequency Correction Channel; GMSK: Gaussian filtered minimum shift keying; GP: guard period; GSM: Global System for Mobile communication; LTE: Long Term Evolution; OFDM: orthogonal frequency division multiplexing; PDSCH: Physical Downlink Shared Channel; RACH: Random Access Channel; RS: reference signal; RSRP: RS received power; Rx: reception; SNR: signal-to-noise ratio; TCH: traffic channel; TDMA: time division multiple access; TD-SCDMA: Time Division Synchronous CDMA; TRX: transmission and reception; TSC: training sequence code; UpPTS: uplink pilot time slot.
Competing interests
The authors declare that they have no competing interests.
Acknowledgements
The research project base on network structure evaluating technology of frequency scanning from this paper was highly valued and strongly supported by leaders and staff of China Mobile Communications Corporation and China mobile Zhejiang branch. Thanks to them for the smooth establishment of and good results obtained from this research project!
Author details
1School of Electronic Information Engineering, Tianjin University, Tianjin
300072, China.2School of Telecommunications Engineering, Beijing University of Posts and Telecommunications, Beijing 100876, China.
Received: 7 January 2014 Accepted: 30 June 2014 Published: 16 July 2014
References
1. H Zheng, F Chen, A radio network structure evaluating technology base on frequency scanning. Telecommun Technol J8, 74–79 (2013)
2. KH William, Frequency assignment: theory and applications. Proc. IEEE 68, 1497–1514 (1980)
3. KN Sivarajan, M Celiece RJ, JW Ketchun, Channel assignment in cellular radio network. Proc. IEEE 39th VTC, 846–850 (1989)
4. R Mathar, J Mattfeldt, Channel assignment in cellular radio networks. IEEE Trans Veh Technol42(4), 647–656 (1993)
5. N Mijatovic, I Kostanic, G Evans, Use of scanning receivers for RF coverage analysis and propagation model optimization in GSM networks, inEuropean Wireless Conference, 2008, pp. 1–6
6. N Mijatovic, I Kostanic, S Dickey, Comparison of receive signal level measurement techniques in GSM cellular networks, inIEEE CCNC, 2008, pp. 738–743
7. ZH Jiang, W Hong, L Tian, Design of a triple-band scanner for TD-SCDMA network planning and optimization, inInternational Conference on Communication Technologie, 2010, pp. 1220–1223
8. H Zhao, C Song, S Zhang, Implementation and performance analysis of channel estimation in TD-SCDMA. Mod Electron Tech J5, 86–96 (2005) 9. S Qinfang, DC Cox, A Lozano, HC Huang, Training-based channel estimation
for continuous flat fading BLAST, inIEEE International Conference on, Volumel, 28 April-2 May 2002, 2002, pp. 25–329
10. M-H Hsieh, C-H Wei, Channel estimation for OFDM systems based on comb-type pilot arrangement in frequency selective fading channels. IEEE Trans Comsumer Electron44(1), 217–255 (1998)
11. GSM Technical specifications 05.01,Physical layer on the radio path. Version 7.0.1 release, ETSI, phase 2+, 1998.
12. GSM Technical specifications 05.02,Multiplexing and multiple access on the radio path. Version 7.1.0 release, ETSI, phase 2+, 1998.
13. GSM Technical specifications 03.03,Numbering, addressing and identification. Version 7.1.0 release, ETSI, phase 2+, 1998.
14. 3GPP Technical specifications 25.221,Physical channels and mapping of transport channels onto physical channels (TDD). Version 7.b.0 release, 3GPP, TSGRAN, 2009.
15. SH Li,The Three Generation Mobile Communication System Standards TD-SCDM(People’s Posts and Telecommunications Press, Beijing, 2003), pp. 53–54
16. 3GPP Technical specifications 25.201,Physical layer—general description. Version 7.b.0 release, 3GPP, TSGRAN, 2009.
17. MG Peng, WB Wang,TD-SCDMA Mobile Communication System, 2nd edn. (Machinery Industry Press, Beijing, 2005), p. 69
18. 3GPP Technical specifications 36.201 V9.1.0,Evolved Universal Terrestrial Radio Access (E-UTRA); LTE physical layer, 2010-03.
19. 3GPP Technical specifications 36.211 V9.1.0,Evolved Universal Terrestrial Radio Access (E-UTRA); Physical Channels and Modulation, 2010-03.
doi:10.1186/1687-1499-2014-119
Cite this article as:Shiet al.:A training sequence parallel detection technology based on timeslot sliding window.EURASIP Journal on Wireless Communications and Networking20142014:119.
Submit your manuscript to a
journal and benefi t from:
7Convenient online submission 7Rigorous peer review
7Immediate publication on acceptance 7Open access: articles freely available online 7High visibility within the fi eld
7Retaining the copyright to your article