Open Access Journal of Sports Medicine
Exercise training improves fasting glucose control
Lynda Norton1 Kevin Norton2 Nicole Lewis2
1School of Medicine, Flinders
University, Adelaide, Australia;
2School of Health Science, University
of South Australia, Adelaide, Australia
Correspondence: Lynda Norton GPO Box 2100, Adelaide, South Australia 5001, Australia Tel +61 8 8201 5830 Fax +61 8 8201 3646
Email [email protected]
Purpose: Numerous studies have measured changes in fasting blood glucose (FBG) levels in response to physical activity (PA) interventions. While studies involving clinical populations such as type 2 diabetics typically report significant reductions, most others report no change in FBG. This study investigated changes in FBG in apparently healthy adults following a PA intervention.
Methods: We measured fingertip samples for FBG pre and post a 40-day PA program in 575 insufficiently active adults. The PA goal was at least 30 minutes of moderate exercise daily, and there was 73% compliance.
Results: A PA questionnaire showed the average level of activity was 69 ± 46 min/wk
preintervention, and this increased to 635 ± 458 min/wk postintervention. When the change in
FBG was regressed against baseline FBG levels, there was a significant negative relationship
(y = 2.623 − 0.471 × x; r = 0.472; P, 0.0001). The regression line showed, on average,
subjects with low pre-study glucose levels had increased FBG while those with high levels had reductions in FBG.
Conclusion: It appears that the body’s response to PA training is to upregulate glucose control, which is reflected in tighter FBG levels around a physiological set point (5.6 mmol/L, in the present study). Regulation of blood glucose is a complex neuroendocrine process with numer-ous organs involved, but it was not possible in the present study to determine which of these regulatory steps are involved in exercise-induced changes of FBG.
Keywords: physical activity, glucagon, insulin sensitivity
Introduction
Blood glucose (BG) is critical for metabolic health and survival. The concentration within the circulatory system is regulated within a narrow range in the healthy population, because there are acute life-threatening implications if BG concentrations become too low or high.1,2 Even relatively small chronic increases in BG are associated with serious
health conditions, such as obesity and type 2 diabetes. These lifestyle diseases have been rising in many countries around the world, and it is estimated that about 1.4 billion people are overweight or obese3 and about 346 million people have diabetes.4 These problems
have led to increasing efforts to find the most efficacious preventative and therapeutic interventions for metabolic-related, chronic illnesses. Both clinical and prospective stud-ies have reinforced the importance of physical activity as a key strategy to assist in the prevention and treatment of type 2 diabetes5 and for weight management.6
The use of BG measures as an indicator of metabolic health is common because they are relatively inexpensive, rapid, and require only a small capillary sample.2,7
Dove
press
O r i G i N A L r E S E A r C H open access to scientific and medical research
Open Access Full Text Article
Open Access Journal of Sports Medicine downloaded from https://www.dovepress.com/ by 118.70.13.36 on 26-Aug-2020
For personal use only.
Number of times this article has been viewed
This article was published in the following Dove Press journal: Open Access Journal of Sports Medicine
BG is also routinely measured for those who have been diagnosed with metabolic-related disorders. However, it is well established that BG levels are influenced by the time from and composition of the last meal,8 gastric emptying
rates,9 physical activity (PA),10 level of obesity,11,12 age,11,13
and a range of other neuroendocrine influences.14 Due to these
confounders, it is recommended that routine assessments of BG, as a risk factor or as part of a diagnostic procedure, are standardized to fasting and resting states.5,7
Elevated fasting blood glucose (FBG) levels have been shown to be predictive for a range of diseases, including cardiovascular-related death, in prospective epidemiological studies of nondiabetic men15 and mixed cohorts.16 A
meta-analysis by the Emerging Risk Factors Collaboration11 showed
that FBG in people without diabetes was related to risk of coronary heart disease in a nonlinear, J-shaped fashion, where there was increased risk at both ends of the FBG spectrum.
Numerous studies have measured FBG to assess the impact of various interventions on glucose control,17–19
particularly those involving increasing levels of physical activity.20,21 While studies using clinical populations such
as type 2 diabetics or those with impaired glucose tolerance have reported significant reductions in average FBG,18,22,23
others using a cross section of sedentary adults have reported no consistent change in FBG24,25 or even an increase,20,23
despite increases in insulin sensitivity in all groups. These results suggest considerable variability in terms of homeo-static control of BG and that training-induced adaptations may operate differently among individuals, depending on the preintervention FBG level.
This study investigated changes in FBG in apparently healthy but insufficiently active Australian adults, relative to baseline FBG levels, following 40 days of daily PA.
Methods
The participants in this study were part of a larger PA inter-vention study for people with low levels of habitual activity. The University of South Australia ethics committee approved this study and all subjects gave informed written consent. The methods and design of the study have been described in detail previously.26 Participants reported here were recruited from a
university, tertiary hospital, and several government depart-ments. A total of 736 subjects aged 18–60 years were randomly allocated to one of two 40-day programs involving daily activ-ity targets. Selection criteria required the subjects to:
1. be insufficiently active (,150 minutes of weighted PA
per week) when assessed, using the Active Australia Survey;27
2. satisfy the pre-exercise screening guidelines, using the
Sports Medicine Australia screening system;28 and
3. be willing to either (a) wear a pedometer daily for the duration of the 40-day intervention or (b) participate in the 40-day group PA program.
Outcome measures were obtained from all participants at baseline and immediately following the 40-day interventions. These included the level of PA undertaken pre- and postint-ervention, using the Active Australia Survey. Other measures included: anthropometric variables – height, weight, waist and hip girths, triceps, biceps, and subscapular skinfold thicknesses – using methods described by Norton and Olds;29
resting blood pressure (BP), according to the technique
rec-ommended by the American Heart Association;30 and FBG
and total cholesterol levels. Additionally, a submaximal cycle ergometer test was conducted to estimate maximal oxygen consumption.31 The results of the glucose measures are
pre-sented in this paper, and the intervention-related changes for all other variables will be reported in a separate paper.
Total cholesterol and FBG were measured using finger-tip blood samples. Subjects were required to fast for eight hours prior to the blood tests. Standard infection control procedures were used, and blood samples were processed using a Reflotron®
Plus analyzer (Hoffman La Roche Ltd, Basel, Switzerland). Prior to the study, repeated measures of total cholesterol and FBG on ten consecutive days showed coefficients of variation (CV) of 7.9% and 10.2%, respectively. The Reflotron has also been shown to have less than 1% error on duplicate samples.32
PA interventions
The two types of intervention were: (1) a pedometer-based strategy, wherein participants were instructed to achieve at least 5000 steps/day in week 1 and increase this by 1000 steps/wk to 10,000 steps/day by week 6; and (2) a group-based strategy that required participants to attend instructor-led activities three times/week (Monday, Wednesday, Friday) and undertake individual activities for at least 30 minutes on alternate days (more detail is provided in Norton et al26).
Statistical methods
Postintervention changes were assessed used paired t-tests. Regression analysis was also used to determine the associa-tion between preintervenassocia-tion measurements and postinterven-tion changes. Significance was set at P, 0.05.
Results
The results for the participants who completed both the intervention phase and postintervention testing are presented
Dovepress
Norton et al
Open Access Journal of Sports Medicine downloaded from https://www.dovepress.com/ by 118.70.13.36 on 26-Aug-2020
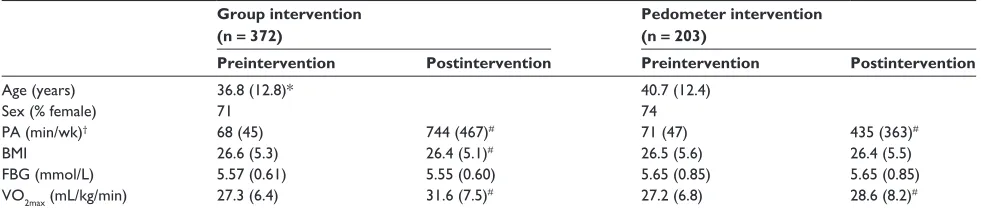
in Table 1. The table shows the data for each intervention arm separately.
There were significant increases in the PA patterns of the participants over the 40-day interventions. As expected, given the large increases in PA, there were significant improve-ments for BMI and aerobic fitness, confirming participant compliance with the programs. There was no change in mean FBG following the interventions. Furthermore, there were no differences in the FBG changes between the two intervention cohorts (pedometer versus group). Therefore, all participants who completed the study (n = 583; 79.2%) were combined for the analyses. However, there were eight participants who had physiologically improbable preintervention FBG values less than 3 mmol/L and these outliers were excluded. The final sample size used in all further analyses was n = 575.
The PA questionnaire showed the average level of activity was 69 ± 46 minutes/week preintervention (63 ± 42 minutes/week unweighted PA) and this increased sub-stantially to a weighted PA level of 635 ± 458 minutes/week
postintervention (458 ± 326 minutes/week unweighted PA).
At postintervention testing the proportion of participants who
were now sufficiently active ($150 min/wk) increased from
zero to 85.7%.
Preintervention FBG levels showed the character-istic increase with age (y = 4.82 + 0.021 × age (yr); r = 0.301; P, 0.0001). Similarly, the relationship between preintervention BMI and FBG was also signif icant (y = 4.33 + 0.048 × BMI; r = 0.309; P, 0.0001). There was a weak but significant association between change in BMI
and change in FBG (y = 0.002 + 0.103 × change in BMI;
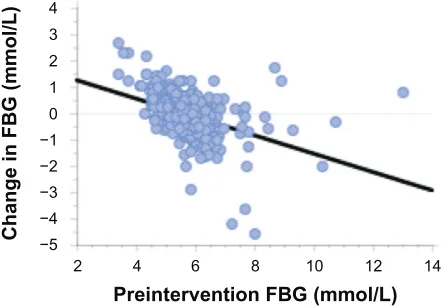
r = 0.118; P, 0.0044). There was no association between preintervention FBG and fitness (P= 0.252). When the change in FBG across the intervention was regressed against baseline FBG levels, there was a significant negative relationship. The regression line intersects the zero FBG change at a preintervention FBG value of 5.6 mmol/L (Figure 1).
This shows subjects with low pre-study glucose levels typi-cally had increased FBG while those with higher levels had reductions in FBG.
Discussion
This study investigated changes in FBG in apparently healthy but insufficiently active adults following an intensive PA intervention. There was no change in the mean FBG fol-lowing 40 days of daily activity. This general response has also been found by others following physical activity inter-ventions with sedentary adult participants.24,25 For example,
Slentz et al25 found that 8 months of exercise training in
groups undertaking moderate- or vigorous-intensity activity resulted in no significant change in FBG despite improved insulin sensitivity in both groups. Ross et al24 also found no
change in FBG in groups undergoing 14-week exercise and/or diet interventions, despite significant increases in insulin sensitivity. This appears somewhat paradoxical given the significant long-term associations previously found between high FBG, and disease and mortality rates.11
Although there was no change in mean FBG, regression analysis indicated there was an increase in FBG for those with lower baseline values and a decrease in FBG among those with higher baseline FBG. It appears that for some people, a sedentary lifestyle is associated with a reduced FBG set point rather than the typical elevation in FBG. Figure 1 illus-trates this FBG pattern (,5.0 mmol/L) for 12.5% (n = 72) of the subjects in the present study.
The body’s response to PA training is well documented and involves the upregulation of glucose control. In the pres-ent study of a cross section of apparpres-ently healthy but sedpres-entary adults, this was reflected in tighter FBG levels around a mean value of 5.6 mmol/L. Following the daily exercise interven-tion, those participants with low baseline FBG values showed a rise in FBG. The characteristic pattern of decreased FBG values was seen among those with higher baseline FBG.
Table 1 Participant descriptive statistics pre- and postintervention
Group intervention (n = 372)
Pedometer intervention (n = 203)
Preintervention Postintervention Preintervention Postintervention
Age (years) 36.8 (12.8)* 40.7 (12.4)
Sex (% female) 71 74
PA (min/wk)† 68 (45) 744 (467)# 71 (47) 435 (363)#
BMi 26.6 (5.3) 26.4 (5.1)# 26.5 (5.6) 26.4 (5.5)
FBG (mmol/L) 5.57 (0.61) 5.55 (0.60) 5.65 (0.85) 5.65 (0.85)
VO2max (mL/kg/min) 27.3 (6.4) 31.6 (7.5)# 27.2 (6.8) 28.6 (8.2)#
Notes:†Vigorous intensity minutes are weighted ×2; values are expressed as mean (±SD); *significant preintervention group difference; #significant pre–post within-intervention difference.
Abbreviations: PA, physical activity; BMi, body mass index; FBG, fasting blood glucose; VO2max , maximal oxygen uptake; SD, standard deviation.
Dovepress Exercise training improves fasting glucose control
Open Access Journal of Sports Medicine downloaded from https://www.dovepress.com/ by 118.70.13.36 on 26-Aug-2020
Jenkins and Hagberg23 reported elevated FBG in
normo-glycemic participants following a 6-month exercise program while at the same time, prediabetic participants decreased
their FBG. In the HERITAGE20 study, following a 5-month
endurance training program, there was an increase in FBG. Additionally, a decreased insulin response to intravenous glucose was reported in the quartile with the highest base-line glucose tolerance, compared with the increased insulin response in those with the lowest glucose tolerance. Overall, these studies highlight the complex nature of metabolic con-trol and suggest different mechanisms may be operating as part of the upregulation of glucose homeostasis following exercise training.
Regulation of BG is a complex neuroendocrine process with numerous organs involved.9,33 A sedentary lifestyle and
poor diet are typically associated with a downregulation or decreased sensitivity of insulin and other hormones associ-ated with glucose control. For example, the blunted insulin-suppression response by the pancreas in response to increased hepatic glucose production is characteristic of type 2 diabetics and contributes to hyperglycemia.34 Additionally, hepatocyte
sensitivity of both insulin and glucagon receptors decrease,12
and a decreased glucagon receptor density has also been reported in animal studies involving low activity and/or high fat diets.35 There is also a decreased sensitivity to insulin
in adipocyctes and myocytes12 and an increased incretin
hormone secretion from the small intestine in response to ingested nutrients in those with obesity, impaired glucose tolerance (IGT), or type 2 diabetes.36 Furthermore, blunted
central nervous system secretion, sensing, or responsiveness to afferent signals (such as leptin and insulin levels) are asso-ciated with insulin resistance,14 and cardiovascular autonomic
dysfunction has been shown in persons with impaired glucose tolerance and central obesity.37
On the other hand, there is evidence that all of these altered regulatory steps can be improved with both acute and regular exercise training.5,38 Exercise acutely increases
muscle glucose transport, which is mediated by an increase in the glucose transporter 4 (GLUT4) in skeletal muscle mem-brane and t-tubules.10,21 Following exercise, it is replaced by
an increase in insulin sensitivity.39 Muscle GLUT4 content
increases in humans within 7–10 days of training, although these short-term effects wear off within about 72 hours after the last exercise bout.40,41 Exercise training has also been
shown to reverse impaired insulin sensitivity such that for a given insulin load, there is a reduced endogenous glucose pro-duction and tighter regulation of blood glucose homeostasis.21
The liver also adapts to exercise-related physiological stress through modulation of glucagon receptor binding char-acteristics to enhance glucose production responsiveness to glucagon stimulus.42,43 Furthermore, chronic endurance
exercise has been shown to induce adaptations in pancreatic
β-cells, leading to a reduction in glucose-induced insulin secretion.25 Both caloric restriction and exercise were shown
to reduce the incretin response to ingested glucose, sug-gesting glucose-dependent insulinotropic polypeptide may mediate the attenuated glucose-stimulated insulin response after exercise and/or diet interventions.36 Beneficial effects in
reflectory autonomic regulation and glucose control have also been found in both humans37 and animal exercise studies.44
Overall, it is possible the increased PA in the previously sedentary participants altered a range of metabolic pathways that help control BG. For those who regulated at a low FBG, this may have involved any number of possible alterations. Although speculative, these may include increased hepatic glucagon receptor sensitivity, a decreased insulin secretion, or better control of gluconeogenesis. These alterations may operate differently in those who regulate at a higher FBG. Moreover, the alterations may have occurred independently or synergistically and may have also involved more than just the pancreas or liver (for example, muscle and adipocyte changes), particularly given the association between weight loss and changes in FBG. From a clinical perspective, it is still an important variable to be measured routinely by individu-als seeking to regulate their metabolic control. However, as a general marker of the impact of intervention strategies on glucose variability, it has poor resolution for similar cross-sectional nondiabetic populations.
There are several limitations of this study. The measures of FBG have a reasonable level of day-to-day variability,
0 2 3 4
1
−1 −2 −3 −4 −5
2 4 6 8
Preintervention FBG (mmol/L)
Change in FBG (mmol/L
)
14 10 12
Figure 1 Theregression plot for the changes in participants’ FBG versus baseline level of FBG.
Notes: y = 2.623− 0.471 × x; r = 0.472; P, 0.0001.
Abbreviation: FBG,fasting blood glucose.
Dovepress
Norton et al
Open Access Journal of Sports Medicine downloaded from https://www.dovepress.com/ by 118.70.13.36 on 26-Aug-2020
as shown by prestudy CV values. The FBG measures were undertaken without controlling for physical activity over the previous several days. Acute changes in glucose control have been shown following PA; however, the influence of this on the participant pool is likely to be randomly distributed. There was a small difference in age between the two intervention arms; however, regression analysis showed no association between changes in FBG levels and age. The exclusion of the eight participants with very low FBG values made no difference to the results of this study.
This study has shown a pattern of exercise-induced changes in FBG that operates differently at different ends of the preintervention FBG spectrum. The specific mechanisms that are responsible for these changes cannot be determined, but other research has indicated that any one or more of the numerous regulatory steps outlined may be involved. However, what has previously been shown is that, like those with higher FBG, people with lower FBG may also be at an increased risk of mortality.11
Acknowledgments
This research was funded by grants from the Australian Research Council and the South Australian Department of Health. Appreciation is expressed to the subjects and research students for their support.
Disclosure
The authors report no conflicts of interest in this work.
References
1. Frier BM, Schernthaner G, Heller SR. Hypoglycemia and cardiovascular risks. Diabetes Care. 2011;34 Supplement 2:S132–S137.
2. American Diabetes Association (ADA). Diagnosis and classification of diabetes mellitus. Diabetes Care. 2011;34 Supplement 1:S62–S69. 3. World Health Organization. Obesity and Overweight:Fact Sheet No 311.
Geneva: World Health Organization; 2012. Available from: http://www. who.int/mediacentre/factsheets/fs311/en/. Accessed July 10, 2012. 4. World Health Organization. Diabetes:Fact Sheet No312. Geneva:
World Health Organization; 2011. Available from: http://www.who.int/ mediacentre/factsheets/fs312/en/. Accessed July 10, 2012.
5. Colberg SR, Sigal RJ, Fernhall B, et al. Exercise and type 2 diabetes. The American College of Sports Medicine and the American Diabetes Association: joint position statement. Diabetes Care. 2010; 33(12):e147–e167.
6. Wadden TA, Webb VL, Moran CH, Bailer BA. Lifestyle modification for obesity: new developments in diet, physical activity, and behavior therapy. Circulation. 2012;125(9):1157–1170.
7. World Health Organization. Screening for Type 2 Diabetes. Geneva: World Health Organization; 2003. Available from: http://www.who.int/ diabetes/currentpublications/en/. Accessed October 17, 2012. 8. Munsters M, Saris WH. Effect of meal frequency on metabolic profiles
and substrate partitioning in lean healthy males. PLoS ONE. 2012; 7(6):e38632.
9. Aronoff SL, Berkowitz K, Shreiner B, Want L. Glucose metabolism and regulation: beyond insulin and glucagon. Diabetes Spectrum. 2004;17(3):183–190.
10. Jensen TE, Richter EA. Regulation of glucose and glycogen metabolism during and after exercise. J Physiol. 2012;590(Pt 5):1069–1076. 11. Emerging Risk Factors Collaboration, Sarwar N, Gao P, Seshasai SR,
et al. Diabetes mellitus, fasting blood glucose concentration, and risk of vascular disease: a collaborative meta-analysis of 102 prospective studies. Lancet. 2010;375(9733):2215–2222.
12. Sell H, Dietze-Schroeder D, Eckel J. The adipocyte-myocyte axis in insulin resistance. Trends Endocrinol Metab. 2006;17(10):416–422. 13. Ryan AS. Insulin resistance with aging: effects of diet and exercise.
Sports Med. 2000;30(5):327–346.
14. Morton GJ, Schwartz MW. Leptin and the central nervous system control of glucose metabolism. Physiol Rev. 2011;91(2):389–411.
15. Bjørnholt JV, Eriksen G, Aaser E, et al. Fasting blood glucose: an underestimated risk factor for cardiovascular death. Results from a 22-year follow-up of healthy nondiabetic men. Diabetes Care. 1999;22(1):45–49.
16. Lawes CM, Parag V, Bennett DA, et al; Asia Pacific Cohort Studies Collaboration. Blood glucose and risk of cardiovascular disease in the Asia Pacific region. Diabetes Care. 2004;27(12):2836–2842. 17. Goodyear LJ, Kahn BB. Exercise, glucose transport, and insulin
sensitivity. Annu Rev Med. 1998;49:235–261.
18. Samaha F, Iqbal N, Seshadri P, et al. A low-carbohydrate as compared with a low-fat diet in severe obesity. New Engl J Med. 2003;348(21): 2074–2081.
19. Shai I, Schwarzfuchs D, Henkin Y, et al; Dietary Intervention Randomized Controlled Trial (DIRECT) Group. Weight loss with a low-carbohydrate, Mediterranean, or low-fat diet. N Engl J Med. 2008;359(3):229–241.
20. Boulé NG, Weisnagel SJ, Lakka TA, et al. Effects of exercise training on glucose homeostasis: the HERITAGE family study. Diabetes Care. 2005;28(1):108–114.
21. Kirwan JP, Solomon TP, Wojta DM, Staten MA, Holloszy JO. Effects of 7 days of exercise training on insulin sensitivity and responsive-ness in type 2 diabetes mellitus. Am J Physiol Endocrinol Metab. 2009;297(1):e151–e156.
22. Trovati M, Carta Q, Cavalot F, et al. Influence of physical training on blood glucose control, glucose tolerance, insulin secretion, and insu-lin action in non-insuinsu-lin-dependent diabetic patients. Diabetes Care. 1984;7(5):416–420.
23. Jenkins NT, Hagberg JM. Aerobic training effects on glucose tolerance in prediabetic and normoglycemic humans. Med Sci Sports Exerc. 2011;43(12):2231–2240.
24. Ross R, Janssen I, Dawson J, et al. Exercise-induced reduction in obesity and insulin resistance in women: a randomized controlled trial. Obes Res. 2004;12(5):789–798.
25. Slentz CA, Tanner CJ, Bateman LA, et al. Effects of exercise training intensity on pancreatic β-cell function. Diabetes Care. 2009;32(10):1807–1811.
26. Norton LH, Norton KI, Lewis N, Dollman J. A comparison of two short-term intensive physical activity interventions: methodological considerations. Int J Behav Nutr Phys Act. 2011;8:133.
27. AIHW Australian Institute of Health and Welfare. The Active Australia Survey:A Guide and Manual for Implementation,Analysis and Reporting. Canberra: Australian Institute of Health and Wel-fare; 2003. Available from: http://www.aihw.gov.au/publication-detail/?id=6442467449. Accessed October 17, 2012.
28. Sports Medicine Australia. Sports Medicine Australia (SMA) Pre-Exercise Screening System 2005. Canberra: Sports Medicine Australia; 2005. Available from: http://sma.org.au/wp-content/uploads/2009/05/ new_pre_screening.pdf. Accessed July 15, 2012.
29. Norton K, Olds T. Anthropometrica. Sydney: UNSW Press; 2000. 30. Pickering TG, Hall JE, Appel LJ, et al. Recommendations for blood
pressure measurement in humans and experimental animals: part 1: blood pressure measurement in humans: a statement for professionals from the Subcommittee of Professional and Public Education of the American Heart Association Council on High Blood Pressure Research. Circulation. 2005;111(5):697–716.
Dovepress Exercise training improves fasting glucose control
Open Access Journal of Sports Medicine downloaded from https://www.dovepress.com/ by 118.70.13.36 on 26-Aug-2020
Open Access Journal of Sports Medicine
Publish your work in this journal
Submit your manuscript here: http://www.dovepress.com/open-access-journal-of-sports-medicine-journal Open Access Journal of Sports Medicine is an international,
peer-reviewed, open access journal publishing original research, reports, reviews and commentaries on all areas of sports medicine. The manuscript management system is completely online and includes a very quick and fair peer-review system.
Visit http://www.dovepress.com/testimonials.php to read real quotes from published authors.
31. DASET Department of the Arts, Sport, the Environment and Territories. Pilot Survey of the Fitness of Australians. Canberra: Australian Govern-ment Publishing Service; 1992.
32. Bachorik PS, Bradford RH, Cole T, et al. Accuracy and precision of analyses for total cholesterol as measured with the Reflotron cholesterol method. Clin Chem. 1989;35(8):1734–1739.
33. Kalsbeek A, Bruinstroop E, Yi CX, Klieverik LP, La Fleur SE, Fliers E. Hypothalamic control of energy metabolism via the autonomic nervous system. Ann N Y Acad Sci. 2010;1212:114–129.
34. Basu R, Chandramouli V, Dicke B, Landau B, Rizza R. Obesity and type 2 diabetes impair insulin-induced suppression of glycogenolysis as well as gluconeogenesis. Diabetes. 2005;54(7):1942–1948. 35. Charbonneau A, Melancon A, Lavoie C, Lavoie JM. Alterations in
hepatic glucagon receptor density and in Gsalpha and Gialpha2 protein content with diet-induced hepatic steatosis: effects of acute exercise. Am J Physiol Endocrinol Metab. 2005;289(1):e8–e14.
36. Kelly KR, Brooks LM, Solomon TP, Kashyap SR, O’Leary VB, Kirwan JP. The glucose-dependent insulinotropic polypeptide and glucose-stimulated insulin response to exercise training and diet in obesity. Am J Physiol Endocrinol Metab. 2009;296(6):e1269–e1274. 37. Laitinen T, Lindström J, Eriksson J, et al. Cardiovascular autonomic
dysfunction is associated with central obesity in persons with impaired glucose tolerance. Diabet Med. 2011;28(6):699–704.
38. Drouin R, Lavoie C, Bourque J, Ducros F, Poisson D, Chiasson JL. Increased hepatic glucose production response to glucagon in trained subjects. Am J Physiol. 1998;274(1 Pt 1):e23–e28.
39. Holloszy JO. Exercise-induced increase in muscle insulin sensitivity. J Appl Physiol. 2005;99(1):338–343.
40. Short KR, Vittone JL, Bigelow ML, et al. Impact of aerobic exercise training on age-related changes in insulin sensitivity and muscle oxida-tive capacity. Diabetes. 2003;52(8):1888–1896.
41. Venables MC, Shaw CS, Jeukendrup AE, Wagenmakers AJ. Effect of acute exercise on glucose tolerance following post-exercise feeding. Eur J Appl Physiol. 2007;100(6):711–717.
42. Lavoie C. Glucagon receptors: effect of exercise and fasting. Can J Appl Physiol. 2005;30(3):313–327.
43. Podolin DA, Wills BK, Wood IO, Lopez M, Mazzeo RS, Roth DA. Attenuation of age-related declines in glucagon-mediated signal transduction in rat liver by exercise training. Am J Physiol Endocrinol Metab. 2001;281(3):e516–e523.
44. Jorge L, da Pureza DY, da Silva Dias D, Conti FF, Irigoyen MC, De Angelis K. Dynamic aerobic exercise induces baroreflex improve-ment in diabetic rats. Exp Diabetes Res. 2012;2012:108680.
Dovepress
Dove
press
Norton et al
Open Access Journal of Sports Medicine downloaded from https://www.dovepress.com/ by 118.70.13.36 on 26-Aug-2020