ISSN(Online): 2320-9801
ISSN (Print): 2320-9798
I
nternational
J
ournal of
I
nnovative
R
esearch in
C
omputer
and
C
ommunication
E
ngineering
(An ISO 3297: 2007 Certified Organization)
Vol. 2, Issue 12, December 2014
Brain Tumour Detection through MRI Image
Using Segmented Morphological Approach
N.Nandhagopal1, B.Senthilraja2, P.Vinayagam3
Associate Professor, Department of Electronics and Communication Engineering, SKP Engineering College
Tiruvannamalai, Tamilnadu, India1
Assistant Professor, Department of Electronics and Communication Engineering, SKP Engineering College
Tiruvannamalai, Tamilnadu, India2, 3
ABSTRACT: A New method for deformable registration of brain MRI scans of glioma patients through Affine Transformation. We are able to detect and segment tumour in the brain. It segments tumour, resection cavity, and recurrence based on models specific to each scan. Firstly we have used some image enhancement techniques to enhance the contrast and normalize the pixel values in the image. we apply AFFLINE TRANSFORMATION after that we have applied some morphological operations to get the desiredresults.
KEYWORDS: Black Box, E-CrashCorder , GPS, GSM ,ECU.
I. INTRODUCTION
Digital image processing uses algorithms to perform image processing on digital images. As a subfield of digital signal processing, digital image processing has many advantages over analog image processing; it allows a much wider range of algorithms to be applied to the input data, and can avoid problems such as the build-up of noise and signal distortion during processing. An image may be defined as a two-dimensional function, f(x, y), where x and y are spatial coordinates, and the amplitude of f at any pair of coordinates (x, y) is called the gray level or intensity of the image at that point. When x, y and the amplitude values of are finite, discrete quantities, we call the image a digital image. The field of digital image processing refers to processing digital images by means of a digital computer. Note that a digital image is composed by a finite number of elements, which everyone has a particular location and value. These elements are referred as picture elements, image elements, pels, and pixels. Pixel is the term most widely used to denote the elements of a digital image. The intent of classification process is to categorize all pixels in a digital image into one of several land cover classes or themes. This classified data may be used to produce thematic maps of the land cover present in an image. Pictures are the most common and convenient means of conveying or transmitting information. A picture is worth a thousand words. Pictures concisely convey information about positions, sizes and inter-relationships between objects. They portray spatial information that we can recognize as objects.
ISSN(Online): 2320-9801
ISSN (Print): 2320-9798
I
nternational
J
ournal of
I
nnovative
R
esearch in
C
omputer
and
C
ommunication
E
ngineering
(An ISO 3297: 2007 Certified Organization)
Vol. 2, Issue 12, December 2014
due to the development of digital image processing. Specialized computer programs are used to enhance and correct images.
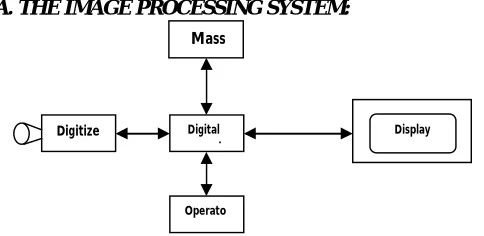
A. THE IMAGE PROCESSING SYSTEM:
FIG 1.1: BLOCK DIAGRAM FOR IMAGE PROCESSING SYSTEM
DIGITIZER
Digitizing or digitization is the representation of an object, image, sound, document or a signal (usually an analog signal) by a discrete set of its points or samples. Digital information exists as one of two digits, either 0 or 1. These are known as bits. An image is digitized to convert it to a form which can be stored in a computer's memory or on some form of storage media such as a hard disk or CD-ROM. This digitization procedure can be done by a scanner, or by a video camera connected to a frame grabber board in a computer. Once the image has been digitized, it can be operated upon by various image processing operations.
Microdensitometer
Flying spot scanner
Image dissector
Videocon camera
Photosensitive solid- state arrays.
DIGITAL COMPUTER:
A computer is an electronic device that accepts raw data, processes it according to a set of instructions and required to produce the desired result. Mathematical processing of the digitized image such as convolution, averaging, addition, subtraction, etc. are done by the computer.
MASS STORAGE
Mass storage devices used in desktop and most server computers typically have their data organized in a file system. The secondary storage devices normally used are floppy disks, CD ROMs etc.
OPERATOR CONSOLE
The operator console consists of equipment and arrangements for verification of intermediate results and for alterations in the software as and when require. The operator is also capable of checking for any resulting errors and for the entry of requisite data.
DISPLAY
Popular display devices produce spots (display elements) for each pixel:
Cathode ray tubes (CRTs).
Liquid crystal displays (LCDs).
Printers.
Spots may be binary (e.g., monochrome LCD), achromatic (e.g., so-called black-and-white, actually grayscale for intensity), pseudo color or false colors (e.g., for intensity or hyper spectral data), or true color (color data displayed as such).
Digitize r
Operato r Digital comput
ISSN(Online): 2320-9801
ISSN (Print): 2320-9798
I
nternational
J
ournal of
I
nnovative
R
esearch in
C
omputer
and
C
ommunication
E
ngineering
(An ISO 3297: 2007 Certified Organization)
Vol. 2, Issue 12, December 2014
IMAGE TYPES:
For photographic purposes, there are two important types of digital images: color and grayscale. Color images are made up of colored pixels while grayscale images are made of pixels in different shades of gray
Grayscale Images
A grayscale image is made up of pixels, each of which holds a single number corresponding to the gray level of the image at a particular location. These gray levels span the full range from black to white in a series of very fine steps, normally 256 different grays. Assuming 256 gray levels, each black and white pixel can be stored in a single byte (8 bits) of memory.
2.2.1 grayscale image
Color Images
A color image is made up of pixels, each of which holds three numbers corresponding to the red, green and blue levels of the image at a particular location. Assuming 256 levels, each color pixel can be stored in three bytes (24 bits) of memory. Note that for images of the same size, a black & white version will use three times less memory than a color version.
2.2.2 color image
Binary Images
Binary images use only a single bit to represent each pixel. Since a bit can only exist in two states- ON or OFF, every pixel in a binary image must be one of two colors, usually black or white. This inability to represent intermediate shades of gray is what limits their usefulness in dealing with photographic images.
FUNDAMENTAL IN DIGITAL IMAGE PROCESSING:
The various basic steps are as follows
1. Image Acquisition 2. Image preprocessing 3. Image segmentation
4. Image Representation and Description 5. Image Recognition and Interpretation and 6. Knowledge base.
Image Acquisition:
ISSN(Online): 2320-9801
ISSN (Print): 2320-9798
I
nternational
J
ournal of
I
nnovative
R
esearch in
C
omputer
and
C
ommunication
E
ngineering
(An ISO 3297: 2007 Certified Organization)
Vol. 2, Issue 12, December 2014
Fundamental steps in digital image processing
II. IMAGE SEGMENTATION
The next stage deals with segmentation. Segmentation partitions an input image into its small constituent parts or objects. In general, autonomous segmentation is one of the most difficult tasks in digital image processing. On the one hand, a rugged segmentation procedure brings the process a long way towards the successful solution of an imaging problem. On the other hand, weak or erratic segmentation algorithms almost guarantee eventual failure. In terms of character recognition, the key role of segmentation is to extract individual characters and words from the background.
FEATURE EXTRACTION
Feature extraction involves simplifying the amount of resources required to describe a large set of data accurately. When performing analysis of complex data one of the major problems stems from the number of variables involved. Analysis with a large number of variables generally requires a large amount of memory and computation power or a classification algorithm which over fits the training sample and generalizes poorly to new samples. Feature extraction is a general term for methods of constructing combinations of the variables to get around these problems while still describing the data with sufficient accuracy.
Image Representation and Description:
The output of the segmentation stage usually is raw pixel data, constituting either the boundary of a region or all the points in the region itself. In either case converting the data to a form suitable for computer processing is necessary. The first decision that must be made, whether the data should be represented as a boundary or as a complete region. Boundary representation is appropriate when the focus is on external shape characteristics, such as corners and inflections. Regional representation is appropriate when the focus is on internal properties, such as texture or skeletal shape. In some applications, however, these representations coexist. This situation occurs in character recognition applications, which often require algorithms based on boundary shape as well as skeletons and other internal properties.
Image Recognition and Interpretation:
Recognition is the process that assigns a label to an object based on the information provided by its descriptors. Interpretation involves assigning meaning to an ensemble of recognized objects. For example, identifying a character as, say, c requires associating the descriptors for that character with the label c. Interpretation attempts to assign meaning to a set of labeled entities. For example, a string of five numbers are followed by a hyphen and four more numbers can be interpreted to be a ZIP code.
Knowledge Base:
ISSN(Online): 2320-9801
ISSN (Print): 2320-9798
I
nternational
J
ournal of
I
nnovative
R
esearch in
C
omputer
and
C
ommunication
E
ngineering
(An ISO 3297: 2007 Certified Organization)
Vol. 2, Issue 12, December 2014
change-detection applications. In addition to guiding the operation of each processing module, the knowledge base also controls the interaction between modules.
APPLICATIONS OF IMAGE PROCESSING
Image processing has an enormous range of applications; almost every area of science and technology can make use of image processing methods. Here is a short list just to give some indication of the range of image processing applications.
MEDICINE:
Inspection and interpretation of images obtained from X-rays, MRI or CAT scans, analysis of cell images, of chromosome karyotypes. In medical applications, one is concerned with processing of chest X-rays, cineangiograms, projection images of transaxial tomography and other medical images that occur in radiology, nuclear magnetic resonance (NMR) and ultrasonic scanning. These images may be used for patient screening and monitoring or for detection of tumors’ or other disease in patients.
AGRICULTURE:
Satellite/aerial views of land, for example to determine how much land is being used for different purposes, or to investigate the suitability of different regions for different crops, inspection of fruit and vegetables distinguishing good and fresh produce from old.
DOCUMENT PROCESSING:
It is used in scanning, and transmission for converting paper documents to a digital image form, compressing the image, and storing it on magnetic tape. It is also used in document reading for automatically detecting and recognizing printed characteristics.
RADAR IMAGING SYSTEM:
Radar and sonar images are used for detection and recognition of various types of targets or in guidance and maneuvering of aircraft or missile systems.
DEFENSE/INTELLIGENCE:
It is used in reconnaissance photo-interpretation for automatic interpretation of earth satellite imagery to look for sensitive targets or military threats and target acquisition and guidance for recognizing and tracking targets in real-time smart-bomb and missile-guidance systems.
III. LITERATURE SURVEY
EXISTING SYSTEM:
Author Summary Proposed
Techniqe
Algorithm used
Benefits Identified Problems
Kovacevic (1997)
CT image Segmentation
Receptive field Radial basis function on neural network
Training Algorithm is relatively simple as compared to the back-propagation iterative algorithm used with MLP.
The proposed algorithm does not
perform well on trained data.
Zhang (2001)
Segmentation of brain MR images
Segmentation of brain MR images
Expectation Maximization
Technique possesses ability to encode
both spatial and statistical properties of an image.
The method requires estimating
ISSN(Online): 2320-9801
ISSN (Print): 2320-9798
I
nternational
J
ournal of
I
nnovative
R
esearch in
C
omputer
and
C
ommunication
E
ngineering
(An ISO 3297: 2007 Certified Organization)
Vol. 2, Issue 12, December 2014
The proposed framework employs unsupervised
classification using iterative updating.
nature. This method does not
produce accurate results most of
the time and is computationally expensive. Ahmed (2002) MRI data Segmentation Bias field Estimation Modified Fuzzy C-Mean
BCFCM algorithm is faster to converge to generate accurate classification.
Technique is limited to a single.
Feature input.
Incorporation of Spatial constraints into The classification blurs some fine details. Tolba (2003) MR image segmentation Gaussian Multi- resolution Analysis Expectation Maximization
Methodology is lesser sensitive to noise and utilizes strong spatial correlation
between neighbouring pixels. Expectation Maximization Shi1 (2009) Medical image processing Neural Network Expectation Maximization
The study offers a comprehensive
review of the paper published before
1992.
A review paper
Roy (2012)
Symmetry Modular solve MRI
segmentation
Symmetry The proposed can identify the status of quantitative analysis.
MRI segmentation is one of the
butisboringandtime consuming. Visual study of MRI is generally more interesting and fast. PROPOSED SYSTEM: Proposed Method Affine Transformation Enhancement, Pre process, Features. Affine Transformation Registration process is easy to apply. Extraction will done efficiency
ISSN(Online): 2320-9801
ISSN (Print): 2320-9798
I
nternational
J
ournal of
I
nnovative
R
esearch in
C
omputer
and
C
ommunication
E
ngineering
(An ISO 3297: 2007 Certified Organization)
Vol. 2, Issue 12, December 2014
IV. SOFTWARE IMPLEMENTATION
MATLAB (matrix laboratory) is a numerical computing environment and fourth-generation programming language. Developed by Math Works, MATLAB allows matrix manipulations, plotting of functions and data, implementation of algorithms, creation of user interfaces, and interfacing with programs written in other languages, including C, C++, Java, and Fortran. Although MATLAB is intended primarily for numerical computing, an optional toolbox uses the MuPAD symbolic engine, allowing access to symbolic computing capabilities. An additional package, Simulink, adds graphical multi-domain simulation and Model-Based Design for dynamic and embedded systems. In 2004, MATLAB had around one million users across industry and academia. MATLAB users come from various backgrounds of engineering, science, and economics. MATLAB is widely used in academic and research institutions as well as industrial enterprises. MATLAB was first adopted by researchers and practitioners in control engineering, Little's specialty, but quickly spread to many other domains. It is now also used in education, in particular the teaching of linear algebra and numerical analysis, and is popular amongst scientists involved in image processing. The MATLAB application is built around the MATLAB language. The simplest way to execute MATLAB code is to type it in the Command Window, which is one of the elements of the MATLAB Desktop. When code is entered in the Command Window, MATLAB can be used as an interactive mathematical shell. Sequences of commands can be saved in a text file, typically using the MATLAB Editor, as a script or encapsulated into a function, extending the commands available. MATLAB provides a number of features for documenting and sharing your work. You can integrate your MATLAB code with other languages and applications, and distribute your MATLAB algorithms and applications.
Analyzing and Accessing Data:
MATLAB supports the entire data analysis process, from acquiring data from external devices and databases, through preprocessing, visualization, and numerical analysis, to producing presentation-quality output.
Data Analysis:
MATLAB provides interactive tools and command-line functions for data analysis operations, including:
Interpolating and decimating
Extracting sections of data, scaling, and averaging
Thresholding and smoothing
Correlation, Fourier analysis, and filtering
1-D peak, valley, and zero finding
Basic statistics and curve fitting
Matrix analysis
Data Access:
MATLAB is an efficient platform for accessing data from files, other applications, databases, and external devices. You can read data from popular file formats, such as Microsoft Excel; ASCII text or binary files; image, sound, and video files; and scientific files, such as HDF and HDF5. Low-level binary file I/O functions let you work with data files in any format. Additional functions let you read data from Web pages and XML.
Visualizing Data:
All the graphics features that are required to visualize engineering and scientific data are available in MATLAB. These include 2-D and 3-D plotting functions, 3-D volume visualization functions, tools for interactively creating plots, and the ability to export results to all popular graphics formats. You can customize plots by adding multiple axes; changing line colors and markers; adding annotation, Latex equations, and legends; and drawing shapes.
2-D Plotting:
Visualizing vectors of data with 2-D plotting functions that create:
Line, area, bar, and pie charts.
Direction and velocity plots.
ISSN(Online): 2320-9801
ISSN (Print): 2320-9798
I
nternational
J
ournal of
I
nnovative
R
esearch in
C
omputer
and
C
ommunication
E
ngineering
(An ISO 3297: 2007 Certified Organization)
Vol. 2, Issue 12, December 2014
Polygons and surfaces.
Scatter/bubble plots.
Animations.
3-D Plotting and Volume Visualization:
MATLAB provides functions for visualizing 2-D matrices, 3-D scalar, and 3-D vector data. You can use these functions to visualize and understand large, often complex, multidimensional data. Specifying plot characteristics, such as camera viewing angle, perspective, lighting effect, light source locations, and transparency.
3-D plotting functions include: Surface, contour, and mesh.
Image plots.
Cone, slice, stream, and isosurface.
Performing Numeric Computation:
MATLAB contains mathematical, statistical, and engineering functions to support all common engineering and science operations. These functions, developed by experts in mathematics, are the foundation of the MATLAB language. The core math functions use the LAPACK and BLAS linear algebra subroutine libraries and the FFTW Discrete Fourier Transform library. Because these processor-dependent libraries are optimized to the different platforms that MATLAB supports, they execute faster than the equivalent C or C++ code.
MATLAB provides the following types of functions for performing mathematical operations and analyzing data:
Matrix manipulation and linear algebra.
Polynomials and interpolation.
Fourier analysis and filtering.
Data analysis and statistics.
Optimization and numerical integration.
Ordinary differential equations (ODEs).
Partial differential equations (PDEs).
Sparse matrix operations.
V.BRAIN TUMOUR IDENTIFICATION
ISSN(Online): 2320-9801
ISSN (Print): 2320-9798
I
nternational
J
ournal of
I
nnovative
R
esearch in
C
omputer
and
C
ommunication
E
ngineering
(An ISO 3297: 2007 Certified Organization)
Vol. 2, Issue 12, December 2014
alternating between extracting the resection area and estimating deformations. However, it is difficult to estimate gross deformation on brain glioma scans by excluding the pathology. To take explicit account of the tumor region, approaches register tumor scans to a healthy brain template by simulating mass effects of the tumor on the template . Alternatively, generative models, such as Prastawa et al. and Menze et al. , inject a prior of the tumor into an atlas of a healthy population and segment the tumor by aligning this atlas to the scan. Gooya et al. extend this idea to non rigid registration by growing the tumor inside the atlas until the deformed atlas resembles the pathology and healthy tissue shown in the brain tumor scan. To the best of our knowledge, this paper proposes the first approach specifically targeted towards the registration of preoperative and post-recurrence glioma scans, called Pre-Operative and post-Recurrence brain Tumor Registration (PORTR). One could register an atlas to each scan individually, for example via , and then concatenate the corresponding registrations . However, this approach ignores the fact that the scans are from the same patient. It thus has to solve the much more difficult problem of registering an atlas of a healthy population to scans showing pathology. Alternatively, one can directly register the scans using state-of-the-art intensity- or feature- based registration methods . However, these approaches do not explicitly account for pathologies and therefore may produce unreasonable correspondences in these areas. PORTR instead makes use of the fact that both scans are from the same patient and explicitly models constraints enforced by the pathology in each scan. PORTR determines the optimal deformation between two scans by finding the minimum of an energy function, which is based on the concept of symmetric registration . This energy function is not only comprised of image-based correspondences and smoothness constraints as customary for other registration methods, but also includes pathological information. The pathological information is inferred from the results of two segment that are targeted to each scan. Specifically, we develop a new method for segmenting post-recurrence scans, which generally consist of resection cavities after brain surgery and multiple tumor recurrences. For the pre-operative scans, we adapt the segment by Gooya et al. to outline a single brain glioma which causes a large mass effect on healthy tissue. The resulting segmentations of both scans are a central component in the definition of the image and the shape-based correspondence terms within our symmetric registration framework. Determining the minimum within this framework is difficult as the function contains many local minima. We deal with these difficulties by combining discrete and continuous optimizations. The discrete optimization method finds the optimal solution in a coarse solution space. The continuous optimization method locally improves this solution in a finer solution space. We measure the accuracy of PORTR on 24 subjects. The results indicate that the proposed method outperforms Avants et al. and Ou et al. , two examples of the state-of-the-art in general-purpose registration methods.
In this paper we have developed an algorithm which is able to detect the tumor within the brain in images which are obtained through magnetic imaging resonance (MRI) or computed tomography (CT). The images which are obtained through these modalities are in a standard format that is digital imaging and communication for medicine (DICOM). This is a standard format for all the medical images. It was developed by the national electronic manufactures association. This standard format is mainly used for storing, printing and transmitting information in medical imaging. These images are taken and converted into grayscale images for pre-processing which include some of the imaging enhancement techniques and later on post processing which include morphological operations. Morphological operations here play the central part in the detection of the tumor. In image processing morphological operations are used for analyzing and segmentation of different patterns in an image. Therefore by using this algorithm we are able to segment the tumors and also we are able to clearly observe the shape of the tumors.
AFFINE TRANSFORM
An Affine map between two affine spaces is a map on the points that acts linearly on the vectors (that
is, the vectors between points of the space). In symbols, determines a linear transformation such that, for any pair
of points :
or
.
ISSN(Online): 2320-9801
ISSN (Print): 2320-9798
I
nternational
J
ournal of
I
nnovative
R
esearch in
C
omputer
and
C
ommunication
E
ngineering
(An ISO 3297: 2007 Certified Organization)
Vol. 2, Issue 12, December 2014
If an origin is chosen, and denotes its image , then this means that for any vector :
If an origin is also chosen, this can be decomposed as an affine transformation that
sends , namely
followed by the translation by a vector .
The conclusion is that, intuitively, consists of a translation and a linear map
Affine Transform Algorithm
function img2 = affine(img, r, sx, sy, a, b, xo, yo)
R = [cos(r) -sin(r) 0; sin(r) cos(r) 0; 0 0 1];
S = [sx a 0; b sy 0; 0 0 1];
T2 = [1 0 -xo; 0 1 -yo; 0 0 1];
T1 = [1 0 xo; 0 1 yo; 0 0 1];
A = T1*R*S*T2;
[h,w]=size(img);
[x,y] = meshgrid(1:h,1:w); x=x(:);
y=y(:);
XP = [x';y';ones(1,length(x))];
X = A*XP;
z = find(X(1,:)>w-1); X(1,z) = w-1;
z = find(X(1,:)<=1); X(1,z) = 1.5;
z= find(X(2,:)>h-1); X(2,z) = h-1;
ISSN(Online): 2320-9801
ISSN (Print): 2320-9798
I
nternational
J
ournal of
I
nnovative
R
esearch in
C
omputer
and
C
ommunication
E
ngineering
(An ISO 3297: 2007 Certified Organization)
Vol. 2, Issue 12, December 2014
X(2,z) = 1.5;
x = X(1,:); y = X(2,:);
alpha = x - floor(x); %calculate alphas and betas for each point beta = y - floor(y);
fx = floor(x); fy = floor(y);
inw = fy + (fx-1)*h; %create index for neighboring pixels ine = fy + fx*h;
isw = fy+1 + (fx-1)*h; ise = fy+1 + fx*h;
img2 = (1-alpha).*(1-beta).*img(inw) + ... %interpolate (1-alpha).*beta.*img(isw) + ...
alpha.*(1-beta).*img(ine) + ... alpha.*beta.*img(ise);
img2 = reshape(img2,h,w);
imagesc(img2);
BLOCK DIAGRAM:
Block diagram of Detection of Brain Tumor Through MRI Image Using Segmented Morphological Approach
5.3.2 Snapshot of typical MRI BRAIN image.
COMPUTER VISION-BASED WILDFIRE DETECTION:
ISSN(Online): 2320-9801
ISSN (Print): 2320-9798
I
nternational
J
ournal of
I
nnovative
R
esearch in
C
omputer
and
C
ommunication
E
ngineering
(An ISO 3297: 2007 Certified Organization)
Vol. 2, Issue 12, December 2014
area for possible wildfires. Furthermore, they can be used to monitor the progress of the fire from remote centres.The computer vision based method for wildfire detection is an application of EADF. Security guards have to work 24 h in remote location under difficult circumstances. They may simple get tired or leave the lookout tower for various reasons.Therefore, computer vision based video analysis systems capable of producing automatic fire alarms are necessary to help the security guards to reduce the average forest-fire detection time. The proposed active fusion algorithm can also be used in other supervised learning problems where classifiers combinations through feedback are required.
Approaches:
There are several approaches on automatic forest-fire detection in the literature. Some of the approaches are directed toward the detection of the flames using infrared and visible range cameras, and some others aim at detecting the smoke due to wildfire. There have been recent papers on sensor based fire detection. Infrared cameras and sensor based systems have the ability to capture the rise in temperature, however they are much more expensive compared with regular pan-tilt-zoom (PTZ) cameras. An intelligent space framework is described for indoor fire detection. However in our project an outdoor (forest) wildfire detection method is proposed. Watch towersare widely available in forests all around the world to detect wildfires. Surveillance cameras can be placed in these surveillance towers to monitor the surrounding forestall area for possible wildfires. Furthermore, they can be used to monitor the progress of the fire from remote centres. Cameras, once installed, operate at forest watch towers throughout the fire season for about six months which is mostly dry and sunny in Mediterranean region. It is usually not possible to view flames of a wildfire from a camera mounted on a forest watch tower unless the fire is very near to the tower. However, smoke rising up in the forest due to a fire is usually visible from long distances.
BUILDING BLOCKS OF AWILDFIRE DETECTION ALGORITHM:
A wildfire detection algorithm is developed to recognize the existence of wildfire smoke within the viewing range of the camera monitoring forestal areas.
The proposed wildfire smoke detection algorithm consists of five main sub algorithms: 1) Slow moving object detection in video;
2) Smoke-colored region detection;
3) Wavelet-transform-based region smoothness detection; 4) Shadow detection and elimination; and
5) Covariance-matrix-based classification with decision functions.
Computationally efficient sub algorithms are selected to realize a real-time wildfire detection system working in a standard PC. The decision functions are combined in a linear manner, and the weights are determined according to the weight update mechanism. Decision functions of sub-algorithms do not produce binary values, but they produce real numbers centered around zero for each incoming sample. If the number is positive (negative), then the individual algorithm decides that there is (not) smoke due to forest fire in the viewing range of the camera. Output values of decision functions express the confidence level of each sub-algorithm. The higher value, the more confident the algorithm.
Covariance Matrix Based Region Classification:
The fifth sub-algorithm deals with the classification of the smoke-colored moving regions. We first obtain a mask from the intersection of the first two sub-algorithms and use the obtained smoke-colored moving regions as the input to the fifth algorithm. The regions are passed as bounding boxes of the connected regions of the mask. A region covariance matrix consisting of discriminative features is calculated for each region.
The feature vector for each pixel can be represented as follows:
Zk=[zk(i)]T
Where zk(i) is the ith entry of the feature vector. This feature vector is used to calculate the 9 by 9 covariance matrix of
ISSN(Online): 2320-9801
ISSN (Print): 2320-9798
I
nternational
J
ournal of
I
nnovative
R
esearch in
C
omputer
and
C
ommunication
E
ngineering
(An ISO 3297: 2007 Certified Organization)
Vol. 2, Issue 12, December 2014
depend on the number of pixels in the region; it only depends on the number of features in zk. The decision function for
this sub-algorithm is defined as follows:
D5(x,n) = 2pR-1
Where 0 < pR < 1 is the estimated posterior probability that the region contains smoke. As pointed out earlier, the
decision results of five sub-algorithms D1, D2, D3, D4 , and D5 are linearly combined to reach a final decision on a given
pixel, whether it is a pixel of a smoke region or not. Morphological operations are applied to the detected pixels should be larger than a threshold to issue an alarm for the region. If false alarm is issued during the training phase, the oracle gives feedback to the algorithm by declaring a no-smoke decision value for the false-alarm region. Initially, equal weights are assigned to each sub-algorithm. There may be large variations between forestall areas, and substantial temporal changes may occur within the same forestall region. As a result the weights of the individual sub-algorithms will evolve in a dynamic manner over time.In real-time operating mode, the PTZ cameras are in continuous scan mode visiting predefined preset locations. In this mode, constant monitoring from the oracle can be relaxed by adjusting the weights for each preset once and then use the same weights for successive classifications.Since the main issue is to reduce false alarms, the weights can be updated when there is no smoke in the viewing range of each preset; after that, the system becomes autonomous. The cameras stop at each preset and run the detection algorithm for some time before moving to the next preset. By calculating separate weights for each preset, we are able to reduce false alarms.
VI. EXPERIMENT RESULTS
The proposed wildfire detection scheme with entropy – functional based active learning method is implemented on a PC and tested with forest surveillance recordings captured from cameras mounted on top of forest watch towers near Antalya and Mugla provinces in the Mediterranean region in Turkey.The weather is stable with sunny days throughout the entire summer in Mediterranean. If it happens to rain, there is no possibility of forest fire. The installed system successfully detected three forest fires in the summer of 2008. The system was also independently tested by the Regional Technology Clearing House of San Diego State University in California in April 2009, and it detected the test fire and did not produce any false alarms during the trials. The system also detected another forest fire in Cyprus in 2010.The software is currently being used in more than 60 forest watch towers in Turkey, Greece, and Cyprus. The proposed EADF strategy is compared with the ULP scheme proposed. The ULP adaptive filtering method is modified to the wildfire detection problem in an online learning framework. The EADF algorithm achieves convergence faster that the NLMS algorithm. The tracking performance of the EADF algorithm, which is better that the NLMS-based algorithm. One interesting result is the EADF-B and NLMS-B, which are the versions that use the block projection method developed for the case of infinite number of convex sets, usually produced more false alarms than the methods that do not use block projections. The algorithms that use adaptive fusion strategy significantly reduce the false-alarm rate of the system compared with the non-adaptive methods by integrating the feedback from the guard (oracle) into the decision mechanism within the active learning framework.
Algorithm 3:
The pseudocode for the universal predictor Universal Predictor (x,n)
For i= 1 to M do
l(y(x,n),Di(x,n)) = [y(x,n) – Di(x,n)]2
vi(n+1) = exp(1(1/2c)l(y(x,n)))/Σjexp(-1(1/2c)l(y(x,n),Dj(x,n)))
end for
ŷu(x,n) = Σivi(n)Di(x,n)
if ŷu(x,n) ≥ 0 then
return 1
else
return -1
ISSN(Online): 2320-9801
ISSN (Print): 2320-9798
I
nternational
J
ournal of
I
nnovative
R
esearch in
C
omputer
and
C
ommunication
E
ngineering
(An ISO 3297: 2007 Certified Organization)
Vol. 2, Issue 12, December 2014
Accuracy of Subalgorithms and EADF
SUCCESS RATES (%)
Data SVM
k-nn(k=4) NCC NLMS EADF Train 100.0 91.50 100.0 100.0 100.0 Test 94.03 97.35 91.39 98.01 98.01
The success rates of the proposed EADF and NLMS methods are both 98.01% which is higher than all the sub-algorithms. Both the e-projection based and orthogonal projection based algorithms converge to a solution in the intersection of the convex sets. It turns out that they both converge to the same solution in this particular case. This is possible when the intersection set of convex sets I small. The proposed EADf method is developed for real-time application in which data arrive sequentially.
MAIN MENU
REFERENCE IMAGE
CORRELATED IMAGE
ISSN(Online): 2320-9801
ISSN (Print): 2320-9798
I
nternational
J
ournal of
I
nnovative
R
esearch in
C
omputer
and
C
ommunication
E
ngineering
(An ISO 3297: 2007 Certified Organization)
Vol. 2, Issue 12, December 2014
THRESHOLDED IMAGE
TUMOUR POSITION
AFTER THRESHOLDING
OUTPUT
VII.CONCLUSION
ISSN(Online): 2320-9801
ISSN (Print): 2320-9798
I
nternational
J
ournal of
I
nnovative
R
esearch in
C
omputer
and
C
ommunication
E
ngineering
(An ISO 3297: 2007 Certified Organization)
Vol. 2, Issue 12, December 2014
fields on either scan, we used a symmetric formulation of our energy model comprised of image- and shape-based correspondences and smoothness constraints. We determined the optimal registration results by minimizing the energy function using a hybrid optimization strategy which takes advantages both of discrete and continuous optimizations. We compared our approach to state-of-the-art registration methods in registering pre-operative and post-recurrenceMR scans of 24 glioma patients.We quantitatively compared their outcome with respect to matching landmarks and segmentations, following up this comparison with visual inspection. In this comparison, our approach performed significantly better than the other registration methods.
REFERENCES
[1]Dongjin Kwon*, Marc Niethammer, Hamed Akbari, Michel Bilello, Christos Davatzikos and Kilian M. Pohl. “PORTR: Pre-Operative and Post-Recurrence, Brain Tumour Registration”, Vol. 33, No. 3,pp 651-667, March 2014
[2] S. J. Price, R. Jena, N. G. Burnet, T. A. Carpenter, J. D. Pickard, and J. H. Gillard, “Predicting patterns of glioma recurrence using diffusion tensor imaging,” Eur. Radiol., vol. 17, no. 7, pp. 1675–1684, 2007.
[3] R. Verma, E. I. Zacharaki, Y. Ou, H. Cai, S. Chawla, S.-K. Lee, E. R.Melhem, R. Wolf, and C. Davatzikos, “Multiparametric tissue characterizationof brain neoplasms and their recurrence using pattern classification
of MR images,” Acad. Radiol., vol. 15, no. 8, pp. 966–977, 2008.
[4] W.-D. Heiss, P. Raab, and H. Lanfermann, “Multimodality assessment of brain tumors and tumor recurrence,” J. Nucl. Med., vol. 52, no. 10, pp. 1585–1600, 2011.
[5] J. M. Provenzale, S. Mukundan, and D. P. Barboriak, “Diffusion- weighted and perfusion MR imaging for brain tumor characterization and assessment of treatment response,” Radiology, vol. 239, no. 3, pp. 632–649, 2006.
[6] R. C. Gonzalez, Digital image processing, 2009, Pearson Education.
[7] S. Roy, D. K. Bhattacharyya, Data mining techniques and its application in medical imagery, 2010, VDM Verlag.
[8] C. D. Good, I. S. Johnsrude, J. Ashbumer, R. N. Henson, K. Fristen, R. S. Frackowiak, "A voxel-based morphometric study of ageing in 465 normal adult human brains", Biomedical Imaging 2002. 5th IEEE EMBS International Summer School on, pp. 16, 2002.
[9] S. Xavierarockiaraj, K. Nithya, R. Maruni Devi, "Brain Tumor Detection Using Modified Histogram Thresholding-Quadrant Approach", Journal of Computer Applications (JCA), vol. 5, no. 1, pp. 21-25, 2012.
[10] ua-mei Chen, Pramod K. Varshney, "Mutual Information-Based CT-MR Brain Image Registration Using Generalized Partial Volume Joint Histogram Estimation", IEEE Transactions on Medical Imaging, vol. 22, no. 9, pp. 1111-1119, Sep. 2003.