*
Corresponding author: [email protected]
Using Flexibilities of E-Mobility in planning and operation of
electrical grid with grid-supporting charging infrastructure
Jonas Maasmann1,*, Stefan Kippelt2
1TU Dortmund University, Institute for Energy Systems, Energy Efficiency and Energy Economics, 44227 Dortmund, Germany 2ef.Ruhr GmbH, 44227 Dortmund, Germany
Abstract. This Research Approach shows how to use flexibilities of E-Mobility in planning and operation of electric grid with grid-supporting charging infrastructure. In the first part, we show how to deal with controlled and uncontrolled charging behavior during the planning of electrical grid. Therefore we show a tool for generating load curves and simultaneity factors and an example, how to use them for grid planning. The second part shows the concept of grid-supporting charging infrastructure, a simulation of the main functions and a feasible implementation in the Smart Grid Technology Lab of TU Dortmund University.
1 Motivation for grid-supporting
charging infrastructure
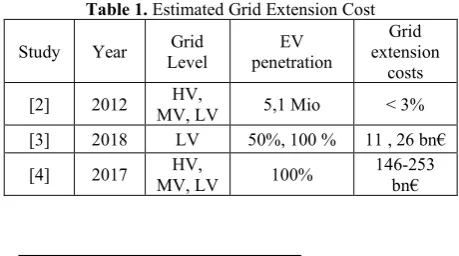
In order to achieve the international climate targets of the Paris Convention [1], fundamental changes in the energy supply of the mobility sector are necessary. For individual passenger traffic with cars, battery-powered or hydrogen-powered electric vehicles can make a significant contribution to CO2 reduction. In both cases, a supply of C02 neutral primary energy is required. Current studies assume a high rate of battery-powered electric vehicles (BEV). BEVs are supplied typically from the electrical grid with use case-oriented charging infrastructure. An increasing number of BEV therefore has a direct effect on electrical networks. Especially the distribution grids are faced with new challenges. Table 1 shows the estimated grid expansion costs of different studies for the German grid. They calculate costs between 11bn€ and 253bn€ for uncontrolled and uncoordinated charging of BEVs for different scenarios. Some of these studies also estimate a reduction of grid expansion costs due to controlled charging of BEVs. In this case, controlled charging means that the charging capacity is adapted to the available grid capacity. An adjustment of the charging power is possible by using the flexibilities of the charging time. This adjustment of the charging power we call grid-supporting charging, so that the technical equipment to handle this we name as grid-supporting charging infrastructure.
Table 1. Estimated Grid Extension Cost
Study Year Level Grid penetration EV
Grid extension
costs [2] 2012 MV, LV HV, 5,1 Mio < 3%
[3] 2018 LV 50%, 100 % 11 , 26 bn€
[4] 2017 MV, LV HV, 100% 146-253 bn€
The objective of this article is to investigate grid-supporting infrastructure, considering the following two main issues. The first question deals with the planning of electrical grids under consideration of BEVs with and without grid-supporting charging infrastructure. The second question looks for a technical concept, which implements it.
2 Evaluation the flexibilities of
E-Mobility - Controlled and
uncontrolled charging behavior
Ideally, precise knowledge of all loads and generators is required for an efficiency planning of electrical grids. Because this is not possible in reality, models and methods are necessary which estimate the loads as accurately as possible. Typically load curves are derived which have a high statistical accuracy for a high number of units. They are used for power flow calculation in overlaid grids, as example in case of charging BEV for planning medium voltage level and higher.The use of load-specific simultaneity factors is another method of planning electrical grids [5]. Here a maximum expected simultaneous load is calculated for a defined number of connection points.
2.1 Methods for generation of load curves and load-specific simultaneity factors
The planning process of low- and medium voltage grids and the realistic consideration of household loads could be observed throughout the past decades. Unlike the moderate changes in the load behavior of households in the past, the impact of electric vehicles is forecasted to be server and sudden. Despite the lack of sufficient experience and real data, electric vehicles have to be considered in the grid planning process event today. Hence, this planning must, at least in the first phase, be based on simulation of the expected charging behavior of electric vehicles.
The starting point of such simulation is in Germany, where a number of around 26,000 was surveyed and interviewed to their detailed mobility behavior (see fig 1).
Fig. 1. Tool for generation of load curves and simultaneity factors
On basis of the study’s raw data, statistical characteristics of the general usage of private cars where identified. In the last step, the according charging behavior of EV and general grid planning principles where identified. These steps are further explained in the following sections.
2.1.1 Generation of load curves
The changing behavior of EV is in the first place determined by the usage of the car. For a simplification, an EV can either be located at “home”, “work” or “elsewhere”. Based on the above study results, the probability of a chance between these three states (resp. a remaining in the previous state, see fig. 2) can be quantified. Naturally, these probabilities vary with the time of the day and the day of the week. Additionally, each change of state goes along with a distance covered, represented by a distribution function according to the study results.
Fig. 2. Locational states for EV
This model of the usage of privately-owned cars allows the simulation of a representative car usages over the course of time. Thus, it is possible to determine random
car behaviors, including the position of a car at a given time, the demand for charging energy and the available time for the charging process (determined by the following “trip” to a different state resp. location. This information is in the next step used for the determination of the required charging demand. Depending on the particularly examined use-case, a car can be charged at tall or only a selection of the regarded locations. E.g. for the analysis of domestic charging infrastructure, charging is only possible at the location “home”. Additionally, the charging process starts immediately after the arrival of the car a location where charging is possible. However, the information about the available flexibility within the charging process can already be determined from the beginning of the subsequent trip of the car.
2.1.2 Generation of simultaneity factors
For the development of general planning principles for distribution grids, the previous modelling approach is extended by means of a statistic analysis. The aim of this approach is the determination of simultaneity functions. These functions express maximum cumulative power of a given number of homogeneous loads. A well-known simultaneity function is e. g. used for the planning of low voltage grids in Germany an is expressed by the functions
𝑠
ℎℎ(𝑛) = 𝑐 +
1−𝑐𝑛
.
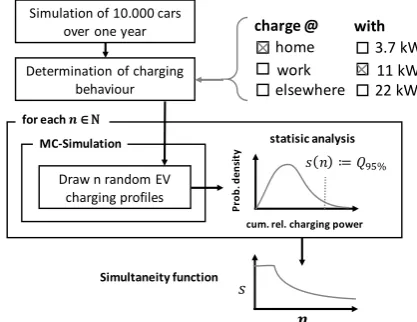
(1)For typical households (e.g. 𝑐 = 0.07), the planning of a connection line for a single household demands 100% of the connected load, whereas for 10 households, a cumulative power no bigger than 16% must be expected. In order to develop such functions, the following process is applied. In a first step, the previous modelling approach is applied in order to determine a large dataset of exemplary EV usages over the course of one year (10,000 has proven to deliver satisfyingly stable results). By the selection of the respectively regarded deployment site of the charging infrastructure as well as the regarded charging power, the charging behavior for each EV is calculated. These charging profiles serve as a pool for the following statistical analysis (see fig 3).
Fig. 3. Process for the determination of simultaneity functions
home
work where
else-1 else-1
1
1
Simulation of 10.000 cars
over one year
Determination of charging
behaviour
for each
MC-Simulation
Draw n random EV
charging profiles
statisic analysis
cum. rel. charging power
P
ro
b
. d
en
si
ty
𝑠 𝑛 home
work elsewhere charge @
Simultaneity function 𝑠
The subsequent statistical analysis is further performed for a number of 𝑛 vehicles: A number of 𝑛 profiles of the previous data pool is drawn and summed up. The maximum of this cumulative demand profile is further saved. This process is repeated 𝑀 times (1,000 MC-repetitions have been proven sufficient). From these 𝑀
observations of the maximum cumulative power, the 95%-quantile is determined. This value further determines the value of the desired simultaneity function at position 𝑛.
The following figure 4 shows two exemplary simultaneity functions for 11 kW charging stations. The high simultaneity of commuting employees leads to a slightly higher simultaneity that must be regarded in the planning of distribution grids. A more detailed description of this process can be found in [6] and [7].
Fig. 4. Simultaneity functions for charging infrastructure with a power of 11kW.
As previously mentioned, the available flexibility of the individual charging processes is already implicitly included in the generated data. However, the use of this flexibility (e.g. grid- or market-oriented) always depends on a external signal. This can be the overall grid loading, price signals or demand for ancillary services. Thus, the impact on the grid planning must always be determined for the individually regarded case and cannot be transferred to simple simultaneity functions. An exemplary case-study with market participation of EV and the resulting impact on the grid planning principles can be found in [7].
2.2 Results for example-use-cases
As example-use-cases for test the Tool for generation of load curves and simultaneity factors we define the tree use cases “arrival after last trip” of the day, “arrival at work” and “arrival after work”. “Arrival after last trip” means that the BEVs charge after the last at home and once a day. “Arrival at work” defines the use case of charging at work and “Arrival after work” defines a use case for commuters charging at home after work.
Figure 5 shows the probability of an arrival at a certain time. Additionally, the figure illustrates the derivate normalized load profile for a 3-7 kW and a 11kW charging proceed. The use case “Arrival after last trip” and “arrival after work” has a load peak around 18:00. The
use case “arrival at work” generates a load peak in the morning at 8:00.
Fig. 5. Probability density functions of arrival
2.3 Using the results for grid planning
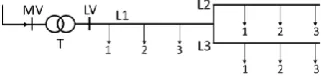
The results of simultaneity factors can directly be used for planning distribution grids. A simple example shows how to use the results in a typical grid structure. In this example, we plan estimate the maximum load of the grid devices with different planning approaches. Generally, all houses in the planning area get a charging infrastructure. Figure 6 shows the example low voltage grid to compare the calculation approaches.
Fig. 6. Example grid structure
The shown low voltage grid feeder has a feed in from the medium voltage with the transformer T. On low voltage side, a single line L1 is connected which split in the two lines L2 and L3. At all lines are three loads connected. The loads are three different living buildings. The three houses differ in the number of apartments. The configuration shows table 2. The residual load is planned as described in [5].
Table 2. Configuration of buildings
Type Apartments Number of Load [A] Residual Charging Points Number of
1 8 72 8
2 16 97 16
3 24 110 24
In the first two approaches, we plan the grid with a fix maximum charging power of 3.7kW and 11kW. In the third approach, the simultaneity factors used for grid 0
0.2 0.4 0.6 0.8 1
0 20 40 60 80 100
s
im
u
lt
a
n
e
it
y
s
(n
)
n (number of EV)
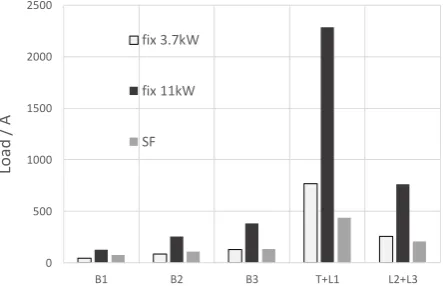
planning. The simultaneity factors are calculate for 11kW. The results for some critical grid devices are shown in figure 7. These values show the additional load for the electric vehicles. For all components, the planning approach with 11 kW fix charging power, has the highest needed current. The results for the building B1 – B3 shows that the planning approach with fix 3.7 kW and with simultaneity factors are very similar for the results, but on based on a charging power of 3.7 kW and the other of 11 kW. For the components lines and the transformer, the approach with simulations factors calculates the lowest needed current carrying capacity.
Fig. 7. Results for the different calculation approaches
Finally, the example calculation outline, that a calculation with simultaneity factors is a powerful tool to plan grid components exact on needs-based approach.
3 Grid-supporting charging
infrastructure for operation of
electrical grids
In order to implement the potential of flexibilities of E-Mobility for grid-supporting charging infrastructure assumed in planning purposes (chapter 2), technological concepts are necessary. There concepts must be consistent with the established control strategies of the grid operation. In addition, suitable algorithms are to be researched which meet the requirements of the grid and at the same time takes care of technological aspects and user needs. In order to show the feasibility of such concepts and to test possible algorithms, the concept has to implement and evaluate in an experimental setup.
3.1 Concept of grid-supporting charging
infrastructure
We defined for this concept of grid-supporting charging infrastructure different requirements. The main task is the safe and reliable supply of the electric vehicles with energy. Due to (temporal) restrictions in the electrical grid, which result from demand-oriented design, there are additional requirements of the grid. These requirements shout prevent critical grid conditions caused by loading EVs. Besides the grid, there are also requirements to the loading process. On the one hand, there are technical parameter like limitation of charging power and on the other hand, this concept of grid-supporting charging
infrastructure includes user requirements like maximum duration time. In order to meet these requirements, the concept is based on a multi-level control strategy [8]. Figure 8 shows the concept of the overall strategy.
Fig. 8. Concept of grid supporting charging infrastructure
Here we can see that a state-machine, which analyses the grid state, defines the input value for the concept. This value will be generate by the control system of the grid operator. A central SCADA system or a decentralized agent system can used as the system, which analyses and communicate the grid state. In our concept, the state value is defined as 3-value state like a traffic light [9]. The red phase marks in the shown grid-supporting charging infrastructure control system a critical grid state. In the yellow phase is the grid shortly before critical and in the green phase allows the grid state all operation modes of electric vehicles.
For typical support-functions during charging of electric vehicles for the grid are in the red phase a frequency control. This frequency control reacts on under frequency like a smart protection switch and disable the charging procedure. The control function is shown in equation 2.
𝐸𝑉(𝑓) = {
𝑚𝑎𝑥 𝐸𝑉 𝑓𝑙𝑜𝑤 < 𝑓
0 𝑓 ≤ 𝑓𝑙𝑜𝑤 (2)
A detailed analysis of this frequency control is shown in [10]. Two main protection function for low and medium voltage distribution grid are overload control and voltage stability. Both are activated by a yellow state of the grid state machine. This yellow phase means that an energy market is restricted. The goal of the functions overload and voltage control is to prevent critical grid states with the focus on local events. Therefore, the controller modify the maximum charging power.
The bottleneck control could designed as multilevel control structure. The control system measures the available power of the critical equipment and dispense this power on all connected charging procedures. The critical equipment could be a transformer or a single line. Figure 9 shows the control loop for the bottleneck control function on a control node. The algorithm distributes the available power among the connected vehicles.
Fig. 9. Bottleneck controller
A simple method to realize a voltage controller is the implementation of a voltage static. As shown in equation
0 500 1000 1500 2000 2500
B1 B2 B3 T+L1 L2+L3
Lo
ad
/
A
fix 3.7kW
fix 11kW
SF
St
at
e
o
f
Gr
id
Market based charging algorithem
frequency control
(3) the charging power is PEV when the voltage is not critical. When the voltage drop and cross the bound Un,min the power will reduced linear to zero at the value Ukrit. The power reduction factor k is defined in equation (4).
𝐸𝑉(𝑢) = {
𝑚𝑎𝑥 𝐸𝑉 𝑈𝑛 𝑚𝑖𝑛 < 𝑢 < 𝑈𝑛 𝑘 ∙ 𝑚𝑎𝑥 𝐸𝑉 𝑈𝑘𝑟𝑖𝑡 < 𝑢 < 𝑈𝑛 𝑚𝑖𝑛
0 𝑢 < 𝑈𝑘𝑟𝑖𝑡
(3)
𝑘 = 𝑈𝑘𝑟𝑖𝑡−𝑢
𝑈𝑘𝑟𝑖𝑡−𝑈𝑛 𝑚𝑖𝑛 (4) After the adjustment of the charging power depending of the grid condition, market-based charging energy-management-system can change the available charging power. As a market-based energy-management-system a schedule-based optimization algorithm or local or regional own-consumption optimization [11, 12] can be used. This optimization operates in the green grid state.
3.2 Implementation and results
To validate the concept of grid-supporting charging infrastructure we implement and test the algorithms at first in simulation. Afterwards a laboratory setup will be presented in which the algorithm can be implemented. For simulation of the two function for distribution grid voltage and bottleneck control, the simulation uses a single low voltage feeder as grid model. The load is a profile of a residual load, which violate the voltage and thermal limits. As the additional electric vehicle load three BEV are add to simulation with the charging algorithms shown in chapter 3.1. The maximum charging power is 6.4 kW, 7.2 kW and 11 kW and the minimum charging power is 2.4 kW. Voltage and bottleneck control simulation occur separate.
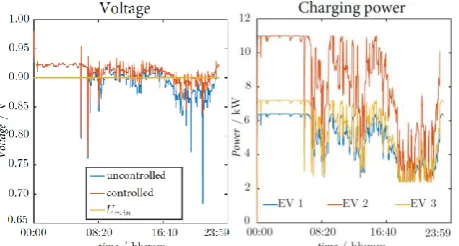
Figure 10 shows the results of the voltage controller simulation. During the first hours of the day, the voltage is above Un,min, so the controller does not adjust the charging power. Then the voltage varies between Un,min and Ukrit with the result that the controller adjusts the voltage. If the voltage drops below Ukrit, the charging power reduce to the minimum charging power. The controller increases the voltage in such a way that the limit value is violated less frequently.
Fig. 10. Concept of grid supporting charging infrastructure
Figure 11 shows the results of the bottleneck controller simulation. In the time when no limit value violation takes place, the electric vehicles charge with maximum charging power. When the maximum thermal load is
reached, the controller adjusts the charging power down until the minimum charging power. The controller therefore reduces the load on the equipment.
Fig. 11. Concept of grid supporting charging infrastructure
The simulation of voltage and bottleneck controller shows that the algorithms are able to realize grid-supporting behavior. Accordingly, the next step involves the practical implementation.
An example for implementation is built up in the smart grid technology lab of TU Dortmund University. This implementation based on a decentralized agent system implemented on a market-ready protection device. The setup of the laboratory test is shown in figure 12. The benchmark grid emulate a low voltage grid feeder with a feed-in from the 10kV medium voltage grid. With a 3-phase voltage regulator transformer the low voltage, level can adjust between 0 and 500V. The impedance of the cables is emulated with a line emulation and the feeder is loaded by adjustable load. At the end of the feeder, a charging station connects an electrical vehicle. The grid-supporting charging infrastructure consist of the parts. A control agent on substation level meter the power of the line and the transformer and calculate the grid state. Also the bottleneck control and voltage control is implemented there. Via Modbus TCP communication, the system communicates with a Charge Controller. A Meter system send Voltage and Power of the charging proceed to the Charge Controller. With standardized communication protocols controls the charging controller the charging process of electric vehicles.
Fig. 12. Possible hardware configuration of grid-supporting charging infrastructure
On the control agent, the different algorithms for grid-supporting charging infrastructure can be tested.
10 kV 10 kV / 0-500 V Line Emulation Adjustable Load EV
Power Meter
4 Conclusion and outlook
To introduce the idea of grid-supporting charging infrastructure a tool for generating load curves and simultaneity factors is shown. This helps to estimate the behavior of charging infrastructure to the grid. An example shows how to use it for grid planning and outline, that simultaneity-based planning is an efficiency approach for planning gird components.
However, the approach is right now based on the mobility behavior of mainly gas-powered vehicles. Even though severe differences in this behavior for EV users is unlikely, this and other factors my influence the future use of EV and thus the necessities for the grid planning. Accordingly, once sufficient and realistic data is available, the approach should be updated in order to cope with the recent development.
The second part shows the concept of grid-supporting charging infrastructure and a technical implantation of the soft- and hardware. A simulation of the algorithms confirmed the grid-supporting characteristic of the concept. Finally, a hardware configuration in the Smart Grid Technology Lab of TU Dortmund University is shown. It can be used as a platform to validate the shown concept of different algorithms. The next step is to validate the shown concept an algorithms on the hardware platform.
Acknowledgement
This research is partially supported by Federal Ministry of Transport and Digital Infrastructure and the Federal Ministry for Economic Affairs and Energy of the Federal Republic of Germany.
References
1. European Commission, The 2015 International Climate Change Agreement: Shaping international climate policy beyond 2020, Brussels, 2013
2. Pregger, Th., et al., Perspektiven von Elektro-/Hybridfahrzeugen in einem Versorgungsgebiet mit hohem Anteil dezentraler und erneuerbarer Energiequellen, 2012
3. Friedl, G. et al., Blackout E-Mobiliät setzt Netzbetreiber unter Druck, 2018
4. Deutsche Energie-Argentur GmbH, dena-Leitstudie Integrierte Energiewende, 2017
5. Deutsches Institut für Normung e.V., DIN 18015-1: Elektrische Anlagen in Wohngebäuden – Teil 1: Planungsgrundlagen, 2013
6. Rolink, J., Large-Scale Modeling of Grid-Connected Electric Vehicles, IEEE Transactions on Power Delivery Year: 2013, Volume: 28, Issue: 2, Pages: 894 - 902
7. Kippelt, S., Dezentrale Flexibilitätsoptionen und ihr Beitrag zum Ausgleich der fluktuierenden Stromerzeugung Erneuerbarer Energien, Shaker Verlag, Aachen, 2019
8. Maasmann, J., Die Virtuelle Direktleitung für den Entfernten Eigenverbrauch durch Elektrofahrzeuge, Shaker Verlag, Aachen, 2019
9. Bundesverband der Energie- und Wasserwirtschaft e.V., BDEW Roadmap: Realistische Schritte zur Umsetzung von Smart Grids in Deutschland, 2013 10. Albrecht, Ch., et al., Selective and decentralized
underfrequency protection schemes in the distribution grid, In 2017 IEEE Manchester PowerTech, 2017
11. Maasmann, J., et al., SyncFueL – concept of remotely synchronized Own-Consumption for charging electric vehicles, ISGT-LATAM, 2015