Visualization in Argument Based Recommender
System
Preeti #, Ankit Rajpal #, Purnima Khurana*
#
Assistant Professor ,Department of Computer Science Deen Dayal Upadhaya College, University of Delhi, Delhi, India
*
Assistant Professor ,Department of Computer Science P.G.D.A.V. College, University of Delhi, Delhi, India
Abstract— Recommender systems are information filters which are being used to overcome the problem of information overload. The opinion of other users of the system is used to help individuals identify the item which might be of their interest or relevant to their needs. Visualization in Recommender systems have gained an increasing importance in last few years. We have observed the lack of research in visualization in an argument based recommender system. Data visualization is a visual presentation of data and their interrelationship. In this paper, we have proposed an argument based recommender system which uses hybrid approach in which two results: trustworthy users and arguments occurred between user agent and recommender agent is visualized, using D3 tool. The experimental study shows that two results of our system can be better presented by graph visualization.
Keywords—Visualization, Recommender System, Trustworthy, Argumentation.
I. INTRODUCTION
Recommender Systems (RSs) are programs that help the user in navigating large volumes of information available, attempting to provide a solution to the user’s needs or suggesting items that the user may like. Most common techniques used in their implementation are: collaborative filtering, where user ratings for objects are used to perform an inter-user comparison and then propose the best rated items; content-based recommendation, where measures of similarity between item’s content are used to find the right selection [1]; And hybrid version of these, where these two filtering techniques are combined to overcome their individual limitations.
The argument based reasoning can be integrated into the recommender systems in order to provide a qualitative perspective in decision making at both ends user and recommender system. A dialogical approach is followed for argumentation process in which each agent put forward his argument, attack (or agree) with other agent’s arguments, give reasons for its argument and try to persuade or negotiate with another agent. In this way, the results obtained from recommendations can be further improved through ‘argumentation’ between the user and the recommendation system.
In this paper, we borrow the concept of visualization of trustworthy users and argumentation graph in an argument based RSs. RSs use the opinion of other users, on which a particular user trusts(or believe in), to help individual to identify the information most likely to be interesting to them or relevant to their needs. Recommendations are provided by considering the liking ratings of trustworthy users (those users who have given more rating to the same item than the current user). So, a factor of trust (belief) has been incorporated in this system. If the recommended items match user preferences, user trust in the system increases and user start liking the system and use it more frequently[2].
In an argument based RSs, initial recommendations are provided to the user using hybrid approach of recommendation. This hybrid approach is a combination of collaborative filtering which yields the preferred items by considering the likings of trustworthy users and content based filtering that applies user preferences on preferred books. Argument process is used as a tool to increase the persuasive power of RS by allowing the system to explain its reasons for proposing certain recommendations to users. Argumentation is an important way of human interaction and reasoning. Argumentation process is performed on all those attributes which are disliked by the user. So, argumentation graph consist of sub graphs which depict argumentation on a specific attribute.
Visualization supports the extraction of hidden patterns by presenting the data in various visual forms. Visualization not only provides a qualitative overview of large and complex data sets, it can also assist in identifying regions of interest and parameters for further quantitative analysis. There are several benefits of using visualization in an argument based RSs:-
Relationship between different data points
becomes more apparent.
It is a great tool to communicate information in a
very compact and often easy to understand way.
It reduces analysis time. Time taken to analyze
thousands of line of logs is definitely slower than looking at a few graphs of the same data.
The Remainder of the paper is organized as follows. In section 2, related work is given. Section 3 explains the tool used to implement the proposed argument based recommendation system. Section 4 gives an overview of the proposed system, followed by Section 5 explaining the implementation details of proposed method. Section 6 explains the concept using a case study. Finally, section 7 concludes the paper.
II. RELATED WORK
Human eyes can interpret a graph much faster than plain texts, as it can process many visual cues simultaneously. However, processing a chunk of text may take more effort. To visualize information incorporated in explanations, a number of visualization techniques have been used such as tables, images, diagrams, text-highlighting, color schemes, rating and animation [3]. Visualization has been used in recommender systems in explanations of recommender system, visualization of recommendations driven by user’s preferences in order to provide more effective than persuasive recommendations [4]. Visualization approach has also been acquired in user profiling within recommender system [5].
Visualization techniques have also been broadly used in a number of e-commerce websites. For example in Amazon.com , there is the use of techniques such as text-highlighting, five-star rating scales, images, colours, text size, tables, animation etc. Also, in IMDb.com website, the same previous techniques are being used except for the rating scale which is there a ten-star rating scale .It has been found that concise arguments are better than lengthy and detailed arguments and that those arguments should only present pertinent and cogent information [3].
It was found that a system having a good graphical user interface to explain the reasoning of recommended items will lead users to better trust that system. Trust was found to be the most important factor that leads to better user satisfaction and user experience with the system, as people were found to return to recommender systems that are trustworthy [3].
III.TOOLS AND TECHNIQUES
There are several web based data visualization tools, which are suitable for different types of visualizations (e.g. Tableau, Arbor, Protovis, and D3 etc. One of the tools is D3 which uses JavaScript library for creating data visualizations. Protovis was previous version of tool D3. So, Protovis has been replaced by D3. Arbor tool do not support all the web browsers. And tableau do not support interactive web based visualization, whereas, D3 facilitates with interactive web based visualization. The D3 means Data-Driven Documents where, data is provided by
user, and the documents are web-based documents,
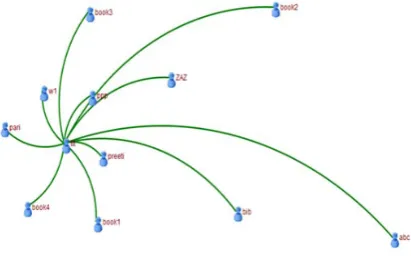
meaning anything that can be depicted by a web browser, like HTML. And tool D3 does the driving, which means that it connects the data to the documents.D3 is very fast that can support a large datasets and dynamic behaviours for interaction and animation. In D3 styles, attributes, and other properties can be specified as functions of data. It provides creative, interactive and custom visualization of data.D3 is a visualization tool that facilitates generation and manipulation of visually depicted data [6]. D3 allows transforming documents based on data; this includes both creating and destroying elements. It also allows changing an existing document in response to user interaction, animation over time. D3 is capable of more than just making visualization. Data-Driven Documents (D3), an embedded domain-specific language for transforming the document object model based on data. This is a generalization of Protovis. And yet, D3’s standardized representation improves expressiveness and accessibility, while transforms offer dramatic performance gains and enable animated transitions [6]. A visualization example of D3 tool is shown in fig.1: - It is a labelled force layout in which all nodes are labelled. Force depicts the relation between different nodes.
IV.OVERVIEW OF PROPOSED SYSTEM
Our Argument based Recommender system is based on agent based methodology. The key tasks of personalized recommender system includes gathering customer’s personal interests, constructing a model(using both collaborative and content based filtering) to describe the information collected and providing suitable recommendation(group as well as individual).In content based filtering we are considering user’s interests and in collaborative also taking into account trust factor- a user’s trust on other user. Our proposed system consists of three phases- modeling phase, the Recommendation phase and the Argumentation phase.
In the modeling phase, liking ratings of user is maintained. These liking ratings are used to determine trustworthy users and also preferred items (using collaborative filtering technique) which are fed as an input for content based filtering. Preferred items are determined by using collaborative filtering technique. Under this technique user agent matches the items liked by the current user with the other’s user’s liking. If two or more items liked by the other users matched with the items liked by the current user and sum of rating of all matched items specified by other users is greater than the sum of liking rating specified by the current user to the matched books, then those users will be considered as trustworthy users of current user.
We determine whether a user is trustworthy or not on the basis of formula given below:
Also, to determine trust level of each trustworthy user we use the formula given below:
This trust level is used as a weightage in preferred books. These preferred books are then used by content based filtering technique to provide final recommendations. In our system, users can also visualize their trustworthy users. Visualization graph shows all the trustworthy users of current user with their respective trust levels. This visualization graph can better help a user to see all its trustworthy users and their trust level.
In the recommendation phase recommender agent works to generate preference based recommendations for the user. The recommended objects are filtered from the preferred items by using content based filtering.
In the argumentation phase, we have two agents- user agent and recommender agent. User agent (on behalf of user) argues with the recommender system for items
disliked by user. A dialogical approach is followed for argumentation process in which each user put forward its argument, attack or agrees with other agent’s arguments, give reasons for its argument and try to persuade or negotiate with another agent. Each agent may have many arguments to utter at any step of argumentation. But, every agent will always choose strongest of many arguments to increase the probability of winning. Updates are made into information maintained by user and recommender agent depending upon winning argument and improved recommendations are provided to user.
The arguments generated between user and recommender can also be visualized. Visualization of arguments shows different types of arguments uttered by two agents, attacks between arguments, weight of different arguments and the winning argument. This visualization helps a user to better understand the reasoning provided by the recommender system. Fig.2 shows the basic operating scheme of our proposed system which consists of two main components discussed below. The argument based RS distributes its tasks amongst 2 different agents UA (User Agent), and RA (Recommender Agent). Now four main components are:
1) Information maintenance: The system takes input from the user and maintains the user liking ratings in the database which are provided to collaborative filtering to compute the trustworthy users.
2) Recommendation process: The system generates the recommendation according to hybrid filtering technique. It then chooses product according to user needs and recommend it.
3) Argumentation process. The system allows a user to get insight into the reasoning about why these recommendations are provided.
4) Visualization: The system also allows a user to visualize his/her direct trustworthy users and arguments held between UA and RA in argumentation phase.
V. IMPLEMENTATIONOFVISUALIZATION
A. For Direct Trustworthy users
Fig.2 Basic operating scheme of the proposed system
There are several layouts that are supported by tool D3. For visualization of trustworthy users, forced layout is used.D3 tool can handle data in some specific forms like JSON, array of numbers, strings, and object. In our System, data of trustworthy users which is stored in a tmp table is mapped to JSON file by using php code. In php code, following function is used to convert data from database to JSON file:-
json_encode(array('nodes'=>$data1,'links'=>$data));
Where, data1 is an array that contains names of trustworthy users which are shown by nodes and array data specifies the source and target of each edge of the graph. Above mentioned function helps to convert data into array of nodes and edges that follows JSON format. After that, array of nodes and edges in JSON is fed as an input to force layout nodes and edges by using following functions:-
force.nodes(json.nodes)
force.links(json.links)
Nodes of forced layout represent users and edges between them represent the trust level between two users which are at the end points of that edge. Edge length is determined by trust level of current user upon that trustworthy user. So, distance between nodes is dynamic that is computed using following function:
force.distance(function(d){if(d.value!=0){return x/d.value;}})
Where, d.value represents trust level of current user upon trustworthy user and x is a constant. By using this division function, one with large trust level will be closer to current user and one with small trust level will be farther from current user .Here, x is a constant value (determined experimentally) used to adjust length of edge. In this way, trust level is taken into consideration for visualization of direct trustworthy users of current user. After that several properties of nodes and links are set. An image (to depict user and its trustworthy users) is appended by using following function (node is an SVG element):-
node.append("image")
Fig 3: System snapshots for visualization of trustworthy users
B. For Arguments Graph
After completion of argumentation process between user and recommender, our system allows current user to visualize arguments between user and recommender which has been implemented using D3 visualization tool. Argumentation process is performed on all those attributes which are disliked by the user. So, argumentation graph consist of sub graphs which depict argumentation on a specific attribute. In our system, d3.v3.min.js JavaScript library is used for data visualization. For a user who wants to visualize argumentation graph, execution starts from a jsp page named as argumentation_graph.jsp. On this jsp, different arguments uttered by user and recommender are retrieved from arguments_graph table. To use D3 visualization tool, first step is to create a new DOM element that will be an SVG object for rendering a data visualization.
There are several layouts that are supported by tool D3. For visualization of argumentation process, forced layout is used.D3 tool can handle data in some specific forms like JSON, array of numbers, strings, and object. In our System, different arguments which are stored in an arguments_graph table are mapped to JSON file by using php code. In php code, following function is used to convert data from database to JSON file:-
json_encode(array('nodes'=>$data1,'links'=>$data));
where, data1 is an array that contains an argument id, utterer and weight of that argument which are shown by nodes and array data specifies the source and target of each directed edge of the graph, type of attack(rebut, undercut) from source to target of that edge. Above mentioned function helps to convert data into array of nodes and edges that follows JSON format. After that, array of nodes and edges in JSON is fed as an input to force layout nodes and directed edges by using following functions:-
force.nodes(json.nodes)
force.links(json.links)
Nodes of forced layout represent arguments uttered by either user or recommender and directed edges between them represent the attack of one argument on another argument. An argument can be uttered either by a user or by recommender which is depicted by using different colour
for their corresponding arguments. Along with this, a node also depicts the weight of an argument that helps to decide winning argument of a graph. Edges are directed to denote source and target of an attack where attack can be rebut or undercut. Different colours of arrow have been used to depict argumentation on different attributes. An edge length is kept as constant.
There are several types of edges supported by D3. In our argument based RSs, parabolic type of edge is used to represent the link between nodes (or arguments). CSS is used to set several properties of nodes and edges to make the graph more attractive.
Fig 4.1. System snapshot for visualization of Argumentations graph
Fig. 4.2: System snapshot for visualization of Argumentations graph
Fig.4.2 shows the arguments uttered by UA and RA in a Book recommender system when user disliked a particular book among the recommended book. Since, this process is repeated for each of he disliked attribute of that book. So, Fig 4.1 the visualization of Argumentation graph consists of several sub graphs.
VI.CONCLUSIONS
trust level. Also, a user can visualize various arguments (generated for explanation, persuasion and negotiation), attacks between them, weight with which they are attacking each other and the winner of argumentation process. This visualization of argumentation graph is a better way to understand the reasoning provided by the recommender system.
REFERENCES
[1] Bedi, Punam, Pooja Vashisth, Purnima Khurana and Preeti, “Modeling User Preferences in a Hybrid Recommender System using Type-2 Fuzzy Sets,” Special Session on Intelligent Agents, IEEE International Conference on Fuzzy Systems, FUZZ-IEEE, 2013.
[2] Pooja Vashisth, Deepak Chandoliya, Bipin Kumar Yadav, and Punam Bedi, “Trust enabled Argumentation Based Recommender System, “ ISDA, page 137-142. IEEE, (2012) [3] Mohammed Z. Al-Taie and Seifedine Kadry, "Visualization of
Explanations in Recommender Systems," Journal of Advanced Management Science, Vol. 2, No. 2, pp. 140-144, June 2014. doi: 10.12720/joams.2.2.140-144
[4] Vashisth, Pooja Sumit Agarwal, Bimlesh Wadhwa and Punam Bedi, “Capturing User Preferences through Interactive Visualization to Improve Recommendations,” WCIT - International Conference on World Conference on Information Technology, Antalya, Turkey, Procedia Journal of Technology, Elsevier, 2011.
[5] Middleton, Stuart E., Shadbolt, N.R. and De Roure, D.C. (2004), Ontological User Profiling in Recommender Systems. ACM Transactions on Information Systems (TOIS), 22, (1), 54-88. [6] L.M. de Campos, J.M. Fernández-Luna, J.F. Huete, “A
![Fig 1: Visualization example of D3 tool [https://github.com/mbostock/d3/wiki/Gallery]](https://thumb-us.123doks.com/thumbv2/123dok_us/7826714.1296883/2.595.358.521.488.681/fig-visualization-example-tool-https-github-mbostock-gallery.webp)