Attraction of Urban Rail Transit According to TOD: A Case of Shanghai
Ping Zhang
1, Zheyi Zhong
2, Tianran Zhang
31
Road and Traffic Key Laboratory, Ministry of Education, Shanghai, 201804, China;
[email protected]
2
Road and Traffic Key Laboratory, Ministry of Education, Shanghai, 201804, China;
[email protected]
3Shanghai Urban Planning and Design Research Institute, Shanghai 20040, China;
[email protected]
Abstract: The concept of transit-oriented development (TOD) has been widely recognized in recent years for its role in reducing car traffic, improving public transportation, and enhancing traffic sustainability. This paper conducts empirical research on a developed rail transit network, using Shanghai as a case study. In addition to traditional TOD features, other factors based on urban rail transit are introduced, including multi-level modeling (MLM), which is used to analyze the possible factors influencing rail patronage. To avoid the bias of research results led by the correlation between independent variables, factors are divided into two levels. The first level includes three groups of variables: the built environment, station characteristics, and socioeconomic and demographic characteristics. The second level includes a set of variables which are regional characteristics.Results show that the most significant impact on train patronage is station location in the business district area. Other factors that have a positive effect on promoting rail transit travel include the number of service facilities around the station, degree of employment around the station, economic level, intensity of residential development, if the station is a transfer station, the operating period of the station, and the size of the large transportation hub around the station.
Key Words: Urban rail transit; TOD; Multi-level modeling 1. Introduction
The social and environmental problems created by the rapid growth in automobile use, and methods to reduce car dependency have received much attention from the academic community. Encouraging high-load, environmentally friendly public transportation is an important policy measure to reduce car use. Methods to promote the use of urban rail transit, a foundation of the urban public transportation system, have also attracted much interest.
Over the past decade, transit-oriented development (TOD) has been widely recognized and promoted as a sustainable urban development model [1-5]. The TOD model integrates both land use and transportation development, and can be applied to high-density, mixed land use, and slow-moving development around stations to improve public transportation and reduce the use of cars.
The two main types of public transportation stations are ground bus stations and rail transit stations. Most existing TOD research is focused on land use elements around the bus stations, however, the characteristics of rail transit are very different in terms of passenger capacity, operating speed, and distance between stations.
The influencing factors of urban rail transit travel are complicated and thus it is inadequate to focus solely on the land use level. The purpose of this study is to expand TOD development model elements to rail transit sites. This is not only valuable for effectively increasing rail traffic and reducing car traffic, but will have a significant impact on urban planning, land development, and transportation planning.
In addition to traditional land use, this study focuses on the factors that may have an impact on the patronage of rail transit based on rail stations. These factors include the characteristics of the region where the stations are located, the characteristics of the stations, competition from other modes of transportation, and socioeconomic and demographic characteristics.
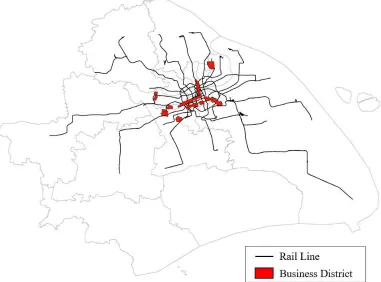
Shanghai is one of the most prosperous cities in Asia and worldwide. The city’s urban rail transit network has the longest operating mileage in the world and large-scale traffic passenger volume. Rail transit is the foundation framework of the comprehensive transportation system in Shanghai. In 2017, the average daily patronage of Shanghai Metro was 9,693,300, and total patronage reached 3.538 billion. By 2018, there were 16 rail transit lines in Shanghai, with a total of 393 stations, mileage of 644 kilometers, and the total length of the line ranked longest in the world [6]. By 2020, the total operating mileage of the network is expected to reach 970 km [7]. The Shanghai rail transit network and urban spatial layout is illustrated in Fig. 1. Shanghai has been
selected as the model for empirical research as it is a world metropolis with a population of over 20 million, and the most developed urban rail transit system in the world. Through quantitative analysis of the influencing factors of rail transit patronage, the effective measures of the TOD model based on rail transit stations is discussed. Policy recommendations are then provided for the development of rail transit sites, to promote the sustainable development of the city.
Fig. 1. Shanghai Metro network and distribution of major business districts 2. Literature Review
The earliest research on the influencing factors of urban rail patronage can be traced back to the 1980s. Jones and Nichols analyzed the factors determining urban rail transit patronage demand by tracking ticket sales data and using the least squares method [8]. The influencing factors of urban rail use can be divided into two categories: internal factors and external factors [7]. Internal factors mainly include attributes related directly to the operational status of rail transit, such as frequency of departure, speed of operation, and punctuality rate. Early research to alleviate increasing traffic problems focused on increasing the use of urban rail transit by improving the quality of service of the rail transit system (internal factors), and reducing dependence on private cars. Methods included improving ride comfort and reducing wait times, but the results were not satisfactory [9]. Subsequent research has gradually shifted to focus on external factors which, as numerous studies have shown, have a greater impact on rail traffic than internal factors [10-13].
Various studies investigating the influence of external factors on rail transit take different considerations into account in their selection of influencing factors. Traditional external factors mainly include land use and socioeconomic and demographic characteristics [14-21]. Most studies are based on these characteristics and include some other factors. Mark and Jonathan considered the influencing factors of urban rail network accessibility for urban rail transit passenger flow based on traditional socioeconomic population variables [22]. It was found that simply improving the accessibility of the rail network does not increase urban rail transit demand to a large extent. Researchers have come to understand that the factors affecting rail transit traffic are complex and involve multiple levels.
characteristics of land use [23, 27-28]. In existing TOD study based on rail transit, the built environment around the station and the accessibility of the urban rail transit network is mostly considered. This demonstrates that the characteristics of land use around rail transit, the intensity of development, and the accessibility of the urban rail transit network will have an impact on the patronage of rail transit. Existing research also illustrates that consideration of the construction environment and the accessibility of the rail network as influencing factors is very limited [29-31]. Varying regional characteristics of urban rail stations have a strong impact on patronage. However, further research is required to form exact conclusions on how such characteristics affect rail travel. Loo have discussed this concept, but their research does not distinguish the location characteristics of the station with other influencing factors [32]. An important aspect of the study detailed in this paper is to divide the location characteristics of the station into two variables: the distance from the city center, and whether the station is located in the urban business district area. These two variables are separated from the variables at the station level by establishing a multi-level model (MLM).
The advantage of this study is the use of MLM to analyze the influencing factors of rail patronage based on the TOD model. Previous studies have predominantly used regression models to analyze influencing factors, but there is a fatal problem with such analysis methods as the correlation between independent variables will violate the hypothesis of individual variables in the regression model, thus the model results will deviate. Although most studies have made the assumption that each variable is independent of each other before establishing the regression model, they can’t guarantee there is no actual correlation between variables. Using MLM can easily solve this problem by separating the variables according to different levels of layered research to avoid the correlation between variables of different levels and deviation of the model results.
3. Materials and Methods
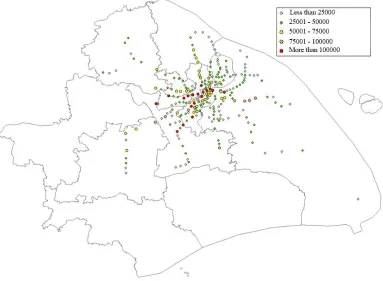
The urban rail station patronage data used in this study is gathered from Shanghai Urban Planning and Design Research Institute. The data shows the average daily passenger volume of each rail station in Shanghai in 2017, and the patronage data used to create the final model is the sum of the inbound passenger volume and outbound passenger volume. Excluding the stations in which passenger volume or other variables are missing, the data contains a total of 249 Shanghai Metro stations, and the distribution of patronage at each station is illustrated in Fig. 2.
Fig. 2. Patronage distribution of rail stations in Shanghai
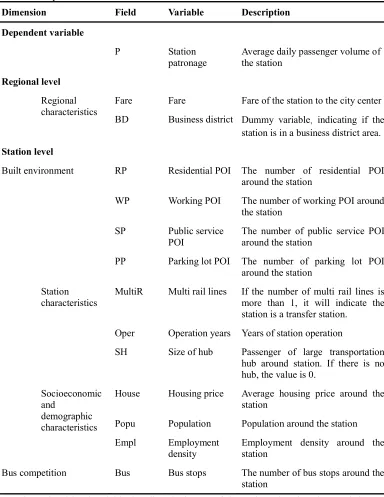
regional characteristics, the built environment, station characteristics, socioeconomic and demographic characteristics, and bus competition. These variables and descriptions are provided in Table 1.
Table 1. Description of variables
Dimension Field Variable Description
Dependent variable
P Station
patronage
Average daily passenger volume of the station
Regional level
Regional characteristics
Fare Fare Fare of the station to the city center
BD Business district Dummy variable, indicating if the
station is in a business district area.
Station level
Built environment RP Residential POI The number of residential POI
around the station
WP Working POI The number of working POI around
the station
SP Public service
POI
The number of public service POI around the station
PP Parking lot POI The number of parking lot POI
around the station
Station characteristics
MultiR Multi rail lines If the number of multi rail lines is more than 1, it will indicate the station is a transfer station.
Oper Operation years Years of station operation
SH Size of hub Passenger of large transportation
hub around station. If there is no hub, the value is 0.
Socioeconomic and
demographic characteristics
House Housing price Average housing price around the
station
Popu Population Population around the station
Empl Employment
density
Employment density around the station
Bus competition Bus Bus stops The number of bus stops around the
station
For build environment variables, the use of traditional land use characteristics was abandoned, and replaced by point of interest (POI). In geographic information systems, POI mainly refers to geographical entities closely related to people's lives, such as schools, banks, and supermarkets. Each POI data consists of four aspects of information, including name, category, coordinates, and classification [34]. Compared to traditional land use characteristics, POI data has two advantages. First, the content reflected in POI data is more intuitive, so the POI number can directly reflect the development intensity of a region. The second advantage is that POI data reflects a more detailed and comprehensive built environment. Land use data generally includes the proportion of commercial land and residential land, and POI data can be classified by the keyword of retrieving. Common types of POI data include residential, working, public services, attractions, transportation, education, and parking lots.
Four types of POI data that are believed to have an impact on rail travel were selected in this study and are residential, working, public service, and parking lot data. Residential POI includes residential buildings, dormitories, and apartments. Working POI includes office buildings, factories, industrial parks, and places provided only for working activities. The public service POI contains six types of places to provide public services, including commercial, shopping, parks, medical, banking, and catering places. Parking lot POI includes road parking areas and public parking lots.
This study uses the location retrieval function of the application program interface provided by Baidu Map development platform to retrieve all POI data around stations. Retrieving range is defined as a circular area with the radius of 1 km around the stations. Previous studies typically used 0.25 miles as the station radius range, determined by the tolerable walking distance of most residents [29-30]. However, the distance of 1 km is selected here as the popularity of shared cycling in Shanghai has led to an extension of slow travel distance.
Station variables include whether the station is a transfer station, years of station operation, and if the station is a connection station to a large transport hub, which mainly refers to train stations and the airport. The difference in transport hub size has an impact on the patronage of the rail station to which they connect. Thus, the total annual passenger volume of a hub is used to reflect its size in this study.
Socioeconomic and demographic characteristic variables include population, employment density and economic level around the station. Market-transparent housing prices are used here to replace the traditional survey of resident income in order to avoid possible deviation.
The number of bus stops around the rail station belongs to the variable of bus competition, which is used to explore the relationship between traditional bus and rail transit in this study.
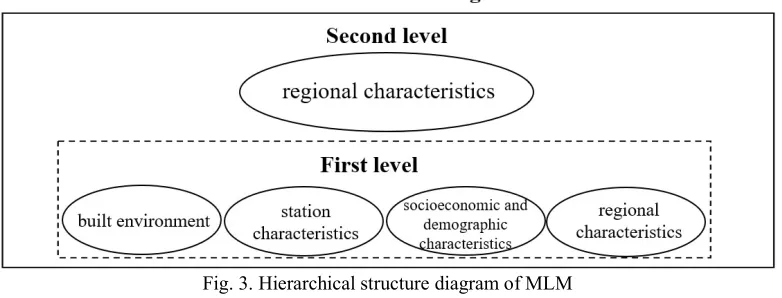
Fig. 3. Hierarchical structure diagram of MLM 4. Results and Discussion
Table 2 contains the result of the MLM model of the influencing factors of urban rail travel in Shanghai. The final model has a 0.858 R square value, indicating that 85.8% of the data can be interpreted, and the model results are highly reliable.
Table 2. MLM of Shanghai urban rail patronage
Variable Beta coeff. SE t Approx.d.f P
Constant 3.589 1.606 5.292 8 0.000
Fare 0.799 1.054 -1.168 8 0.277
BD 3.654 4.179 1.719 8 0.047
RP 0.169 1.399 -2.379 235 0.018
WP 1.106 1.074 0.040 235 0.968
SP 2.268 0.973 5.308 235 0.000
PP 1.095 0.417 0.330 235 0.742
MultiR 1.508 0.694 3.729 235 0.000
Oper 1.148 0.443 4.570 235 0.000
SH 1.284 0.502 5.438 235 0.000
House 1.095 0.414 -1.967 235 0.050
Popu 1.095 0.414 -1.555 235 0.121
Empl 1.095 0.414 5.135 235 0.000
Bus 1.096 0.417 0.884 235 0.378
4.1 Variables of regional characteristics
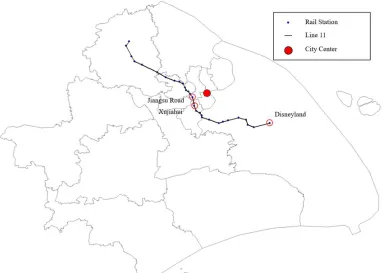
Fig. 4. Distance distribution between the stations of Line 11 and the city center
Fig. 5. Passenger volume of all stations on Line 11
Table 3. Passenger volume characteristics of the business district stations and non-business district stations
Station types Number of
station
Maximum passenger volume
Minimum passenger volume
Average passenger volume
Business district stations
18 271518 18642 103770
Non-business district stations
231 150766 3028 37633
4.2 Built environment variables
Built environment variables include residential POI, working POI, public service POI, and parking lot POI. The results show that residential POI and public service POI both have a significant influence on station patronage (p values are 0.018 and 0.000), while working POI and parking POI have no meaningful effect (P values are 0.968 and 0.742). This indicates that for commercial
development around the station, it is mainly the public service industry that has a positive effect on rail traffic, rather than industries that only provide working activities.
When considering parking lot resources around stations, previous studies have not only referred to surrounding public parking lots, but also included residential or employment parking places [39-40]. The main purpose of this study is to explore the development model around stations that can promote rail transit, so only road parking areas and public parking lots around the station are considered to analyze the relationship between parking resources and rail patronage. This paper attempts to explore whether people will choose a car-rail travel mode, switching from private cars to rail transit, under the condition of sufficient parking lot resources. However, the expected conclusions were not obtained and simply increasing the amount of parking around stations is not enough to encourage people to switch from private cars to rail transit. In Shanghai, people will more often use taxis than private cars when involved in car-rail transfer trips. The current popularity of new modes of transportation including feeder cars, shared bicycles, shared cars, and online vehicles, raises the question of whether travel by traditional private car to rail transit is worth encouraging. 4.3 Variables of station characteristics
All three variables in station characteristics have a significant impact on station patronage, indicating that station characteristics are an important factor, and passenger volume can be effectively increased by improving the characteristics of rail stations. In particular, the stations with more than one line display a high correlation feature (P=0.000). Due to high accessibility, a transfer station can attract passengers from other lines. This result indicates that more passengers can be attracted by improving the connectivity of rail transit networks. The earlier rail stations are developed in an area, the more ‘important’ the area becomes in the city, with more gathering residents, and more facilities, and activities of all kinds. The contribution of large transportation hubs to the attraction ability of rail transit travel is often ignored by researchers, but the model results show that the combination layout of rail stations and large transportation hubs has an important role for patronage (P=0.000).
4.4 Variables of socioeconomic and demographic characteristics
Variables of socioeconomic and demographic characteristics include housing prices, population, and employment density. The result shows that housing prices and employment density have a significant influence on rail passenger volume, but population has no notable influence. In this study, the income level of residents is replaced with housing prices to characterize the economic level of the area around the stations. Areas with higher housing prices often correlate to higher area accessibility, as well as better facilities and environment. These areas will attract more active activities including commercial, shopping, and public services. The passenger volume of the stations in these areas are also higher. The standardized coefficient of employment density is 1.095 (P=0.000), indicating that the average daily rail passenger volume will increase by 1.095 for each additional number of employment within the 1000 meter radiation range of the station. However, it is concluded here that there is no significant relationship between population and patronage. This is because in the process of urban development in Shanghai, along with the construction of urban rail, the housing prices for areas surrounding train stations were significantly higher than those areas under the same conditions but far away from rail stations. Therefore, residents living in the surrounding areas to rail stations generally have higher income levels, and rail transit is more likely to be used by people without high income.
4.5 Bus competition
An exploration into the relationship between traditional public transport and rail transit is attempted through studying the number of bus stops around the rail station. The results show that there is no significant relationship between the number of bus stops and rail patronage (p value is 0.378, greater than 0.05). Such a result does not mean that there is no relationship between traditional public transport and rail transit, but merely indicates that the number of bus stops is not a determinant of the relationship between rail transit and traditional public transport. The relationship between the two is more complex, and may be related to the quality of service, the ease of transfer, and even the distance from the bus stop to the rail station. However, the purpose of this study is to explore how developing the area surrounding rail stations can promote rail patronage, and the main related factor is the layout of bus stops. The results show that it is not feasible to improve the passenger volume of rail stations only by changing the land-use model of public transport facilities around the rail station.
5. Conclusions
Using the MLM model, this study analyzed the influencing factors of rail transit travel in large cities at both station and regional level. The P value of 0.05 was taken as the basis for discrimination, and results show that there are eight variables, of the 13 independent variables in the model, that have a significant impact on rail station passenger volume. These variables are residential POI, public service POI, if the stop is a transfer station, operating years of the station, employment density, size of the transportation hub, housing price from the first level, and business district stations from the second level.
Whether the station was located in a business district area was found to have the most significant impact on rail patronage. This result generates a new understanding of the integration of sustainable urban planning and traffic planning with the TOD model. The rail transit network supports the evolution of urban spatial form, and the stations close to the business district area can attract more rail transit passengers. In turn, the planning and development of the city's business district, combined with rail transit stations, will improve its accessibility and attraction. Thus, the two factors promote each other to foster sustainable development of the city.
In this study, POI data was used instead of traditional land use characteristics to describe the built environment around the stations, and subsequently, more intuitive and accurate results were obtained. Public service POI and rail patronage demonstrated a high correlation, second only to the business district station variables. This indicates that the development of commercial land around stations has contributed to rail transit travel in traditional research. The determining factor was the development of service facilities, but not facilities that can only provide jobs. The results indicate that residential land around the rail station should be oriented to the needs of people with low or middle income, and the development of high-density small housing, and rental housing should be encouraged to avoid low-density large residential developments and high level apartments.
All three variables of station characteristics have a significant impact on rail patronage. Therefore, subsequent study should focus on methods to improve station characteristics in order to boost rail patronage, especially the connectivity of rail networks and accessibility of stations.
Additionally, the results of the study demonstrated that there is no significant link to rail patronage and travel by private car, represented by parking lot POI, or traditional public transport use, represented by the number of bus stops. This shows that for the land use elements developed by TOD mode for the area around the rail station, simply increasing parking land and public transport land cannot bring about the increase of rail patronage, and presents a new problem for further study. The influence of the relationship between the three travel modes accounting for the largest proportion of daily travel is complex. The quality of public transport services, connectivity of the rail network, personal choice of residents to travel, and even the relationship between the distribution of urban tenure and the rail transit network, are all possible influencing factors which have yet to be further explored.
conducting a wider comparative study to further understand the influencing factors of rail patronage in different areas.
6. Acknowledgment
The paper is partial result of a research project funded a grant from National Natural Science Foundation of China: ‘Study on spatial layout of amenities in suburban indemnificatory neighbourhoods based on activity behavior: case study of Shanghai’ (# 51378358).
Reference
1. Calthrope P., 1993. The Next American Metropolis: Ecology, Community and the American
Dream. New York: Princeton Architectural Press.
2. Cervero, R., & Hall, P., 1989. Containing traffic congestion in america. Built Environment, 15(3/4), 176-184.
3. Duany, A., Plater-Zyberk, E., Krieger, A., Lennertz,W., 1991. Towns and Townmaking
Principles. Harvard University Press, Cambridge, MA。
4. Katz, P., 1993. The New Urbanism: Toward an Architecture of Community. McGraw-Hill, New York.
5. Newman, P., Kenworthy, J., 1999. Sustainability and Cities-Overcoming Automobile
Dependence. Island Press,Washington, DC.
6. Shanghai Municipal Bureau of Statistics.
<http://www.stats-sh.gov.cn/html/sjfb/201803/1001690.html >.
7. Pan, H., Li, J., Shen, Q., & Shi, C., 2017. What determines rail transit passenger volume? implications for transit oriented development planning. Transportation Research Part D Transport & Environment, 57, 52-63.
8. Jones, I. S., & Nichols, A. J., 1983. The demand for inter-city rail travel in the united kingdom: some evidence. Journal of Transport Economics & Policy, 17(2), 133-153.
9. Hoang, H., Polis, M., & Haurie, A., 1975. Reducing energy consumption through trajectory optimization for a metro network. Automatic Control IEEE Transactions on, 20(5), 590-595. 10. Yim, K.K.W., Wong, S.C., Chen, A., et al., 2005. A reliability-based land use and transportation
optimization model. Transp. Res. Part C 19 (2), 351–362.
11. Walton, D., Sunseri, S., 2010. Factors influencing the decision to drive or walk short distances to public transport facilities. Int. J. Sustain. Transp. 4 (4), 212–226.
12. Tilahun, N., Li, M., Thakuriah, P., et al., 2014. Transit use and the work commute: an empirical analysis of the role of urban densities, last mile problems, and personal constraints on mode choice. Transportation Research Board 93rd Annual Meeting.
13. Sung, H., Choi, K., Lee, S., et al., 2014. Exploring the impacts of land use by service coverage and station-level accessibility on rail transit ridership. J. Transp. Geogr. 36 (2), 134–140. 14. Chakraborty, A., Mishrab, S., 2013. Land use and transit ridership connection: implications for
state-level planning agencies. Land Use Policy 30 (1), 458–469.
15. El-Geneidy, A.M., Tétreault, P.R., Surprenant-Legault, J., 2010. Pedestrian access to transit: identifying redundancies and gaps using a variable service area analysis. Transportation Research Board Meeting.
16. Jun, M.J., Kim, J.I., Jin, H.K., et al., 2013. The effects of high-density suburban development on commuter mode choices in Seoul, Korea. Cities 31 (2), 230–238.
17. Kim, H., Nam, J., 2013. The size of the station influence area in Seoul, Korea: based on the survey of users of seven stations. Int. J. Urban Sci. 17 (3), 331–349.
18. Lindsey, M., Schofer, J.L., Durango, P., 2010. Relationship between proximity to transit and ridership for journey-to-work trips in Chicago. Transp. Res. Part A 44 (9), 697–709.
19. LTA, 2011. Passenger transport mode shares in world cities. Journeys 7, 60–70.
20. Moniruzzaman, M., Páez, A., 2012. Accessibility to transit, by transit, and mode share: application of a logistic model with spatial filters. J. Transp. Geogr. 24 (3), 198–205.
21. Ratner, K.A., Goetz, A.R., 2013. The reshaping of land use and urban form in Denver through transit-oriented development. Cities 30 (1), 31–46.
22. Mark W, & Jonathan T., 2000. Rail network accessibility and the demand for inter-urban rail travel. Transport Reviews, 20(1), 3-24.
23. Cervero R., Kovkelman K., 1997. Travel demand and the 3Ds: density, diversity and design.
Transport. Res. D-Transport Environ. 2 (3), 199–219.
modes of travel: the single occupant vehicle, transit, and walking. Transport. Res. Rec. 1466, 44–52.
25. Levinson, J., Kumar, A., 1997. Density and the journey to work. Growth Change 28, 147–172. 26. Loo, B.P.Y., 2009. How would people respond to a new railway extension? The value of
questionnaire surveys. Habitat Int. 33, 1–9.
27. Ewing R, Greenwald M J, Zhang M, et al., 2009. Measuring the impact of urban form and
transit access on mixed use site trip generation rates-portland pilot study. Washington D C: US Environmental Protection Agency.
28. Wu K, 2009. Theory and practice of sustainable ecological communities. Taibei: CHAN’ S
Arch-Publishing.
29. Daniel G. Chatman., 2013. Does tod need the t?. Journal of the American Planning Association, 79(1), 17-31.
30. Renne, J. L., Hamidi, S., & Ewing, R., 2016. Transit commuting, the network accessibility effect, and the built environment in station areas across the united states. Research in Transportation Economics, 60, 35-43.
31. Houston, D., Ferguson, G., & Spears, S., 2015. Can compact rail transit corridors transform the automobile city? planning for more sustainable travel in los angeles. Urban Studies, 52(5), 938-959.
32. Loo, B. P. Y., Chen, C., & Chan, E. T. H., 2010. Rail-based transit-oriented development: lessons from New York city and Hong Kong. Landscape & Urban Planning, 97(3), 202-212. 33. Du, J., 2009. Fare analysis of Shanghai Metro. Business Culture, 9, 105-106.
34. Krosche J, Boll S., 2015. The xPOI Concept. First International Workshop on Location and
Context Awareness, Oberpfaffenhofen, Germany.
35. Bryk, A. S., & Raudenbush, S. W., 2002. Hierarchical linear models:, applications and data analysis methods. Publications of the American Statistical Association, 98(463), 767-768. 36. Ewing, R., Greenwald, M., Zhang, M., Walters, J., Feldman, M., Cervero, R., et al., 2011.
Traffic generated by mixed-use developments e A six-region study using consistent built environmental measures. Journal of the Urban Planning and Development, 137(3), 248-261. 37. Ewing, R., Greenwald, M. J., Zhang, M., Bogaerts, M., & Greene, W., 2013. Predicting
transportation outcomes for LEED projects. Journal of Planning Education and Research, 33(3), 265-279.
38. Misra, S., Cheng, L., Genevie, J., & Yuan, M., 2016. The iPhone effect the quality of in-person social interactions in the presence of mobile devices. Environment and Behavior, 48(2), 275-298.
39. Weinberger R, Seaman M, Johnson C., 2009. Residential Off- Street Parking Impacts on Car
Ownership, Vehicle Miles Traveled and Related Carbon Emissions. Transportation Research Record, (2118), 24-30.
40. Weinberger R., 2012. Death by a Thousand Curb- Cuts: Evidence on the Effect of Minimum