1
Analysis of shear failure of surface methane capture boreholes for improving efficient drainage period–A
lithology perspective
Hongjie Xu a, *, Zezhong Fang a, Shuxun Sang b, *, Jingfen Yang a, Huihu Liu a, Hai Ding c, Xinzhao Dou c
aSchool of Earth Science and Environmental Engineering, Anhui University of Science and Technology, Huainan,
Anhui 232001, China
bSchool of Resources and Geoscience, China University of Mining and Technology, Xuzhou, Jiangsu 221008, China
cResearch Institute of Geological Exploration, Anhui Provincial Coalfield Geological Bureau, Hefei 230088, China
Abstract: The shear failure of surface methane capture borehole (SMCB) is the main cause of shortening life cycle
of SMCB but lack of lithological analysis. In order to improve the stability of SMCB and improve efficient drainage
period, it is of great significance to investigate the lithology performances for shear failure of SMCB. Based on the
direct shear tests and geological method, the results shows that the shear displacement increases as the grain size
decreases. Mechanical jump occurs at the lithological boundaries, which is mainly determined by the composition of
rock specimens. The cohesion is the mainly possible reason for the step change of shear strength. Lithology with high
quartz and low clay may effectively improve shear strength and failure resistance. Boreholes drilled into the weaker
siltstone and mudstone sections may potentially experience preferential damage due to the larger shear displacement
and shear strength. Protective measures at these sections may improve the stability of the borehole casing. The
probing data where it was found that boreholes closure validated the prediction.
Key words: Lithology performance; shear failure; surface methane capture borehole; shear strength
1 Introduction
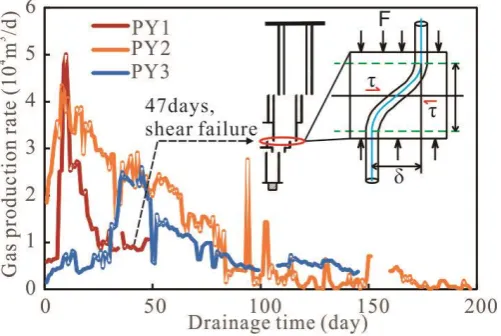
Drawing surface methane capture borehole (SMCB) around a coal panel is effective method to reduce the
methane content of the coal seams [1-3]. SMCB is completed prior to the face retreat and extract the methane in the
Huaibei, Yangquan and Tiefa in China where the permeability of coal reservoirs is rather low, and a great amount of
methane with high concentration [4]. However, when a working face passes near a SMCB, the borehole is likely to
become deformed or even damaged, and the production of the borehole would drop greatly and even emthane
drainage may be suspended (Fig. 1), causing a huge economic loss [5]. For example, 12 of 22 SBCMs in the Huainan
coal field ceased to produce gas as a result of borehole failure, adversely affecting the extraction efficiency [6].
Fig.1. Shear failure of methane capture borehole (τ, horizontal shear stress; δ, shear displacement; d, shear field).
To reduce the probability of borehole failure, previous researches on borehole failure mainly focused on
evaluating drilling design, including the well construction and trajectory, casing material, drilling fluid and typically
assuming that the rock material is isotropic, linear elastic and homogeneous in deformability and strength[7-9], and
extending analyses to anisotropic strength of lithology [10-13] and geostress [14-16].Borehole failure is also
influenced by the chemical-mechanical or physical-mechanical interactions between clay minerals and drilling fluids
as well as groundwater [17, 18], but these effects may be applied to improve drilling methods and maximize the
effectiveness of drilling [19-21].
Despite the recent progress reviewed in the stability of hydrocarbon wells, relatively fewer results are available
to define stability under the influence of overlying strata movement [22]. One reason is that the importance of coalbed
methane reservoirs has only become an important issue relatively recently [23]. However, the estimation of stability
Researchers have conducted many studies about coal mining factors [24, 25], geological conditions of overburden
[26, 27], failure modes of the borehole casing during mining [28], examination of shear failure through applying
shear stress on the well material [26, 29-31] and computational modellings for predicting the stability of well during
the extraction life of an active coal panel [5, 28, 32, 33] and the influence of topographic and lithology performance
on shear deformation in overburden [22, 34]. Three typical failure modes of the borehole casing were classified, and
the tensile and shear failure were thought to be the most common failure modes [28].
Due to the different lithology of the overlying strata, the acting force and shear displacement exerted on the
borehole is greatly different. Despite the recent contributions, few analyses exist on the lithology influence on shear
failure for SMCB piercing mined coal seams due to experimental difficulties with overlying strata movement and
shear displacement in geological conditions. Accordingly, in this paper, direct shear tests of lithological specimens
were performed to analyze the change of shear stress on the shear displacement in order to verify the results of the
lithology performances for shear failure. Moreover, abundant mechanical parameters are used to justify the results
obtained by using the method of direct shear tests and indicate the effect of overlying strata lithology on the possible
shear location of the borehole. Therefore, we use this analysis to predict vertical locations where the borehole is prone
to fail or more specifically disruption by shear offset with lithology.
2 Experiments and methods
2.1 Specimen preparation
For the shear tests, the rock specimens were taken from a borehole in coal-bearing strata in Huainan mining area,
Anhui Province, China. In order to understand the shear strength of lithological geology, the utilized specimens
include coarse sandstone, medium sandstone, fine sandstone, siltstone and mudstone, which are the most
representative and natural lithology types without obvious macroscopic cracks. In addition, it is difficult to collect
specimens in 5 groups were performed using the direct shearing machine.
These core samples were properly packed, and then were sent to the laboratory immediately after classification
and packing. During the sample preparation process, core samples with a diameter of 50 mm were cut at a ratio of
1:1 in the aspect ratio in accordance with the GB/T 50266-2013. After cutting, each surface of all samples was ground
to ensure a flat surface. Fig 2 presents parts of specimens before and after direct shear tests, and apparent shear failure
planes occurred in the middle of the specimens after completed tests. The sample number shown in Table 1 is provided
as follows: the first digit indicates the rock lithology, and the second digit indicates the sequential number of the
specimens in each group.
Fig. 2 Parts of specimens before and after direct shear tests.
2.2 Tests apparatus
In this study, the direct shear tests on core specimens were performed using a multi-functional testing machine
and manufactured in the State Key Laboratory of Geohazard Prevention and Geoenvironment Protection of Chengdu
University of Technology, China. Despite it would be more accurate to measure shear strength of soil using tri-axial
apparatus with considering the applying confinements in the field, the direct shear apparatus was considered adequate
Fig.3 shows the direct shear test apparatus to examine failure behavior of lithology instead of applying shear
stress on the well material. Two hydraulic jacks controlled by pressure oil pumps are fixed in the top and right side
of the stiff loading frame, respectively. The maximum loads provided by the two hydraulic jacks are 294 kN and 490
kN with oil cylinder maximum trip of 60 mm, respectively. The device has lower and upper shear boxes equipped
with one row of ball bearings. The lower shear box is fixed, and the upper shear box can produce dislocation. The
upper and lower shear rings are placed in the inner hole of the shear box which is consisted of four surface ground
steel. Appropriate size and shape of shear rings are designed(Fig.3d).
Measured data from 8 channels can be collected simultaneously. The sensors and the other instruments were
calibrated as required before each sample was tested. The range of pressure sensor and displacement is 0-40 MPa and
0-50 mm with a resolution of 0.01 MPa and 0.01 mm, respectively.
Fig.3 Test system of specimen in direct shear test (a, Direct shear test apparatus; b, Lower shear box; c, Upper shear
box; d, shear rings; e, Experimental device; f, Ball bearings).
2.3 Test procedure
In this study, the testing procedure followed the Chinese standard GB/T50266-2013. Five specimens in each
group were applied with normal stress of 2, 3, 4, 5 and 6 MPa, respectively. The usual test procedure adopted for
conducted direct shear tests calls for a constant normal load (CNL) to be applied with the horizontal load being
gradually increased until sliding takes place. The test process includes two main steps: (1) load the initial normal
(a)
(b)
(c)
(d)
(e)
stress to the desired value at a loading rate of 0.08 kN/s; (2) load the shear stress until the failure of specimen occurs
with a constant shear speed of 0.2 mm/min. In the process of direct shear, the rock would dilate when it was destroyed,
then the tested data of the normal stress may be inconsistent with the set normal stress. In these tests, the shear
displacements and loads in the normal and shear directions were recorded automatically throughout the test.
2.4 Estimating method of shear strength
The volume of the standard specimen was calculated by measuring the cross-sectional area and height of the
sample, then the mass of the specimen was weighed. The density of the rock block can be obtained by using the
relationship between volume and quality. The normal stress and shear stress can be calculated by the following
formula respectively:
0
(I -I )
j
S G
S
= + (1)
0
( ) h
j
I I S
S
= − (2)
Where, σ is the normal stress, MPa; Iσ, set pressure value of normal cylinder, MPa; Iσ0, initial normal pressure applied
on the sample, MPa; Iσ0, piston area of normal cylinder, m2; G, total weight of iron and ball bearing, MN; Sj , shear
area of the sample, m2; τ, shearing strength, MPa; I, maximum value of shear load, MPa; Sh,piston area of shear
cylinder, m2.
One many now use the Mohr-Coulomb criterion (Eq. (3)) to express the peak and residual shear strengths versus
the normal stress as shown in Fig. 4 according to the obtained cohesion and friction angle:
τ = c + 𝜎𝑛𝑡𝑎𝑛𝜑 (3)
whereτ, c, 𝜎𝑛 and 𝜑 are shear strength, cohesion, normal stress and friction angle, respectively [35].
The applied experimental data used in this study, such as Poisson’s ratio, elasticity modulus, compressive
strength, tensile strength, angle of internal friction and cohesion were collected from the results of tests and
polarizing microscope, scanning electron microscope equipped with a ZEISS SIGMA system.
3 Results and discussions
3.1 Shear failure characteristics
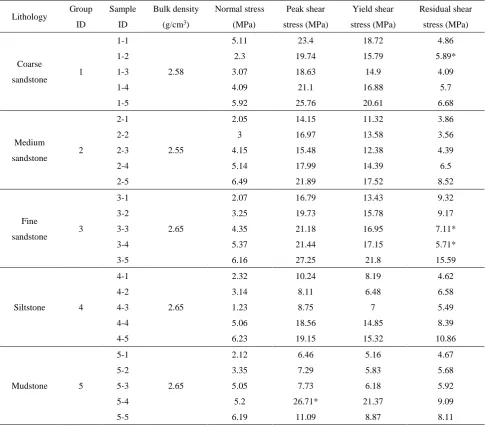
Peak and residual tests were carried out for each sample according to the test program. Tests in residual state
were conducted to estimate the residual shear strength parameters. Results of all direct shear tests on rock specimens
are summarized in Table 1. Although the experiments were carried out carefully according to specific methods, some
tested parameters were of poor quality and omitted for the heterogeneity of rocks, such as 1-2, 3-3, 3-4 and 5-4
specimens in Table 1.
Table 1 Direct shear testing results for rock specimens.
Lithology Group
ID
Sample
ID
Bulk density
(g/cm3)
Normal stress (MPa) Peak shear stress (MPa) Yield shear stress (MPa) Residual shear stress (MPa) Coarse sandstone 1 1-1 2.58
5.11 23.4 18.72 4.86
1-2 2.3 19.74 15.79 5.89*
1-3 3.07 18.63 14.9 4.09
1-4 4.09 21.1 16.88 5.7
1-5 5.92 25.76 20.61 6.68
Medium
sandstone 2
2-1
2.55
2.05 14.15 11.32 3.86
2-2 3 16.97 13.58 3.56
2-3 4.15 15.48 12.38 4.39
2-4 5.14 17.99 14.39 6.5
2-5 6.49 21.89 17.52 8.52
Fine
sandstone 3
3-1
2.65
2.07 16.79 13.43 9.32
3-2 3.25 19.73 15.78 9.17
3-3 4.35 21.18 16.95 7.11*
3-4 5.37 21.44 17.15 5.71*
3-5 6.16 27.25 21.8 15.59
Siltstone 4
4-1
2.65
2.32 10.24 8.19 4.62
4-2 3.14 8.11 6.48 6.58
4-3 1.23 8.75 7 5.49
4-4 5.06 18.56 14.85 8.39
4-5 6.23 19.15 15.32 10.86
Mudstone 5
5-1
2.65
2.12 6.46 5.16 4.67
5-2 3.35 7.29 5.83 5.68
5-3 5.05 7.73 6.18 5.92
5-4 5.2 26.71* 21.37 9.09
Note: *, invalid data.
For each test specimen, graphs of shear stress versus shear displacement were plotted. As illustrated in Fig. 4,
all curves have similar trend that the shear stress level dropped to a residual state after the peak strength. The shear
displacement of most specimens increases with an increasing shear stress, showing a large slope. After the shear
stress reaches the peak strength, the shear stress decreases dramatically as the shear displacement increases. However,
some specimens show a significant increase of shear displacement with slowly increased shear stress at the initial
stage, such as 3-2 and 4-3 specimens.
The shear curve increases significantly after the shear displacement reached a certain value (about less than 0.5
mm to 1.0 mm) until the peak stress is reached, and a change of shear stress occurs at the peak. The slope of the curve
changes from positive to negative with a noticeable trend, indicating obvious brittle failure characteristic of the
lithological specimens with a release of cohesion. As the displacement continues, the shear stress falls to a certain
residual value that then remains constant, even for larger shear displacements. The residual stress varies greatly,
generally about 21%-78% of the peak stress. It indicates that the specimen has been completely destroyed, but still
has a certain load capacity under external force.
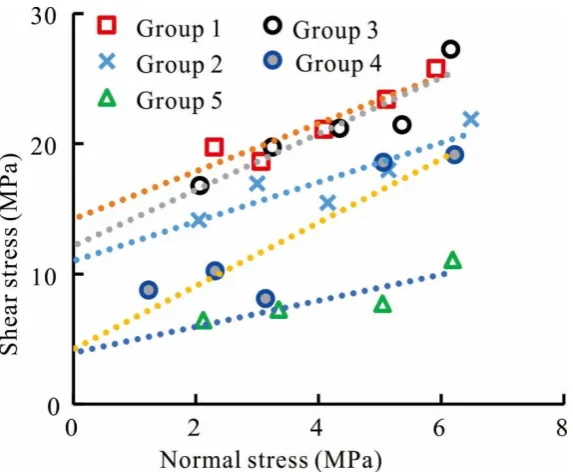
In addition, five different normal stress levels were considered to study the effect of normal stress on the shear
behavior of rock samples. The peak shear strengths of five lithology groups follows an increase with the increasing
of normal stress. According to the data obtained from 5 groups of direct shear test results, the relationship between
the peak shear strength and normal stress expressed by the Mohr-Coulomb criterion, Eq. (3) are plotted as shown in
Fig. 5 Shear strength curve of the specimens (Group 1, τ=14.23+1.83σ, R2=0.88; Group 2, τ=11.00+1.51σ, R2=0.80; Group 3,
τ=12.17+2.15σ, R2=0.85; Group 4, τ=4.22+2.43σ, R2=0.82; Group 5, τ=4.01+1.05σ, R2=0.58).
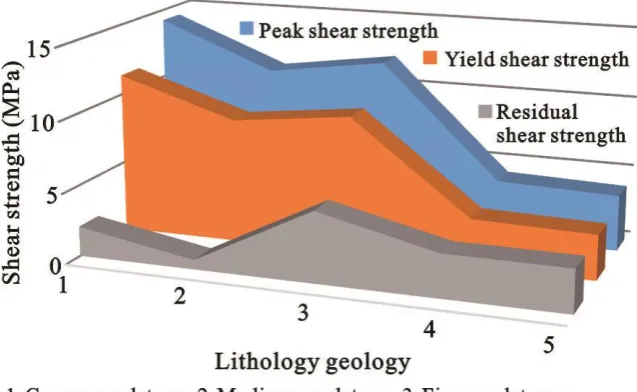
3.2 Influence of lithology on mechanical parameters
Fig. 6 shows that the residual strength of the specimens with different lithology was substantially smaller than
the peak strength. With the lithology changes from coarse sandstone to mudstone (the grain size changes from coarse
to fine), the magnitude of peak shear stress strength and yield shear strength takes on reducing trends, which is most
obvious from siltstone to mudstone as shown in Fig. 6.
Coarse-grained lithology has a larger stress drop than fine-grained lithology. Generally, the process of stress
drop is essentially a process of gradual penetration of fracture surface. However, as shown in Fig. 5, there is no
significant change in the friction angle of all specimens, indicating that the crucial change of peak strength and yield
strength is mainly caused by cohesion. The change of stress drop values with lithology indicates that the cohesion
changes from large to small when the lithological grains change from coarse to fine. With the change of lithology,
the more the clay content is, the more the strength is reduced. The drop value has a certain relationship with the
cohesive force [36]. Compared with lithology composed of fine grain size, lithology with coarse grain has smaller
Fig. 6 Variation of shear strength showing influence of lithology geology.
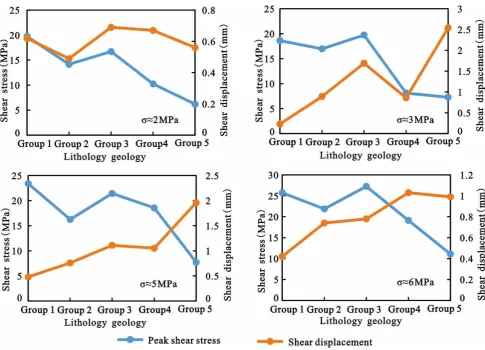
By comparing the relationship between peak shear stress and shear displacement under different normal stresses
(Fig. 7), it can be found that the peak shear stress generally shows a decreasing trend corresponding to the increasing
shear displacement with the decrease of clastic grain size of rock composition under a given similar normal stress.
When the normal stresses are 2, 3, 5, and 6 MPa, the change of the shear stress vs. lithology curves indicates that the
peak shear strengths of the specimens follows an decrease with decreasing grain size of changing lithology. In
addition, the shear displacements increases gradually from coarse sandstone to mudstone. Thus, the variation of the
shear strength and displacement with different lithology specimens indicates that grain size of different lithology has
an important effect on shear strength. The smaller the grain size of lithology, the smaller the peak shear stress and the
larger the shear displacement. Namely, the rock with small grain composition tends to give priority to shear failure
Fig.7 Variations of the peak shear stress and shear displacement vs. lithology geology with normal stresses of 2, 3, 5 and 6 MPa.
In order to better understand the mechanical properties of different lithology geology, about 330 tested
mechanics parameters of coal-bearing rock samples were collected from Huainan mining area, China. Fig. 8 depicts
the main mechanical parameters of these lithology samples. The lithology geology changing from medium sandstone
to fine sandstone, siltstone and mudstone, namely, the decrease of the grain diameter, shows a step drop of mechanical
parameters when the lithology changes, which behaves as grain diameter softening [37]. As data shown in Fig.8, The
mechanical parameters of rock samples, such as compressive strength, tensile strength, cohesion and elastic modulus
have two obvious changes on the boundary of medium and fine sandstone, fine sandstone and mudstone. It is evident
that medium and fine sandstone has the same mechanical parameters (Fig.8), which is not expected due to the change
in lithology. This may be related to the fact that the cement of medium and fine sandstones is mainly quartz with
indicates that the increasing of quartz may be limited to improve the mechanical strength of rocks in the study area.
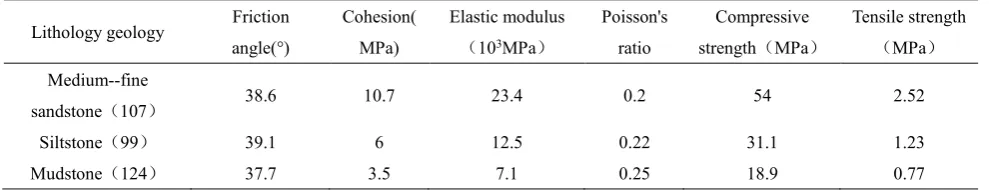
If these samples are classified as medium-fine sandstone, siltstone and mudstone, the average values of some
mechanical parameters of them are summarized in Table 2. Taking medium-fine sandstone as the datum, the cohesion
of siltstone and mudstone decreases by 44% and 67%, the elastic modulus by 47% and 70%, the compressive strength
by 42% and 65%, the tensile strength by 51% and 69%, and the Poisson's ratio increases by 9% and 12%, respectively.
However, the poisson ratio goes up step by step and the friction angle has no obvious change.
Fig. 8 Variation of some mechanical parameters from collected 330 samples (ID 1-34, medium sandstone; ID 35-107, fine sandstone; ID
108-206, siltstone; ID 207-330, mudstone).
Table 2 Average values of mechanical parameters obtained from collected 330 samples.
Lithology geology Friction
angle(°)
Cohesion( MPa)
Elastic modulus (103MPa)
Poisson's ratio
Compressive strength(MPa)
Tensile strength (MPa) Medium--fine
sandstone(107) 38.6 10.7 23.4 0.2 54 2.52
Siltstone(99) 39.1 6 12.5 0.22 31.1 1.23
Mudstone(124) 37.7 3.5 7.1 0.25 18.9 0.77
3.3 lithology performances for shear failure of SMCBs
Based on the statistical results shown in Fig. 8 and Table 2, the siltstone and mudstone composed of fine particles
have generally lower shear strength than the medium-fine sandstone (Fig. 9a). There is no obvious change in the
internal friction angle of different lithological samples, suggesting that the shear strength and shear displacement are
mainly determined by cohesion of them. When the grain size of rock mineral composition increases to the sand-size,
9b).
Fig. 9 Lithology performances for mechanical parameters caused by mineral compositions (b is modified from Meng et al., 2000).
In addition, some factors such as cementation also play an important role in the mechanical properties of rock
shear. The observed particle-supported sandstone sample generally shows high mechanical strength with siliceous
and ferruginous cementation (Fig.10a). However, the siltstone and mudstone, mainly composed of clay and sliced
mica, have low mechanical strength for their developed inter-fracture and weak stiffness. Compared with sandstone,
mudstone has high clay content with poor argillaceous cementation (Fig.10b). The clay minerals by X-ray diffraction
analysis is 59.0%, and the proportion of kaolinite and the mixed layer of illite and smectite in clay minerals can reach
40% or more [38]. As shown in Fig. 10c, a large amount of flaky clay minerals in the mudstone samples can be
observed by scanning electron microscopy. The flaky texture with weak interlayer mechanics interaction provides
the possibility of microscopic shear and slippage.
Thus, the mineral composition and cement of mudstone can significantly weaken its mechanical strength. To
sum up, with the decrease of the grain diameter of lithology rocks (lithology geology from sandstone to mudstone),
decreasing quartz and increasing clay minerals are the important factors for the decrease of shear strength and
cohesion, which further leads to weakening of shear strength of lithology rock. Therefore, the lithology performance
failure for SMCB in drilled strata.
Fig. 10 Thin-sections and SEM photomicrographs showing diagenetic minerals of sandstones and mudstones in coal-bearing strata in
Huainan mining area. (a) Sandstone displays the wide array of medium-grained quartz with approximately 80% of the rock composition.
The majority of framework grains showing porous cementation. Minor amounts of siderite cements quartz grains. Detrital silty mudstone
grain is present in small quantities as a matrix within the grain-supported sand. Cross-polarized light. (b) Silt-bearing mudstone showing
a majority grains are silt-grained and clay, about 10% and 90%, respectively. The detrital composition is mainly quartz with a small
amount of feldspar. Minor amounts of the detrital grain size is 0.08 mm. Cross-polarized light. (c) SEM photomicrograph showing
relatively textural, flaky clay minerals of mudstone.
Moreover, there may be many failures for methane capture borehole around the panel because of mining. The
lithology performance and possible optimal location of shear failure is analyzed, but other factors such as geological,
structural plane and dip angle may affect the lithology performance for shear failure. The cohesion of structural plane
is generally 0.005-1.0 [39], which shows significant difference compared to rocks. In a conventional way, the thick
interlayer will decrease the shear strength of structural plane, and increased filling particles implies decreased shear
strength. As for the mudstone interlayer, the increase of water content will also cause an obvious decrease of the
cohesion and friction coefficient of the structure surface [40].
The conclusions are reasonable and coincide with the engineering practice. Fig.11 displays stratigraphic sections
of the overlying strata in some damaged boreholes induced by shear failure, and these sections are mainly mudstone,
siltstone and lithological boundaries. Compared with the failure of rock masses of different lithology geology, the
driving force required for generating slippage and instability along the structural surface is smaller, and the shear
failure caused by structural plane is more preferential.
Fig. 11 Stratigraphic sections of the strata in some damaged boreholes in the Huainan mining area (Modified from [41]).
However, the shear failure of casing is affected by overlying strata movement, mining engineering and
geological conditions, etc. Tested mechanical properties are related to physical properties of rock mass such as water
content and porosity, as well as the processing and loading of specimens. The lithology performance for shear failure
of SMCB is only obtained from the tests carried out with few specimens in this paper, and the conclusions still need
to be further studied.
4 Conclusions
In this study, the direct shear test under constant normal condition was carried to investigate the shear responses
of lithology specimens. The effects of the displacement and shear strength on the lithology performance and shear
failure possibility of specimens are highlighted. Several conclusions are drawn as follows:
(1) Lithology specimens show that the shear strength linearly increases with the increase of initial normal stress.
Nearly all specimens of shear stress show the tendency to increase first and then decrease as the shear displacement
increases, indicating obvious brittle failure characteristics.
the shear stress has obvious trend of decreasing with significant shear displacement. Therefore, in the section of
siltstone, mudstone and structural plane with weak mechanical properties, the casing is more likely to undergo shear
displacement to shear failure. Protective measures at these sections may improve the stability of the borehole casing.
(3) The jump of the rock mechanics properties at the lithological boundaries is in response to the changes of
lithological grain size, which is mainly determined by the composition of rock specimens. The cohesion is the main
reason for the step change of shear strength. The lithology sections which have low content of quartz and high content
of clay, may be have poor shear strength and failure resistance, and they are the highest possible failure sections of
the borehole from the surface to the coal seam.
Acknowledgements
This work was supported by the National Natural Science Foundation of China (Grant No. 41727801), the Key
Research and Development Program of Anhui Province (Grant No. 1804a0802203) and Program of Study Abroad
for Young Scholar sponsored by Education Department of Anhui Province (gxgwfx2019012). We thank Huainan
Mining Group providing the test results.
References
[1] Feng G, Hu S, Li Z, Jiang H, Zhang Y, Xu G, et al. Distribution of methane enrichment zone in abandoned coal
mine and methane drainage by surface vertical boreholes: A case study from China. Journal of Natural Gas Science
and Engineering. 2016;34:767-78.
[2] Karacan CÖ. Analysis of gob gas venthole production performances for strata gas control in longwall mining. Int
J Rock Mech Min Sci. 2015;79:9-18.
[3] Yuan L. Control of coal and gas outbursts in Huainan mines in China: A review. Journal of Rock Mechanics and
Geotechnical Engineering. 2016;8:559-67.
[4] Sang S, Xu H, Fang L, Li G, Huang H. Stress relief coalbed methane drainage by surface vertical wells in China.
International Journal of Coal Geology. 2010;82:196-203.
[5] Liu Y, Zhou F, Geng X, Chang L, Kang J, Cui G, et al. A prediction model and numerical simulation of the location
and Engineering. 2017;37:178-91.
[6] Huang H, Sang S, Fang L, Li G, Xu H, Ren B. Optimum location of surface wells for remote pressure relief
coalbed methane drainage in mining areas. Mining Science and Technology (China). 2010;20:230-7.
[7] Bradely WB. Failure on inclined boreholes. Journal of Energy Resources Technology. 1979;102:232-9.
[8] Santarelli FJ, Brown ET, Maury V. Analysis of Borehole stresses using pressure-dependent, linear elasticity. Int J
Rock Mech Min Sci. 1986;23:445-9.
[9] Kiran R, Teodoriu C, Dadmohammadi Y, Nygaard R, Wood D, Mokhtari M, et al. Identification and evaluation
of well integrity and causes of failure of well integrity barriers (A review). Journal of Natural Gas Science and
Engineering. 2017;45:511-26.
[10] Périé P-J. Laboratory investigation of rock fracture around boreholes: University of California, Berkeley; 1990.
[11] Ajalloeian R, Lashkaripour GR. Strength anisotropies in mudrocks. Bulletin of Engineering Geology and the
Environment. 2000;59:195-9.
[12] Lee H, Ong SH, Azeemuddin M, Goodman H. A wellbore stability model for formations with anisotropic rock
strengths. Journal of Petroleum Science and Engineering. 2012;96-97:109-19.
[13] Tien YM, Kuo MC, Juang CH. An experimental investigation of the failure mechanism of simulated transversely
isotropic rocks. Int J Rock Mech Min Sci. 2006;43:1163-81.
[14] Addis MA, Wu B. The role of the intermediate principal stress in wellbore stability studies: Evidence from
hollow cylinder tests. International Journal of Rock Mechanics and Mining Science. 1993;30:1027-30.
[15] Song I. Borehole breakouts and core disking in westerly granite: mechanisms of formation and relationship in
situ stress: University of Wisconsin--Madison; 1998.
[16] Yan W, Zou L, Li H, Deng J, Ge H, Wang H. Investigation of casing deformation during hydraulic fracturing in
high geo-stress shale gas play. Journal of Petroleum Science and Engineering. 2017;150:22-9.
[17] Haimson BC, Song IJIJoRM. Laboratory study of borehole breakouts in Cordova Cream: a case of shear failure
mechanism. International Journal of Rock Mechanics Mining Sciences. 1993;30:1047-56.
[18] Zeynali ME. Mechanical and physico-chemical aspects of wellbore stability during drilling operations. Journal
of Petroleum Science and Engineering. 2012;82-83:120-4.
[19] Supon SB, Adewumi MA. An Experimental Study of the Annulus Pressure Drop in a Simulated Air-Drilling
Operation. SPE-19334-PA. 1991;6:74-80.
[20] Bennion DB, Thomas FB, Bietz RF. Low Permeability Gas Reservoirs: Problems, Opportunities and Solutions
Society of Petroleum Engineers; 1996. p. 15.
[21] Clancey BM, Khemakhem ASD, Bene TF, Schmidt MH. Design, Construction And Optimization Of Big-Bore
Gas Wells In A Giant Offshore Field. SPE/IADC Drilling Conference. Amsterdam, The Netherlands: Society of
Petroleum Engineers; 2007. p. 9.
[22] Liang S, Elsworth D, Li X, Yang D. Topographic influence on stability for gas wells penetrating longwall mining
areas. International Journal of Coal Geology. 2014;132:23-36.
[23] Wang Y, Watson R, Rostami J, Wang JY, Limbruner M, He Z. Study of borehole stability of Marcellus shale
wells in longwall mining areas. Journal of Petroleum Exploration and Production Technology. 2014;4:59-71.
[24] Xu H, Sang S, Fang L, Huang H, Ren B. Failure characteristics of surface vertical wells for relieved coal gas
and their influencing factors in Huainan mining area. Mining Science and Technology (China). 2011;21:83-8.
[25] Zhang J. Analysis on the main control factors of deformation and failure for surface gas extraction drilling.
Safety in Coal Mines. 2012;43:149-53.
[26] Peng S, Fu J, Zhang J. Borehole casing failure analysis in unconsolidated formations: A case study. Journal of
Petroleum Science and Engineering. 2007;59:226-38.
[27] Diwan P, B P Kumar Pandey D, Dharmendra G, Ayyappan S. A fresh look at wellbore stability analysis to
sustainable development of natural resources: Issues and opportunities. International Journal of Science Technology
& Management. 2011;2:55-63.
[28] Chen J, Wang T, Zhou Y, Zhu Y, Wang X. Failure modes of the surface venthole casing during longwall coal
extraction: A case study. International Journal of Coal Geology. 2012;90-91:135-48.
[29] Sun H, Zhang Y. Analysis on Deformation and Fracturing Factors of Surface Gas Drainage Holes and Preventive
Measures. Mining Safety & Environmental Protection. 2010;37:79-81.
[30] Li RF, Liang YP, Ou C, Mou JS. Analysis on stability factors of surface boreholes for gob gas drainage and
Extraction2008.
[31] Davies RJ, Almond S, Ward RS, Jackson RB, Adams C, Worrall F, et al. Oil and gas wells and their integrity:
Implications for shale and unconventional resource exploitation. Mar Pet Geol. 2014;56:239-54.
[32] Whittles D, Lowndes I, Kingman S, Yates C, Jobling S. The stability of methane capture boreholes around a
long wall coal panel. International Journal of Coal Geology. 2007;71:313-28.
[33] Liu C, Zhou F, Yang K, Xiao X, Liu Y. Failure analysis of borehole liners in soft coal seam for gas drainage.
Eng Failure Anal. 2014;42:274-83.
of surface well for released coal gas. Journal of Mining & Safety Engineering. 2011;28:90-5.
[35] Hoek E. Practical rock engineering. Canada: North Vancouver; 2000.
[36] Zhang G, Yinping LI, Yang C, Wang L, Yang C. Discussion on relationship between post-peak curves and shear
strength parameters of rock subjected to direct shear tests. Chinese Journal of Rock Mechanics and Engineering.
2012;31:2981-8.
[37] Meng Z, Peng S, Qu H. Relationship between composition and texture of sedimentary rock and its mechanical
properties in the roof and floor. Chinese Journal of Rock Mechanics and Engineering. 2000;19:136-9.
[38] Xu HJ, Hu BL, Liu HH, Zheng JB, Zhang WY, Zheng KG. Reservoir characteristics and its physical origin of
shale gas in coal measure in the Lower Permian Shanxi Formation in Huainan coal field. Natural Gas Geoscience.
2015;26:1200-10.
[39] Brady BHG. Rock Mechanics for underground mining Third edition. In: Brown ET, editor. Springer Netherlands:
Dordrecht; 2006.
[40] Papaliangas T, Hencher SR, Lumsden AC, Manolopoulou S. The effect of frictional fill thickness on the shear
strength of rock discontinuities. International Journal of Rock Mechanics and Mining Sciences & Geomechanics.
1993;30:81-91.
[41] Xu HJ, Sang SS, Huan HZ, Liu HH, Wu J, Ren B, Han JZ. Geological mechanism of failure surface vertical
boreholes for relieved methane drainage in coal mining area. Hydrogeology & Engineering Geology. 2014; 41: