Article
1
Flood Potential Mapping of Pesanggrahan River
2
Watershed in South and West Jakarta with LIDAR
3
Data Segmentation
4
Indra Riyanto1,2*, Lestari Margatama1, S. Samsinar1, Babag Purbantoro3,4, Luhur Bayuaji5, Dodi
5
Sudiana2, and Josaphat Tetuko Sri Sumantyo3
6
1 Center for Environmental Studies, Universitas Budi Luhur, Indonesia; [email protected]
7
2 Department of Electrical Engineering, Faculty of Engineering, University of Indonesia, Indonesia;
8
3 Center for Environmental Remote Sensing, Chiba University, Japan
9
4 Indonesian Aeronautical Institute of Aeronautics and Space, Indonesia
10
5 Faculty of Computer Systems & Software Engineering, Universiti Malaysia Pahang, Malaysia
11
* Correspondence: [email protected]; Tel.: +62-815-900-2864
12
13
Abstract: Degradation of environment quality is currently the prime cause of the recent occurrence
14
of natural disasters; it also contributes in the increase of the area that is prone to natural disasters.
15
This research is aimed to map the potential of areas around Pesanggrahan river in DKI Jakarta by
16
segmenting the Digital Elevation Model derived from LIDAR data. The objective of this
17
segmentation is to find the watershed lines of the DEM image. Data processing in this research is
18
using LIDAR data which take the ground surface data, which is overlaid with Jakarta river map
19
and subsequently, the data is then segmented the image. The expected result of the research is the
20
flood potential area information, especially along the Pesanggrahan river in South Jakarta.
21
Keywords: Flood mapping; Urban flood potential; LIDAR; image segmentation; Digital Surface
22
Model; Digital Elevation Model.
23
24
1. Introduction
25
Jakarta’s rapid growth without sufficient water supply system results in high sub-surface water
26
usage, which in turn causes land subsidence. Degradation of the city’s drainage and sewer system,
27
including downtown rivers further makes this complicated. Flood is concentration of water in the
28
flat area around the river as a result of overflow of river water that cannot be accommodated by the
29
river. In addition, flooding is a phenomenon that almost always happens every year in Jakarta. One
30
aspect that is often overlooked is that the flood is closely related to the unity of the so-called
31
watershed (Daerah Aliran Sungai or DAS) [1]. In addition to flooding, problems that occur in the
32
watershed include increased erosion and sedimentation, reduced land productivity, and
33
acceleration of land degradation and river water pollution [2-3].
34
This study aims to map flood-prone areas based on 5-year flood data that can clarify water level
35
rise by using remote sensing data in the form of Digital Surface Model data as any existing surface
36
shape such as tree height, buildings and any objects on the ground. This research is expected to
37
compare the results of the DSM data segmentation as which will produce accurate data on the
38
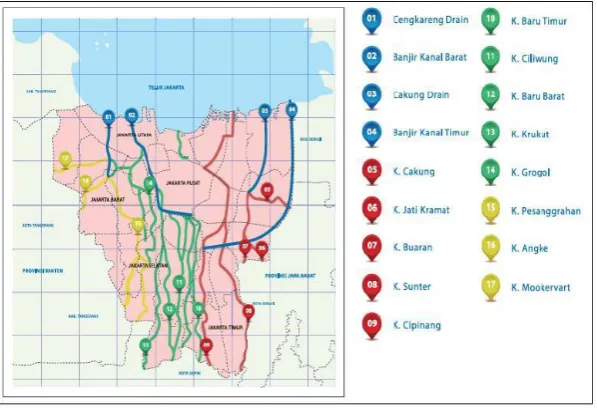
prediction of the flood. Remote Sensing is the science and art of obtaining information about an
39
object, region or phenomenon through analysis of data obtained by a device without direct contact
40
with the object, area or phenomenon under study [4].
41
42
43
2. Materials and Methods
44
2.1. Digital Surface Model
45
DSM is a digital surface model or can be interpreted as a model of digital surface. DSM is also
46
an elevation model that displays surface heights; DSM displays any existing surface shapes such as
47
tree height, buildings and any objects on the ground. DSM is a system, model, method, and tool in
48
collecting, processing, and presentation of terrain information. The arrangement of digital values
49
representing the spatial distribution of the field characteristic, the spatial distribution represented by
50
the values in the horizontal coordinate system x, y and the field characteristics are represented by
51
the field altitude in the Z coordinate system [3].
52
One method to obtain surface model is through the use of Synthetic Aperture Radar (SAR)
53
which uses radar reflection to determine the shape of the ground surface under the buildings,
54
vegetation, and even water bodies [5, 6]. This work is also in conjunction with image
55
processing-based flood early warning method using ALOS/PALSAR image [5], and to further extent
56
is also supporting the research on land deformation in Jakarta city area [6, 7].
57
2.2. Data Preparation
58
The methods used in this study include surface height extraction from DSM data, incorporation
59
of river map data with ground level data obtained from DSM data, and object classification with
60
watershed segmentation technique on DSM data. In this study, the data used is digital data from the
61
height of the surface (Digital Surface Model / DEM) in 2016 with a resolution of 1 meter. The map of
62
the sub-district administrations in DKI Jakarta whose boundaries are represented by the color
63
difference is shown in Figure 1. This DSM data will be processed with each parameter, namely:
64
contour data, ground surface height, slope. The value of the surface contour has different color
65
changes and the color will determine the height of the soil surface so that the expected result from
66
the contour will produce ground level data.
67
In addition to DSM data, supporting data also used in this research is the image of Landsat 7
68
satellite, where image data used is 1: 168,719 scale DKI Jakarta image obtained on May 2017 [8].
69
Landsat image is taken from the official website of the United States Geological Survey (USGS). The
70
data obtained will be identified to divide some of the criteria for land cover classes.
71
DKI Jakarta is categorized as a delta city, a city located at the mouth of a river that is generally
72
below sea level, and quite vulnerable to climate change. Nevertheless, the existence of rivers and
73
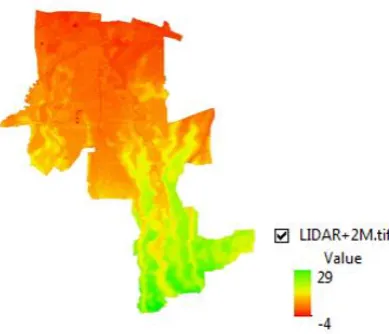
seas causes a delta city to have a strategic advantage, especially in terms of water transport. The
74
delta city is generally below sea level, and quite vulnerable to climate change. The Watershed Map,
75
Channel and Flood Way through Jakarta Region, can be seen in Figure 2.
Figure 1. DKI Jakarta Sub-District boundary map, each shade represents a District, with area of
77
interest marked by a box
78
Figure 2. Jakarta river map: Blue represent flood control rivers, Red represents rivers running
79
through eastern part, Green for rivers through central part, and Yellow marked rivers in the western
80
part of Jakarta
81
Pesanggrahan River, or locally known as Kali Pesanggrahan, passes through Bogor and Depok
82
in West Java Province finally reaches South, West and North Jakarta. All Pesanggrahan Basin has a
83
flat and elongated shape with several tributaries entering the main river. Kali Pesanggrahan has a
84
river area of 142,500 km2 with a length of 11,400 km. The initial capacity of Pesanggrahan River is
85
210 m3/s, condition of the river currently only 75 m3/s, while the flow that must be accommodated
86
by Pesanggrahan River for the current 25-year period is 198.9 m3/s so that the runoff always occurs
87
mainly due to backwater from Cengkareng Drain and overflow at Pesanggrahan River meeting and
88
Angke River. With the addition of water discharge, the countermeasures by the public works office
89
are needed for flood control in the western region today.
90
2.3. Mapping Method
91
Flood mapping method is done by using DSM (Digital Surface Model) data of DKI Jakarta
92
which is result of contour data processing of Jakarta. DSM data is segmented by watershed
93
segmentation method to get predicted flood potential. After obtaining the DSM segmentation result,
94
then the data is registered to coordinate the corresponding position so as to facilitate further
95
processing. The registered data is then cropped to determine the area of interest before conducting
96
the analysis. The expected output of this process is information on potential floods along the
97
Pesanggrahan River Basin located in South Jakarta Municipality [3].
98
DSM data as main data is processed by using ArcGIS application to get contour data and
99
ground surface height. The results are then correlated to obtain the image of land cover in the
100
Pesanggrahan area. After correlation processing results, the data were analyzed with field data of
101
flood distribution. The expected output of this process is information on potential flooding along
102
Pesanggrahan River Basin located in Pesanggrahan Sub district.
103
Research methods can be divided into three stages of DSM data processing, data analysis and
104
comparison of final results with actual flood data. The method used is the result of DSM contour
105
data in Pesanggrahan District as well as the ground surface height of the local area then the data will
106
be correlated with for later will be matched with field data.
2.4. Land elevation and gradient
110
Areas with higher ground elevation have less chance of flood events compared to lower regions
111
because water falling on the surface tends to flow to the lower regions where the accumulation of
112
water flow capacity that flows over the surface due to saturation water discharge in the soil. The
113
yield value of the slope class is determined where the higher slope of the land or the steeper the area
114
will cause less time for the rainwater to be filtered so that it will easily escape the flow of water
115
flowing over the surface due to the full capacity of the incoming water flow into the soil. While the
116
lower the value of the soil's soil or the flatter surface will cause the water to have a lot of time to
117
process the flow of water into the soil so that the capacity of the field more quickly fulfilled, thus the
118
possibility of the occurrence of larger puddles. So the flatter or small the value of the slope of the
119
land the value of the result is increasing.
120
2.5. Land cover
121
The type of land cover has different water capacity figures. The water capacity figures show
122
how large the portion of the rainfall will flow as the capacity of the stream surface. The growing
123
number of vegetation will increase the soil's ability to absorb rainwater that retains the flow rate of
124
water flow. Unlike the case with paddy fields that have water content in high field capacity so that
125
the ability to absorb water is lower. Especially when the surface of the built area covered by many
126
buildings and roads so that the surface is not exceeded by water resulted in high capacity water flow
127
that supports the occurrence of floods.
128
From the results of the data already obtained, then the data in the overlay to apply the
129
weighting of the values that already exist. Formulation of calculation of flood vulnerability that
130
includes: Soil Surface height, Soil Contour, and Land Cover is the formula as follows,
131
(1)
X : Total result of flood vulnerability
132
Bi : The Weight of i-th Parameter
133
Si : The result of i-th parameter
134
The weight of each parameter in the determination of the flood vulnerability is determined
135
based on the parameters on the flood data that has been done. The greater the weight value of a
136
parameter indicates that the parameter has a great effect as well as vice versa.
137
3. Results
138
3.1. Processing Surface Elevation Data
139
Figure 3. Data for Pesanggrahan River: (a) LIDAR data and (b) color-coded Elevation data from
140
LIDAR
141
Description of land surface height around Pesanggrahan area is obtained from DEM data
142
processing. Figure 3 shows the results of the altitude data processing. The elevation of the soil
143
surface in Pesanggrahan Region is relatively homogeneous because it is a flat area. From the results
144
of the processed data, Pesanggrahan area is divided into 7 different color classification class that is
145
dark green color has a ground level of less than 5m, light green color shows height between 5m-10m,
146
light yellow color has a height of 10-15 m, 15-20 m long yellow, pink color has a height of 20-25 m,
147
dark red has a height of 25m-30m, and the color purple has a height of more than 30 m [8].
148
3.2. Deriving the contour data
149
From the DEM data processing, we found the contour data of the land surface area around the
150
Pesanggrahan River Basin. Figure 5 shows the results of processing from DEM data, so that from the
151
data visible contour of ground surface soil in Pesanggrahan River Basin. In Figure 4, the results of
152
processed data contours Pesanggrahan have different colors, namely bright red, dark red, yellow,
153
green, blue, purple, and orange. Each color has a different value, where the value with the smallest is
154
the lowest point value of the contour [8]. From the image of the line height (contour) of the soil
155
surface has a contour line density which means it reflects the steep slope against the surface. Yellow
156
color is the river, and red area shows the lowermost elevation that is very prone to flooding. Contour
157
derivation shows that the elevation ranges from -4 m to 29 m.
158
Figure 4.Detailed area of interest with color-coded elevation range
159
4. Discussion
160
The classification of elevation segmented into three categories, under 12 m; 12 to 17 m; and
161
above 17 m. Plotting of the Pesanggrahan River’s most prone areas from the southern border of DKI
162
Jakarta to Jakarta-Tangerang Tollroad resulted in area of 332.4 hectares with the extent of flood from
163
the riverbanks ranged between 300 m in the southern part to 600 m in the northern part. Areas
164
around the toll road is a flat lowland which could disperse the water overflow. While this means
165
shallow flooding, it covers much broader area and affected more residents. The flood vulnerability is
166
shown in Figure 5 it also shows Government owned Oil and Gas Research Institute and Cipulir
167
Market, a major textile market both located in the flood prone area.
Figure 5. Mapping of flood prone area of Pesanggrahan River from DKI Jakarta southern border to
169
Jakarta-Tangerang Tollroad
170
Acknowledgments: The authors would like to thank Yayasan Pendidikan Budi Luhur Ç akti for the funding of
171
the research and this publication.
172
Author Contributions: Lestari Margatama and Indra Riyanto designed the research with guidance from Dr.
173
Dodi Sudiana and Prof. Josaphat Tetuko. Indra Riyanto and Babag Purbantoro performs the LIDAR Data
174
Segmentation with the guidance provided by Dr. Luhur Bayuaji. Lestari Margatama and Samsinar performs
175
the mapping of the segmented area.
176
Conflicts of Interest: The authors declare no conflict of interest.
References
179
1. Akbar, Y.M.; Musafa, A.; Riyanto, I. “Image Processing-based Flood Detection for Online Flood Early
180
Warning System.” Proceedings of the 6th Indonesia-Japan Joint Scientific Symposium, Yogyakarta,
181
Indonesia, October 2014; Universitas Gadjah Mada: Yogyakarta, Indonesia.
182
2. Wihartini; Pramusinto, W.; Riyanto, I. “Mobile System to Support Flood Area Information Distribution.”
183
Proceedings of the 5th Indonesia-Japan Joint Scientific Symposium, Chiba, Japan, October 2012; Chiba
184
University: Chiba, Japan.
185
3. Riyanto, I.; Margatama, L. “Study of Watershed Image Segmentation for Flood Potential Area Mapping in
186
Jakarta. Case Study: Ciliwung River–West Banjir Kanal.” Proceedings of Int. Conf. on Information
187
Technology and Electrical Engineering, Yogyakarta, Indonesia, 28 July 2011, Universitas Gadjah Mada:
188
Yogyakarta, Indonesia, pp. 52-55.
189
4. Riyanto, I.; Sudiana, D. “Pemetaan Daerah Potensi Banjir Dengan Segmentasi Data Digital Elevation
190
Model {Studi Kasus: DAS Ciliwung di DKI Jakarta 2007}.” Master Thesis, Universitas Indonesia, Depok,
191
2009.
192
5. Sudiana, D.; Rizkinia, M. “ALOS/PALSAR Image Processing Using Dinsar and Log Ratio for Flood Early
193
Detection in Jakarta Based on Land Subsidences.” Makara J. of Technology 2012, Vol. 15, Issue 2, pp. 193-200.
194
6. Putri, R.F.; Bayuaji, L.; Sumantyo, J.T.S.; Kuze, H. “TerraSAR-X Dinsar for Land Deformation Detection in
195
Jakarta Urban Area, Indonesia.” J. of Urban and Environmental Engineering2013, Vol. 7, Issue 2, pp. 195-205.
196
7. Bayuaji, L.; Sumantyo, J.T.S.a; Kuze, H. “ALOS PALSAR D-InSAR for Land Subsidence Mapping in
197
Jakarta, Indonesia.” Can. J. Remote Sensing2010, Vol. 36, No. 1, pp. 1–8.
198
8. Margatama, L.; Al-Hikmah, S.S.; Riyanto, I.; Samsinar; Pebrianti, D.; Bayuaji, L.; Sudiana, D.; Sumantyo,
199
J.T.S. “Increasing Disaster Awareness of the Community by Flood Potential Mapping of
200
Densely-Populated Urban River Watershed in South and West Jakarta with LIDAR Data Segmentation.”
201
Proceedings of the IEEE Int. Conf. on Applied System Innovation, Chiba, Japan, April 2018; Taiwanese
202
Institute of Knowledge and Innovation: Tainan, Taiwan (R.O.C.)