20 1 8/13 (4)
* Corresponding author. E-mail: [email protected]
Copyright © 2018 The Author(s). Published by RTU Press
This is an Open Access article distributed under the terms of the Creative Commons Attribution https://doi.org/10.7250/bjrbe.2018-13.426
INTERACTION OF PHYSICAL PARAMETERS
AND THE STRENGTH OF FROST BLANKET
COURSE IN ROAD PAVEMENT STRUCTURE
LINA BERTULIENĖ1*, LINA JUKNEVIČIŪTĖ–ŽILINSKIENĖ2,
HENRIKAS SIVILEVIČIUS3, ALFREDAS LAURINAVIČIUS4 1,2,4Dept of Roads, Vilnius Gediminas Technical University, Lithuania
3Dept of Mobile Machinery and Railway Transport, Vilnius Gediminas Technical University, Lithuania
Received 9 July 2017; accepted 23 August 2018
Abstract. This paper determines the interaction between the physical indicators of frost blanket course and its deflection modulus, measured by static and dynamic devices. The Pilot Road has been selected to examine the strength properties (deflection module) of frost blanket course. A Pilot Road consisting of 27 road sections, divided into 5 different road structures. A Pilot Road has been selected to examine the strength properties (deflection module) of frost blanket course. In this research was determined the strength of frost blanket course in road pavement structures of Pilot Road by four devices: Falling Weight Deflectometer Dynatest 8000, Light Weight Deflectometers Prima 100 and ZORN ZSG 02 and Static Beam Strassentest. The results showed no reliable correlation between the deflection modulus, measured by different devices, and the physical indicators of the frost blanket course of the road pavement structures in Pilot Road.
Alfredas Laurinavičius Interaction of Physical Parameters and the Strength of Frost Blanket Course in Road Pavement Structure
Introduction
A frost blanket course (FBC) protects road pavement structure from the damaging effect of frost. The course is performed from the non-frost-susceptible aggregate mixtures and soils. A frost blanket course is obligatory when the layers of the road pavement structure are constructed from water permeable materials, and the subgrade is moistened continuously or periodically. Besides a protective function, the purpose of FBC is to carry loads, generated by traffic and by layers of the road pavement structure, and to distribute them to the subgrade (Kavussi, Rafiei, & Yasrobi, 2010). Load effect, caused by motor vehicle wheels to the road pavement structure is one of the most deciding factors determining
the behaviour of the road surface during its life cycle (Vaitkus & Paliukaitė,
2013). It is necessary to collect information about the properties of the available materials being optimally used for the construction of a road, as well as their reciprocity to one another (Bazi, Briggs, Saboundjian, & Ullidtz, 2015; Mateos & Soares, 2014; Rajaei & Baladi, 2015).
Moreover, FBC drains road pavement structure and evenly distributes loads on the formation level of the subgrade, and protects road pavement structure from the frost heaving. The primary conditions, which determine the required frost resistance of subgrade and road pavement structure, are as follows (Bilodeau & Doré, 2014;
Vaitkus, Vorobjovas, Žiliūtė, Kleizienė, & Ratkevičius, 2012; Vennapusa,
White, Siekmeier, & Embacher, 2012):
• the use of non-frost-susceptible soils for the construction of the upper part of subgrade located in a frozen zone;
• assurance of the required elevation of the road structure over the level of groundwater or surface water;
• perform of an FBC − the volume of the material of which does not
change under the effect of frost and moisture, or the use of the thermal insulation materials, which withhold frost penetration into the underneath layers and reduce the depth of frozen subgrade;
• installation of draining or insulating layers − a draining layer
ensures the extremely rapid water discharge from the subgrade; whereas, the insulating layers, e.g. geomembrane, prevent water from getting into the subgrade.
20 1 8/13 (4)
The static and dynamic deflection measurement methods are used to determine the deflection module of the road pavement structure. The particular area is gradually loaded and unloaded while road pavement structure is measured by a static method. The essence of pavement structural strength evaluation is to add relative pressure to the road surface, which, according to the definition, corresponds to the load impact of a vehicle wheel at the pressure point. The disadvantage of the static method is that, under this method, it is impossible to examine the ability of the road pavement structure to convey the dynamic effect that occurs due to real vehicle loads. Dynamic methods precisely replicate the effect of the forces affecting road pavement structure because a load of the vehicle wheel is transmitted while the vehicle is moving on the road.
This paper determines the interaction between the physical indicators of FBC and its deflection modulus, measured by static and dynamic devices.
1.
Static and dynamic methods
Dependencies between dynamic and static deflection modulus are rarely used in practice. The most commonly given threshold values of static and dynamic deflection moduli are EV2 and EVd, respectively. Values
of deflection modulus for layers of bulk materials are specified according to the compaction degree of the layer being tested.
Tompai (2008) conducted a static (B & C Small – Plate Device) and dynamic (Light Weight Deflectometer (LWD)) method comparative analysis. The possibility of reliable conversion among values of two dynamic deflection moduli (EVd, Ed) obtained by using an LWD and the
EV2 is briefly presented and justified. The new result of dynamic target
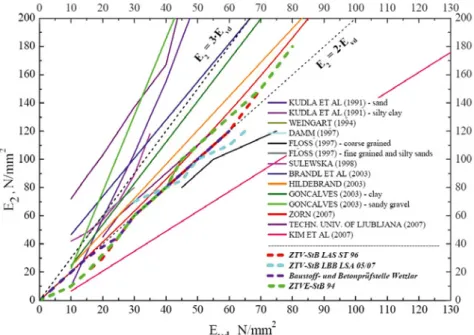
values opens up the opportunity to perform the quality control and assess the bearing strengths of the tested layer, not only by Static Plate Load Test, which proved to be time-consuming and labour intensive but by dynamic devices as well. Figure 1 gives the summary of correlation results between the static and dynamic measuring methods in other countries.
Figure 1 gives correlation results between the static EV2 (static
deflection modulus by a static plate load) and dynamic EVd (dynamic deflection modulus) measuring methods. The formulas for calculating direct correlation are seldom used in practice, most frequently the limit values are given for both EV2 and EVd. Four different German standards
Alfredas Laurinavičius Interaction of Physical Parameters and the Strength of Frost Blanket Course in Road Pavement Structure
Figure 1. Correlation results of static and dynamic measuring methods based on international research (Tompai, 2008)
stronger correlation. Only two-literature sources give correlation less than 2, though they both refer to the deflection modulus values measured in only several points and at small distances. The EVd values, presented in all German standards, are close to a correlation line indicating the ratio 2. Here, in analysed standards, when giving the limit EVd values the weakest correlation ratio (or even weaker) is applied. Determination of direct correlation between the dynamic and static deflection moduli are seldom used in practice, the values of EV2 and EVd
are approved in Germany, Slovenia and some other countries.
Sulewska (2004) published results of research, using LWD ZFG 01. It was established the functional dependencies between static and
dynamic deflection moduli (Eqs (1−3)):
ED = f(IS), (1)
ED = f(EV1), (2)
ED = f(EV2), (3)
where ED − dynamic deflection modulus of soil deformation, MPa EV1 and
EV2 – primary and secondary static deflection moduli of soil deformation,
MPa; IS − value of soil degree of compaction, yd.
20 1 8/13 (4)
examined the soil compaction degree of embankments using LWD, as well. The tests were performed on unbound layers in the road pavement structure of North-Eastern Poland. Deflection modulus was measured using LWD. The objective of the study was to find a correlation between the deflection modulus, measured using an LWD, and the compaction rate. After analysing the results, it was found that it is necessary to perform a calibration test to strengthen the compaction control accuracy. Marginal values of the dynamic deflection moduli have to be
determined based on the compaction rate (Bertulienė, 2012).
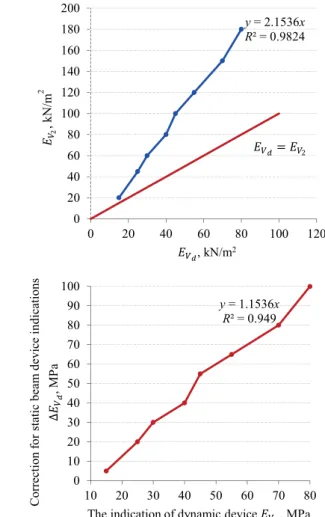
Approximate EVd (dynamic deflection modulus) transfer to the EV2
(static deflection modulus) values according to LST 1360.5:1995 Soils for Road Construction are recommended in Lithuania.
Absolute values
Added correction values
Figure 2. Dependencies of the EVdtransfer to the EV2
y= 2.1536x R² = 0.9824
0 20 40 60 80 100 120 140 160 180 200
0 20 40 60 80 100 120
= 2
, kN/m2
1 1 1
2
, kN/m
2
y= 1.1536x R² = 0.949
0 10 20 30 40 50 60 70 80 90 100
10 20 30 40 50 60 70 80
The indication of dynamic device , MPa
Correction
fo
r
static
beam
de
vice i
ndications
∆
,
MP
Alfredas Laurinavičius Interaction of Physical Parameters and the Strength of Frost Blanket Course in Road Pavement Structure Figure 2 shows dynamic and static deflection moduli value
dependence is linear. The higher EVd value, the higher EV2 the value.
The graph (Figure 2) does not specify to which dynamic device it corresponds. It is likely that each different dynamic instrument reading correlation by static beam (SB) Strassentest readings are different.
2. The methodology of the experiment
The Pilot Road with experimental pavement structures (710 m
of length) was constructed in an open area (Čygas, Laurinavičius, Paliukaitė, Motiejūnas, Žiliūtė, & Vaitkus, 2015). The cross-section
parameters of the Pilot Road correspond to the III category of the road, the road pavement structure Class III by KPT SDK 07 Rules for the Design of Standardized Road Pavement Structures of Motor Roads. The Pilot Road was constructed as follows:
1. The existing asphalt pavement has been milled down to the base layer with the bulk material;
2. The base layer of the road pavement structure has been dug out to the design subgrade level;
3. Deflection modulus values, higher than normative, have been achieved while reconstructing the subgrade of the Pilot Road section and installing FBC (according to ĮT SBR 07 Rules for the Installation of Non-Binder Layers of Road Pavement Structure for Road Pavement Construction). Subgrade compaction values vary between 95–100% and the deflection modulus of the top layer – not less than 45 MPa. Similarly, based on the same standards, FBC compaction rate values have to be – 100–103%. Value of deflection modulus has to be at least 120 MPa of FBC in the road pavement structure of SV (the highest class) and I to IV classes. Value of deflection modulus has to be of at least 100 MPa and 80 MPa, respectively, of FBC in the road pavement structure of V and VI classes;
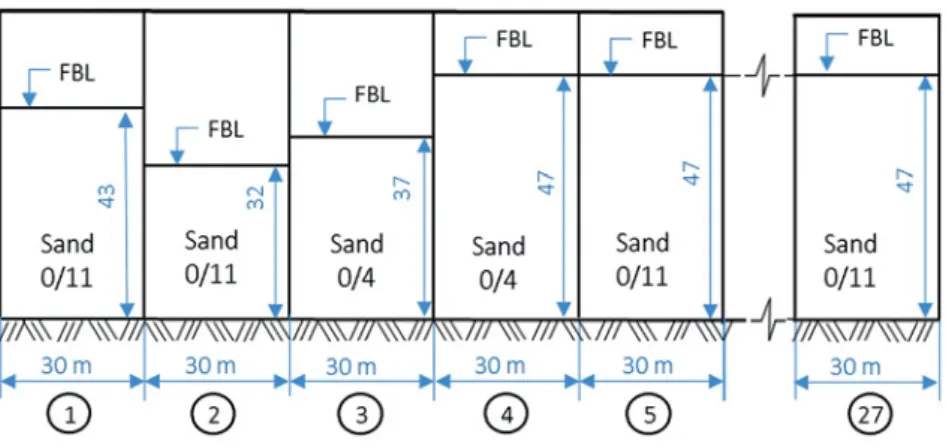
4. The total length of the Pilot Road is 710 m − consists of 26
sub-sections (the length of each is 30 m) and one sub-section in length of 20 m (Figure 3).
The following four devices were used to determine FBC strength of the road pavement structures in the Pilot Road: dynamic – FWD Dynatest 8000 (FWD), LWD Prima 100 (LWD), ZORN ZSG 02 (ZORN) and static – Strassentest (SB). Measurements were carried out using the same scheme (the measuring point varies ±0.5 m) and under the same weather conditions (the average air temperature of 18 ºC, without
20 1 8/13 (4)
Deflection modulus EV2 was found through measurements using
SB, while EVd has been obtained from measurements using three dynamic measuring devices. 0/11 sand fraction (road pavement section No. 25) and 0/4 sand fraction (road pavement sections No. 3 and No. 4) were used for FBC construction. The thickness of FBC is 43 cm in
the road pavement section No. 1, 32 cm − on section No. 2, 37 cm − on section No. 3, and 47 cm − on sections from No. 4 to No. 27.
3. Physical and mechanical parameter influence
to deflection modulus
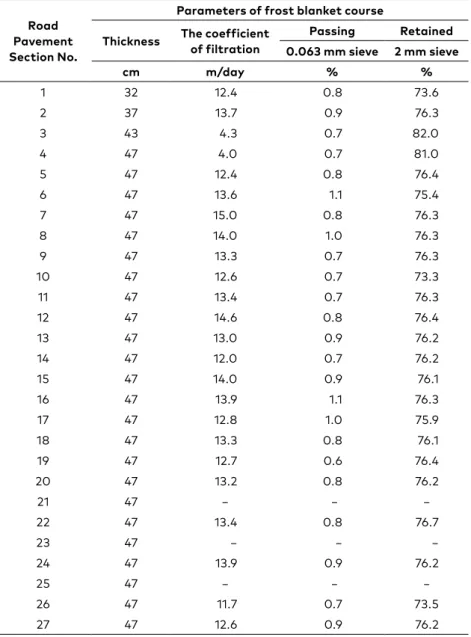
The standard and actual physical and mechanical properties of FBC presented in Table 1. Physical parameters data of all FBC sections are in Table 2.
After establishing the FBC filtration coefficient (Table 2) in road pavement sections No. 3 and No. 4, the obtained values vary from
Figure 3. A fragment of the construction scheme of the Pilot Road
Table 1. The comparison of standard and actual physical and mechanical properties of frost blanket course
Properties of FBC Unit Standard Actual Values of deflection modulus MPa 120 113.4–167.1 The coefficient of filtration m/day ≥ 2 4.0–15.0
Alfredas Laurinavičius Interaction of Physical Parameters and the Strength of Frost Blanket Course in Road Pavement Structure
Table 2. Data of physical parameters of frost blanket course
Road Pavement Section No.
Parameters of frost blanket course
Thickness The coefficientof filtration Passing Retained 0.063 mm sieve 2 mm sieve
cm m/day % %
1 32 12.4 0.8 73.6
2 37 13.7 0.9 76.3
3 43 4.3 0.7 82.0
4 47 4.0 0.7 81.0
5 47 12.4 0.8 76.4
6 47 13.6 1.1 75.4
7 47 15.0 0.8 76.3
8 47 14.0 1.0 76.3
9 47 13.3 0.7 76.3
10 47 12.6 0.7 73.3
11 47 13.4 0.7 76.3
12 47 14.6 0.8 76.4
13 47 13.0 0.9 76.2
14 47 12.0 0.7 76.2
15 47 14.0 0.9 76.1
16 47 13.9 1.1 76.3
17 47 12.8 1.0 75.9
18 47 13.3 0.8 76.1
19 47 12.7 0.6 76.4
20 47 13.2 0.8 76.2
21 47 − − −
22 47 13.4 0.8 76.7
23 47 − − −
24 47 13.9 0.9 76.2
25 47 − − −
26 47 11.7 0.7 73.5
27 47 12.6 0.9 76.2
4.0 m/ day to 4.3 m/day (the recommendation is at least 2 m/day by ĮT SBR 07 Rules for the Installation of Non-Binder Layers of Road Pavement Structure for Road Pavement Construction). In all other road pavement sections values of the filtration coefficient ranged from 11.7 m/day to 15.0 m/day. Frost blanket course mineral mixture passing through
20 1 8/13 (4)
Figure 4. Deflection modulus of frost blanket course measured by all devices
recommendation is 28–80%) of the mixture weight. Passing through
a 0.063 mm sieve values range from 0.6% to 1.1% of the mixture (by ĮT SBR 07 the recommendation is up to 7%).
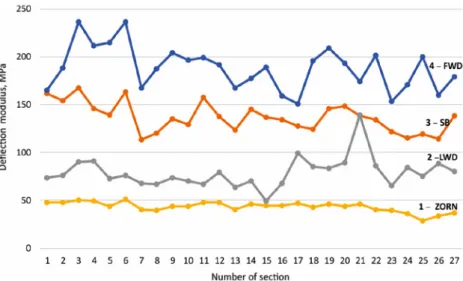
Devices and different physical indicators influence the different values of FBC deflection modulus: course thickness h, filtration coefficient kf, gradation (per cent of quantities, passing through
0.063 mm) p0.063, and remaining on the 2 mm sieve p2) (Figure 4).
The measurement results of FBC deflection modulus show that the readings obtained by the static and dynamic devices in 27 separate sections are substantially different and vary (Figure 4).
Analysis of the results shows that the numerical values of the deflection modulus, compared to the SB, are different. Light Weight Deflectometer values of deflection modulus (ELWD) are about 42.3% less
than the SB (ESB) measured the average numerical value of deflection
modulus. Light Weight Deflectometer ZORN (EZORN) values are about
68.4% less than values measured by SB, and the FWD (EFWD) values
increased about 37.6%. According to the received results, it is observed
that the lowest averages and lowest dispersion results have been received using an LWD ZORN device.
A statistical hypothesis about the equality of correlation coefficient values to zero to validate, the Student t-test was taken, and its statistic t was calculated as follows (Eq. (4)) (Podvezko & Sivilevičius, 2013):
Devices and different physical indicators influence the different values of FBC deflection modulus: course thickness h, filtration coefficient kf, gradation
(per cent of quantities, passing through 0.063 mm) p0.063, and remaining on the 2
mm sieve p2) (Figure 4).
The measurement results of FBC deflection modulus show that the readings obtained by the static and dynamic devices in 27 separate sections are substantially different and vary (Figure 4).
Figure 4. Deflection modulus of frost blanket course measured by all devices Analysis of the results shows that the numerical values of the deflection modulus, compared to the SB, are different. Light Weight Deflectometer values of deflection modulus (ELWD) are about 42.3% less than the SB (ESB) measured the average numerical value of deflection modulus. Light Weight Deflectometer ZORN (EZORN) values are about 68.4% less than values measured by SB, and the FWD (EFWD) values increased about 37.6%. According to the received results, it
is observed that the lowest averages and lowest dispersion results have been received using an LWD ZORN device.
A statistical hypothesis about the equality of correlation coefficient values to zero to validate, the Student t-test was taken, and its statistic t was calculated as follows (Eq. (4)) (Podvezko & Sivilevičius, 2013) :
1 ,m 2 1m 22
t r
r
α
− −
− =
− , (4)
Alfredas Laurinavičius Interaction of Physical Parameters and the Strength of Frost Blanket Course in Road Pavement Structure where m − number of criteria (m = 27); r − coefficient of the pairwise
correlation.
The minimum value of pairwise correlation coefficient rmin is
calculated by rearranging Eq. (5) as follows:
, min 2 , 2 t r m t α ν α ν =
− + . (5)
Given significant level α = 0.05 and t-statistic tα,v = 2.06.
A Pilot Road consists of 27 road pavement structures, taking a significance level α = 0.05 and a degree of freedom ν = 27 – 1 = 26, The critical value of the Student criterion is tα,ν= 2.06. The minimum value of the correlation coefficient
rmin was calculated using the Eq. (5) and equal to 0.381. Values are correlated, and h and kf (Table 3) show impact to the deflection modulus measured using SB.
The only kf affected the deflection modulus measured by LWD. There was no link
between the physical indicators and the deflection modulus measured by ZORN device. Falling Weight Deflectometer Deflection modulus, measured by FWD depends only on kf and p2.
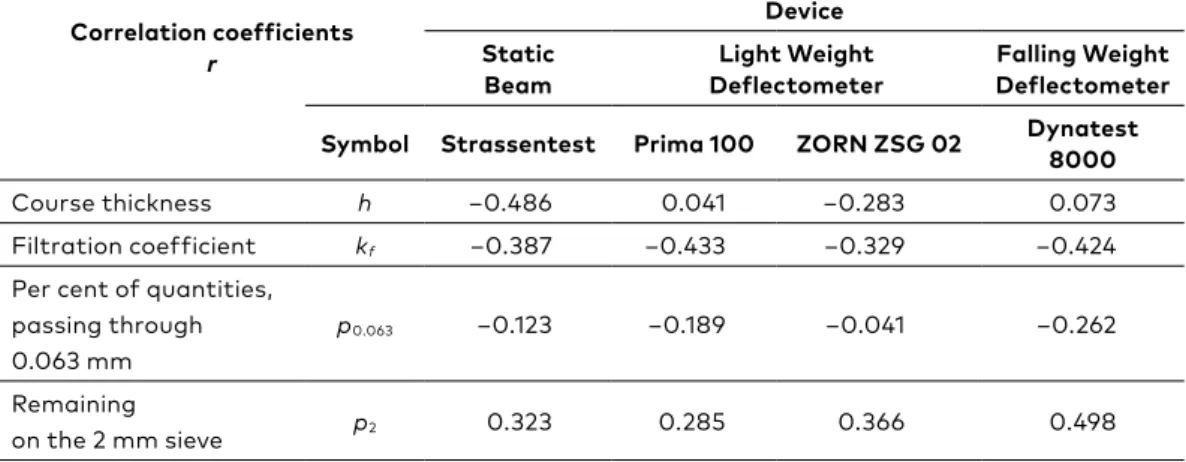
Table 3.The correlation coefficient of the deflection modulus dependency
Correlation coefficients
r
Device Static
Beam Deflectometer Light Weight
Falling Weight Deflectometer Symbol Strassentest Prima 100 ZORN ZSG 02 Dynatest 8000
course
thickness h –0.486 0.041 –0.283 0.073 filtration
coefficient kf –0.387 –0.433 –0.329 –0.424
per cent of quantities, passing through 0.063 mm
p0.063 –0.123 –0.189 –0.041 –0.262
remaining on the 2 mm
sieve p2 0.323 0.285 0.366 0.498 This data shows no reliable correlation among the deflection modulus, measured by different instruments, and physical indicators of FBC of the road pavement structures in Pilot Road. It is likely that in a wider range, adjusting the physical indicators of FBC, the correlation might be stronger.
Value of deflections modulus measured by SB Strassentest and LWD ZORN decreases with increasing the thickness of FBC. However, the LWD and FWD showed the opposite result: as the thickness of FBC, the values of the deflection modulus become greater. It has been determined that the coefficient of filtration goes up as the values of deflection modulus decrease. With increasing per cent of quantities, passing through the 0.063 mm sieve, the values of deflection modulus decrease, i.e. the fine passing (smaller than 0.063 mm). The weaker is the primer with increasing per cent of quantities, retained on the 2 mm sieve, the values of
. (5)
Given significant level α = 0.05 and t-statistic tα,v = 2.06.
A Pilot Road consists of 27 road pavement structures, taking a significance level α = 0.05 and a degree of freedom ν = 27 – 1 = 26, The
critical value of the Student criterion is tα,ν= 2.06. The minimum value of
the correlation coefficient rmin was calculated using the Eq. (5) and equal
to 0.381. Values are correlated, and h and kf (Table 3) show impact to the
deflection modulus measured using SB. The only kf affected the deflection
modulus measured by LWD. There was no link between the physical indicators and the deflection modulus measured by ZORN device. Falling Weight Deflectometer Deflection modulus, measured by FWD depends only on kf and p2.
This data shows no reliable correlation among the deflection modulus, measured by different instruments, and physical indicators of FBC of the road pavement structures in Pilot Road. It is likely that in a wider range, adjusting the physical indicators of FBC, the correlation might be stronger.
Value of deflections modulus measured by SB Strassentest and LWD ZORN decreases with increasing the thickness of FBC. However, the LWD and FWD showed the opposite result: as the thickness of FBC, the values
Table 3. The correlation coefficient of the deflection modulus dependency
Correlation coefficients r Device Static Beam Light Weight Deflectometer Falling Weight Deflectometer
Symbol Strassentest Prima 100 ZORN ZSG 02 Dynatest 8000
Course thickness h –0.486 0.041 –0.283 0.073 Filtration coefficient kf –0.387 –0.433 –0.329 –0.424
Per cent of quantities, passing through 0.063 mm
p0.063 –0.123 –0.189 –0.041 –0.262
Remaining
20 1 8/13 (4)
of the deflection modulus become greater. It has been determined that the coefficient of filtration goes up as the values of deflection modulus decrease. With increasing per cent of quantities, passing through the
0.063 mm sieve, the values of deflection modulus decrease, i.e. the fine passing (smaller than 0.063 mm). The weaker is the primer with
increasing per cent of quantities, retained on the 2 mm sieve, the values of deflection modulus decrease.
Conclusions
1. Analysis of measuring results of frost blanket course by the static and dynamic devices showed that the strength of frost blanket course determined by Falling Weight Deflectometer is close to the strength determined by a static testing device. Value averages of deflection modulus measured by Light Weight Deflectometers
Prima 100 and ZORN are 42.3% and 68.4% respectively. These
average values were lower than the average values measured by the Static Beam Strassentest. Value average measured by Falling
Weight Deflectometer is 37.6% higher than the received value of the
deflection module measured by the Static Beam Strassentest.
2. The thickness of the frost blanket course affected only the deflection modulus measured by Static Beam. The deflection modulus was affected by the filtration coefficient measured by Static Beam, Light Weight Deflectometer, and Falling Weight Deflectometer. Per
cent of quantities, passing through 0.063 mm sieve did not affect
any instrument readings. Total per cent of quantities, retaining on the 2 mm sieve, influenced only the Falling Weight Deflectometer readings. This data shows no a reliable correlation between the deflection modulus, measured by different devices, and the physical indicators of the frost blanket course of the road pavement structures in the Pilot Road. It is likely that when adjusting the physical indicators of frost blanket course in a wider interval, the correlation would be stronger.
Alfredas Laurinavičius Interaction of Physical Parameters and the Strength of Frost Blanket Course in Road Pavement Structure
REFERENCES
Bazi, G., Briggs, R., Saboundjian, S., & Ullidtz, P. (2015). Seasonal Effects on a Low-Volume Road Flexible Pavement. Transportation Research Record:
Journal of the Transportation Research Board, (2510), 81-89.
https://doi.org/10.3141/2510-10
Bertulienė, L. (2012). Assessment, Research and Use of Methods for Determining
the Strength of Base Courses of Road Pavement Structure. Baltic Journal of
Road & Bridge Engineering, 7(3): 228–236.
https://doi.org/10.3846/bjrbe.2012.30
Bheemasetti, T. V., Pedarla, A., Puppala, A. J., & Acharya, R. (2015). Design of Sustainable High-Volume Pavements Using Controlled Low-Strength Material from Native Soil. Transportation Research Record: Journal of the
Transportation Research Board, (2509), 10-17.
https://doi.org/10.3141/2509-02
Bilodeau, J. P., & Doré, G. (2014). Direct estimation of vertical strain at the top of the subgrade soil from interpretation of falling weight deflectometer deflection basins. Canadian Journal of Civil Engineering, 41(5), 403-408. https://doi.org/10.1139/cjce-2013-0128
Čygas, D., Laurinavičius, A., Paliukaitė, M., Motiejūnas, A., Žiliūtė, L., & Vaitkus, A.
(2015). Monitoring the mechanical and structural behavior of the pavement structure using electronic sensors. Computer‐Aided Civil and Infrastructure
Engineering, 30(4), 317-328. https://doi.org/10.1111/mice.12104
ĮT SBR 07 Rules for the Installation of Non-Binder Layers of Road Pavement Structure for Road Pavement Construction (in Lithuanian)
Kavussi, A., Rafiei, K., & Yasrobi, S. (2010). Evaluation of PFWD as potential quality control tool of pavement layers. Journal of Civil Engineering and
Management, 16(1), 123-129. https://doi.org/10.3846/jcem.2010.11
KPT SDK 07 Rules for the Design of Standardized Road Pavement Structures of
Motor Roads (in Lithuanian)
Mateos, A., & Soares, J. B. (2014). Characterization of the stiffness of unbound materials for Pavement design: Do we follow the right approach?. Journal of
Transportation Engineering, 140(4), 04014001.
https://doi.org/10.1061/(ASCE)TE.1943-5436.0000645
Podvezko, V., & Sivilevičius, H. (2013). The use of AHP and rank correlation
methods for determining the significance of the interaction between the elements of a transport system having a strong influence on traffic safety.
Transport, 28(4), 389-403. https://doi.org/10.3846/16484142.2013.866980
Rajaei, P., & Baladi, G. Y. (2015). Frost Depth: General Prediction Model. Transportation Research Record: Journal of the Transportation Research
Board, (2510), 74-80. https://doi.org/10.3141/2510-09
Sulewska, M. J. (2004). The application of the modern method of embankment compaction control. Journal of civil engineering and management, 10(suppl 1), 45-50.
Sulewska, M. J. (2012). The Control of Soil Compaction Degree by Means of LFWD. Baltic Journal of Road & Bridge Engineering, 7(1): 36–41.
20 1 8/13 (4)
Tompai, Z. (2008). Conversion between static and dynamic load bearing capacity moduli and introduction of dynamic target values. Periodica Polytechnica
Civil Engineering, 52(2), 97-102. https://doi.org/10.3311/pp.ci.2008-2.06
Vaitkus, A., & Paliukaitė, M. (2013). Evaluation of time loading influence on
asphalt pavement rutting. Procedia Engineering, 57, 1205-1212.
https://doi.org/10.1016/j.proeng.2013.04.152
Vaitkus, A., Vorobjovas, V., Žiliūtė, L., Kleizienė, R., & Ratkevičius, T. (2012).
Optimal Selection of Soils and Aggregates Mixtures for a Frost Blanket Course of Road Pavement Structure. Baltic Journal of Road & Bridge
Engineering, 7(2): 50–54. https://doi.org/10.3846/bjrbe.2012.21
Vennapusa, P. K. R., White, D. J., Siekmeier, J., & Embacher, R. A. (2012). In situ mechanistic characterisations of granular pavement foundation layers.
International Journal of Pavement Engineering, 13(1), 52-67.