Alan B. Clark, Scott H. Randell, Paul Nettesheim, Thomas E. Gray, Bob Bagnell,
and Lawrence E. Ostrowski
Laboratory of Pulmonary Pathobiology, Airway Cell Biology Group, National Institute of Environmental Health Sciences, Research Triangle Park, and Department of Pathology, University of North Carolina at Chapel Hill, Chapel Hill, North Carolina
The cellular pathway of ciliated cell differentiation and its regulation is poorly defined. To begin to under-stand the process of ciliated cell differentiation, we sought to identify factors regulating ciliated cell devel-opment in vitro. Rat tracheal epithelial (RTE) cells were cultured on collagen gel-coated membranes at an air-liquid interface in hormone- and growth factor-supplemented medium (complete medium [CM]). Under these conditions, RTE cells first proliferate and then differentiate into a pseudostratified muco-ciliary epithelium. Ciliated cell differentiation was measured using a monoclonal antibody, RTE3, which was shown to specifically react with the plasma membrane of ciliated cells. Cultures were immunostained in situ, and the percentage of the culture surface covered with ciliated cells was estimated using video-microscopy and an image analysis program. If an air-liquid interface was not created and the cells were maintained in the submerged state, ciliated cell differentiation was suppressed 25-fold. Culture in the ab-sence of mitogenic components present in CM, including epidermal growth factor (EGF), cholera toxin (CT), or bovine pituitary extract, resulted in 2- to 4-fold increases in the percentage of ciliated cells. When both EGF and CT were removed from the media, DNA synthesis and total cell number was reduced, while ciliated cell differentiation increased as much as 5-fold. These results demonstrate that submersion inhibits, while withdrawal of mitogenic compounds promotes, ciliated cell differentiation in vitro.
Ciliated cells are one of the three main cell types lining the surface of the conducting airways. Individuals with primary ciliary dyskinesia have a genetic defect that results in abnor-mal axoneabnor-mal structure and ciliary dysfunction. These in-dividuals suffer from repeated pulmonary infections, dem-onstrating the importance of ciliated cells to the defense mechanisms of the lung (1). In addition to providing the mo-tive force essential for mucociliary clearance, ciliated cells may produce antimicrobial peptides (2), function in immune surveillance (3), and regulate fluid and electrolyte trans-port (4).
As a result of their position at the surface of the airways, ciliated cells are exposed to many chemical and biological insults. Recent studies indicate that ciliated cells are easily
(Received in original form July 11, 1994 and infinalform October 26, 1994) Address correspondence to:Dr. Lawrence E. Ostrowski, Pulmonary Path. Lab., Mail Drop D2-01, N.I.E.H.S., P.O. Box 12233, Research Triangle Park, NC 27709.
Abbreviations:bovine pituitary extract, BPE; bovine serum albumin, BSA; complete media, CM; cholera toxin, CT; Dulbecco's modified Eagle's medium, DMEM; epidermal growth factor, EGF; hydrocortisone, HC; monoclonal antibody, mAb; phosphate-buffered saline, PBS; rat tracheal epithelial, RTE; scanning electron microscopy, SEM; trichloroacetic acid, TeA; transmission electron microscopy, TEM.
Am. J. Respir. Cell Mol. BioI. Vol. 12. pp. 329-338, 1995
damaged or lost after exposure to air pollutants such as nitro-gen dioxide, formaldehyde, and smoke (5-7). After damage to the tracheal epithelium, ciliated cells, which are believed to be terminally differentiated, must be regenerated to re-store the normal mucociliary epithelium. While there is some evidence that secretory cells may serve as the precur-sor for ciliated cells after injury to the trachea (8), the regu-lation of ciliated cell differentiation has not been studied in detail.
interface, the cells undergo differentiation to produce a pseu-dostratified mucociliary epithelium containing mature secre-tory and ciliated cells. This process reproduces many of the features observedin vivo in models of tracheal wound heal-ing or regeneration of tracheal grafts (17, 18).
In the present study, our aims were to develop a method to rapidly quantitate ciliated cell differentiation in cultures of RTE cells and to identify factors regulating ciliated cell differentiation in vitro. We demonstrate that the extent of ciliated cell differentiation can be measured using a mono-clonal antibody (mAb), RTE3, which was shown to react specifically with the apical plasma membrane of ciliated cells by immunogold labeling. When cultures were main-tained in the submerged state instead of at an air-liquid inter-face, ciliated cell differentiation was strongly suppressed. Removal of epidermal growth factor (EGF), cholera toxin (CT), or bovine pituitary extract (BPE) from the media resulted in 2- to 4-fold increases in the number of ciliated cells observed. DNA synthesis and total cell number were reduced in cultures grown in media lacking both EGF and CT, while the percentage of surface area covered by ciliated cells increased. These studies have identified submersion and mitogenic compounds as important factors regulating ciliated cell differentiation.
Materials and Methods
Materials
Tissue culture media and reagents were from Sigma Chemi-cal Co. (St. Louis, MO) except for EGF, transferrin, and rat tail collagen, which were purchased from Collaborative Re-search (Bedford, MA). Transwell-col tissue culture inserts (24-mm diameter, 0.4-J,tmpore size), referred to as "culture membranes;' were obtained from Costar (Cambridge, MA). Bovine pituitaries were purchased from Pel Freeze (Rogers, AR). [3H]thymidine was from Amersham (Arlington, IL).
Cell Culture
RTE cells were cultured as previously described (16). Briefly, RTE cells were obtained from male Fisher 344 rats (10 to 14 wk old) by overnight digestion with pronase. Cells were cultured on collagen gel-coated' membranes in complete medium (CM), which is composed of Dulbecco's modified Eagle's medium (DMEM)/Ham's F12 supplemented with t-leucine (0.45 mM, final concentration), t-lysine (0.50 mM), L-glutamine (6.5 mM),. L-methionine (0.12 mM), MgCl2 (0.30 mM), MgS04 (0.40 mM), CaCl2 (1.05 mM),
phenol red (8.6 mg/liter), NaHC03 (1.2 g/liter), insulin (10 J,tg/ml) , hydrocortisone (HC; 0.1 J,tg/ml) , CT (0.1 J,tg/ml) , transferrin (5 J,tg/ml; Collaborative Research), EGF (25 ng/ml; Collaborative Research), phosphoethanolamine (50
J,tM), ethanolamine (80J,tM), HEPES (30 mM), bovine se-rum albumin (BSA; 0.5 mg/ml), penicillin-streptomycin (50 U/ml-50 J,tg/ml; GIBCO, Grand Island, NY) and BPE (1%). The cells were cultured submerged in media for the first 7 days, at which time an air-liquid interface was created. Modified media was prepared by omitting the indicated com-ponents from CM. Other modifications to the published procedures are as described below. The collagen gel was formed on top of the culture insert by spreading 0.4 ml of 0.3 % type I collagen (rat tail collagen; Collaborative
Re-search) over the surface of each membrane. A gauze pad saturated with 30% ammonium hydroxide was placed in the bottom of a 160-mm petri dish and covered. The membranes were placed on the lid of a 100-mm petri dish, which was then placed on top of the gauze pad and covered. After 3 min, the membranes were placed in the culture wells con-taining 3 ml of sterile water. After 4 to 8 h, the water was replaced with sterile DMEM/FI2 and incubated overnight at room temperature. Before plating the RTE cells, the DMEM/FI2 in the lower chamber was replaced with CM (2.5 ml) containing 10% fetal bovine serum and 3 mg/ml BSA. The cells were plated at a density of 2.4 x 10⁴
cells/ em', The apical (upper) and basal (lower) compartments contained 0.5 and 2.5 ml media, respectively.
Cell Counts
For counting, cells were released from the collagen gel-coated membranes by incubation in a solution of 0.2 % pronase E (type XIV; Sigma), 0.15 % trypsin-1.6 mM EDTA (GIBCO) at 37°C for 30 min. The solution was added to the top and bottom compartments (0.5 and 2.0 ml, respectively). After removing the cell suspension (0.5 ml), membranes were washed with 0.5 ml of phosphate-buffered saline (PBS), which was pooled with the cell suspension. Cell clumps were disrupted by 10 passages through a 20-gauge needle. Cells were then counted in a hemocytometer.
DNA Synthesis
DNA synthesis was assayed as the amount of pH]thymidine that was incorporated into trichloroacetic acid (TCA)-pre-cipitable counts during a 24-h period. The day before assay-ing, media was replenished with media containing 5 J,tCi/ml of [methyl-3H]thymidine. After 24 h, the labeled media was removed and the cultures were washed twice in PBS. The cells were released from the membranes by incubation in the 0.2 % pronase E, 0.15%trypsin-1.6 mM EDTA solu-tion. A small aliquot (30 J,tl) was used for cell counts, and the remainder was lysed in a solution of 0.3 N NaOH and 1% sodium dodecyl sulfate at room temperature. An equal volume of 20%TCA was added, and the solution was mixed by vortexing. The DNA was precipitated in an ice bath for 15 min and collected by filtration through Whatman GF/C filters. The filters were rinsed twice with 5 ml of 10% TCA, rinsed once with 5 ml of ethanol, dried, and counted in Ecolume scintillation fluid (ICN; Irvine, CA).
Antibody Staining of Whole Mounts
PBS containing 1% BSA and 0.1% gelatin and incubated in the same buffer plus a 1:250 dilution of peroxidase con-jugated goat anti-mouse IgG (Jackson Immunoresearch Lab-oratories, West Grove, PA) for 60 min. The cultures were then washed 3 times with PBS followed by a single wash in 50 mM Tris-HCI (pH 7.6). Peroxidase labeling was visual-ized by incubating for 10 min in 50 mM Tris-HCI (pH 7.6) containing 0.2 mg/ml diaminobenzidine and 0.006 % hydro-gen peroxide. After the color reaction, the cultures were washed abundantly with water, cut away from their support, and whole-mounted on glass slides.
Quantitation of Ciliated Surface Area
The amount of surface area of the whole-mounts covered by RTE3-stained cells was determined using a CCD video cam-era mounted to a light microscope and interfaced with a Mac-intosh II computer and a video monitor. For each stained whole-mount, 11 measurements at low power were taken at 2-mm intervals across the diameter. The area to be measured was viewed on the video monitor. For each measurement, the video image was captured on the computer monitor using the NIH Image software program, and the threshold density was set to highlight the stained cells.. The threshold density was systematically set by increasing the threshold until areas with no staining (background) began to be highlighted. The high-lighted image was made binary to convert the image into black and white pixels, and the erode command was used to remove background pixels. The percentage of positive pixels was calculated, and the average was taken to represent the percentage of surface area covered by ciliated cells.
Transmission Electron Microscopy (TEM) Immunolabeling
Inserts for TEM immunolabeling were washed twice in PBS and fixed in 4% formaldehyde/0.1 M potassium phosphate buffer. Blocking, RTE3 antibody incubation, and subsequent washings were as above. The second antibody labeling was with a 1:50 dilution of 18nm gold-conjugated goat anti-mouse IgG in PBS containing 1% BSA and 0.1% gelatin for 60 min. After second antibody labeling, the membranes were washed with 1% BSA in PBS, fixed with 2 % glutaralde-hyde in 0.1 M potassium phosphate buffer (pH 7.4), washed 3 times in 0.1 M cacodylate (pH 7.4), incubated overnight in 1% OS04' dehydrated in ethanol and then in propylene oxide, and embedded in epon. Ultrathin sections were ob-tained and were countersob-tained with uranyl acetate and lead citrate.
Cytospins
Cells were released from the membrane following the proce-dure for cell counts. The cells were washed twice with PBS after the pronase-trypsin digestion and resuspended in 1.5 ml of PBS per insert. After passing 10 times through a 20-gauge needle, 1.5 ml of 4% formaldehyde/0.1 M potassium phos-phate buffer was added to the suspension. Approximately 5 x 10⁴
cells were centrifuged onto silanated slides (Di-gene, Diagnostics, Beltsville, MD). Slides were treated in 0.6% hydrogen peroxide in methanol for 10 min before im-munostainingwith RTE3. After immunostaining, the cytospin preparations were counterstained with 1% methyl green.
c
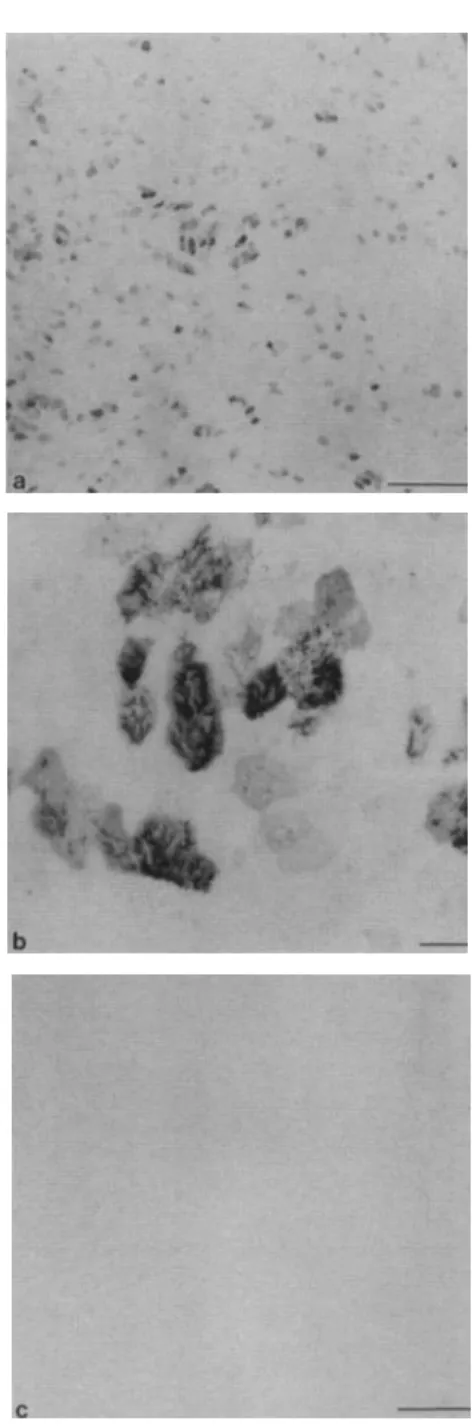
Figure1.Immunostaining of air-liquid interface cultures with mAb RTE3. Interface cultures of RTE cells were fixed, immunostained with mAb RTE3, and whole-mounted. a. Low-power micrograph of a day 14 culture showing individual and groups of mAb RTE3-positive cells. b. Higher magnification of an area in panel a, in which cilia are clearly visible on the surface of the stained cells. c. The negative control shows negligible background staining. Panels a and c, bars
=
0.2 mm; panel b: bar=
20Ilm.Scanning Electron Microscopy (SEM)
Cultures were fixed in situ with 3 % glutaraldehyde,
de-hydrated in ethanol, and critical point-dried in liquid CO2 •
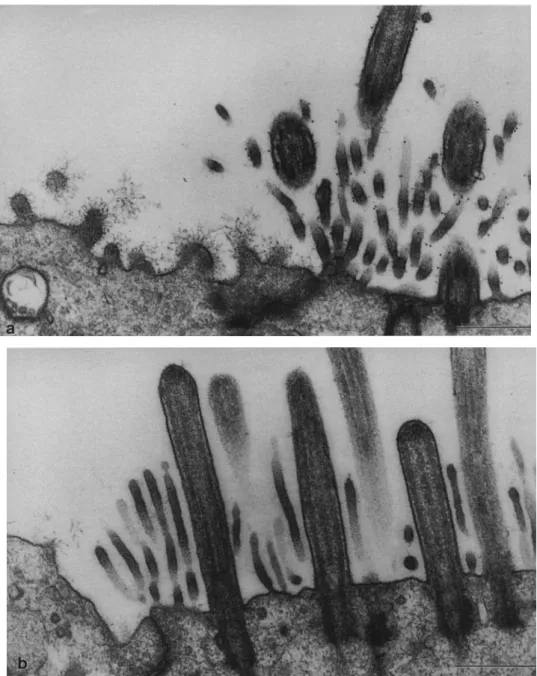
Figure 2. Ultrastructural
local-ization of RTE3 antigen. Primary cultures of RTE cells were reacted with the mAb RTE3 (a) or control antibody (b), followed by in-cubation with gold-conjugated goat anti-mouse IgG, and then processed for TEM. a. A repre-sentative photomicrograph of a ciliated cell with mature cilia, mi-crovilli, and basal bodies is shown next to a nonciliated cell. The cili-ated cell shows clear labeling of the cilia, microvilli, and apical membrane with gold beads. The adjacent nonciliated cell is not la-beled. b. Background staining with the negative control antibody was negligible. Bars = 0.5Jlm.
Quantitation of Mucin Production
Mucin production was measured using a mAb, RTEll (19), which reacts with rat mucin. Briefly, samples were collected by rinsing the apical surface of cells with PBS. Rat mucin standard was purified from hyaluronidase-digested apical secretions from day 14 to 21 RTE cultures by elution in the void volume from a Sepharose CL-4B column. For sandwich enzyme-linked immunosorbent assays, 96-well plates (#3590; Costar) were coated overnight at 4°C with 0.5 JLglwell mAb RTEll in 0.9% NaCI, 0.1 M NaHC03 , pH 9.5, then rinsed
twice with 20 mM Tris, pH 7.6, 137 mM NaCI, 0.05% Tween-20 (TBST). Wells were blocked with 5% milk in TBST for 1 h at room temperature. Samples or standards were diluted in 1% milk-TBST and added to antibody-coated wells for 30 min at room temperature. Wells were washed with TBST and then a 1:500 dilution of peroxidase-con-jugated rabbit anti-mucin in 1% milk-TBST was added to the
wells for
a
30-min room temperature incubation. After washing again with TBST, color was developed with 0.4 mg/ml O-phenylenediamine-Hel, 0.012% hydrogen perox-ide, 40 mM citric acid, 0.1 M Na2 H P 04 , pH 5.0. Thereac-tion was stopped with HCI, and absorbance was measured at 490 nm in a plate reader.
Results
mAb RTE3 Stains Ciliated Cells in RTE Cultures
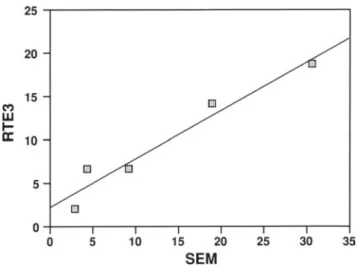
Figure 3. Correlation between RTE3 and SEM measurements of
ciliated surface area. Cultures of RTE cells were immunostained with RTE3, and the percentage of surface area ciliated was esti-mated. The identical filters were processed for SEM, and the per-centage of surface area ciliated was estimated from a series of pho-tomicrographs at 1,000X. Each point shows an individual culture membrane and represents the average of at least 10 individual mea-surements by SEM and RTE3. The line shown was derived by linear regression. The correlation coefficient between the two methods was 0.97.
mAb RTE3 Recognizes a Surface Antigen Expressed on Ciliated Cells
To determine more precisely the distribution of the antigen recognized by mAb RTE3, cultures were incubated with mAb RTE3 followed by incubation with gold-conjugated goat anti-mouse IgG. Thin sections were then examined by TEM. Labeling on the surface of the cilia, microvilli, and plasma membrane of ciliated cells was observed (Figure 2a). Labeling of nonciliated cells was negligible (Figure 2a), as was labeling with the control antibody (Figure 2b). This demonstrates that RTE3 reacts specifically with an antigen expressed on the apical membrane of ciliated cells.
RTE3 Immunostaining Can Be Used to Quantitate Ciliated Cell Differentiation
Air-liquid interface cultures were fixed, immunostained with RTE3, and whole-mounted on slides. Quantitation of the stained area was performed by image analysis, as de-scribed in MATERIALS AND METHODS. The use of the immu-nostaining method to estimate the extent of ciliated cell differentiation was supported by the following studies. First, those cultures that showed an increase in the number of ciliated cells visible by phase microscopy during the culture period also showed an increase in RTE3 staining. Second, cultures grown under four different conditions (see below) were stained with RTE3 and the percentage of surface area covered with ciliated cells was estimated using the image analysis program. The same culture membranes were then processed for SEM, and a series of photomicrographs were taken at 1,000X. The percentage of surface area covered by ciliated cells was then measured in the photomicrographs and compared with the estimates obtained by the RTE3 im-munostaining procedure. The results using the two
proce-Figure 4. Immunostaining of RTE cell cultures grown under
differ-ent conditions. RTE cells were cultured for14.days under different conditions and were immunostained with mAb RTE3. Conditions shown include (a) air-liquid interface, eM, (b)submerged, CM, and (c) air-liquid interface, CM for days 1 through 7, and eM with-out EGF for days 7 through 14. Bars
=
0.2 mID.dures showed good agreement (Figure 3), with a correlation coefficient between the two methods of 0.97. Finally, 200 RTE3-positive cells were randomly selected at low power. The culture membranes were scored using the image analy-sis system and then the individual cells were examined by high-power light microscopy (l,OOOx). Some heterogeneity of staining was noted with the RTE3 antibody; some heavily ciliated cells appeared lightly stained, while some cells that possessed abundant microvilli but few or no cilia were heav-ily stained. Both lightly and heavheav-ily stained cells were in-cluded in the analysis. Greater than 90%of the cells scored positive by the RTE3 immunostaining procedure displayed 35
30 25 15 20
SEM
10 25
20
15 M W
...
a:
10[) 5
rn
0
*
1
*
-1
*
T*
•
-600
0
I
-....
e
500
0o
~ 0
400
~
0
~
ca
CI)l
-e:(
300
CI)
(.)
ca
~ I
-::::J
200
en
-c
CI)....
.!
100
-
.-0
0
Sub -HC -BPE -CT
Condition
-EGF
Figure 6. Scanning electron micrograph of a day 14 culture. RTE
cells were grown in CM for 7 days and then for an additional 7 days at an air-liquid interface in CM lacking EGF. Abundant cilia are evident on the culture surface. Bar
=
10JLm.Figure 5. Effect of culture conditions on ciliated cell differentiation.
RTE cells were cultured under different conditions and immuno-stained with mAb RTE3. The percentage of surface area covered by ciliated cells was estimated as described in MATERIALS AND METHODS. Control cultures contained CM for the entire 14 days, and an air-liquid interface was established at day 7. Conditions shown are: Sub= cells were grown submerged in CM for 14 days; -HC and -CT
=
cells were grown with an air-liquid interface in CM without HC or CT (days 0 through 14), respectively; -BPE and - EGF=
cells were grown with an air-liquid interface in CM without BPE or EGF (days 7 through 14), respectively. Results from two experiments (one containing control, Sub, and -HC groups; one containing control, -BPE, -CT, and -EGF groups) are shown. Data are the average of 2 or 3 cultures per experiment, expressed as percentage of control cultures grown in parallel. Error bars indicate standard deviation (Sub, - HC) or range (-BPE, -CT, -EGF).*
Significantly different from control atP<
0.05by Student's t test.
visible cilia. Of the remaining 10% positive cells, almost all had abundant microvilli and probably represent preciliated cells. These results demonstrate that immunostaining with RTE3 is a reliable method to evaluate the extent of ciliated cell differentiation in RTE cultures.
Mitogen Withdrawal Stimulates and Submersion Inhibits Ciliated Cell Differentiation
To identify factors regulating ciliated cell differentiation, the effect of several modified culture conditions on ciliated cell development was examined. Control cultures of RTE cells were grown as described in CM with an air-liquid interface created on day 7 of culture. Parallel cultures were grown un-der the following conditions:(1)in CM but no air-liquid in-terface was created (Le., submerged culture); (2) HC and(3)
CT were omitted from the media at the start of the culture,
with an air-liquid interface created on day 7; (4) EGF and
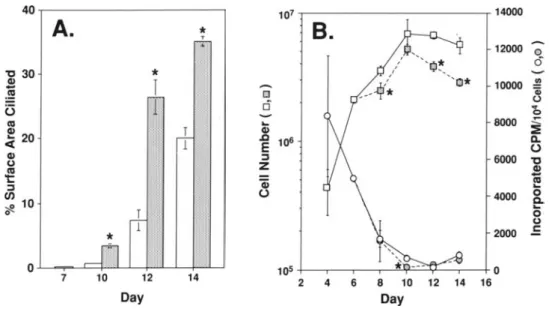
Figure 7. Effect of mitogen re- 40 107 14000
moval on ciliated cell differenti-
A.
*
B.
ation, cell number, and DNA T
synthesis. RTE cells were grown ...,, 12000 0
'$~ <5
for 7 days in CM and then for 7 "C 30
*
II/ ,additional days in CM with or ..,CD
I
4~
'0*
10000 .!!J.without EGF and CT. A. At the ~ rn , - '
'i)
0 0
days indicated, cultures were im- (3
"I:t
0
ca
...
8000 ,....munostained with RTE3 to deter- CD
...
CD ~20 J:2
mine the percentage of surface <C E 106 a.0
area covered by ciliated cells. B. CDu Z:s 6000 "C
In parallel cultures, cell number 't:ca a; ..,caCD
(squares)and DNA synthesis per CJ):s 0 4000
...
0104 cells (circles) was deter- -;!!. 10 a.
...
mined. Each point represents the
0 T o·
1 u
average of three cultures
±
SD.*
2000 .EOpen symbols: control; shaded
symbols: -EGF/-CT.
*
Signifi- 0 105 0cantly different from control at 7 10 12 14 2 4 6 8 10 12 14 16
P
<
0.05 using the Student'sttest. Day DayMitogen Removal Accelerates Ciliated Cell Development and Reduces Cell Proliferation
Cultures of RTE cells were grown submerged in CM until the cells were confluent (day 7 or 8 of culture). An air-liquid interface was then created, and in one half of the cultures me-dia was replenished daily with CM, while in the other half of the cultures media was replenished with CM without EGF and CT (-EGF/ -CT). Groups of three cultures from each condition were analyzed by RTE3 staining every 2 to 3 days until the end of the experiment. Cell number and DNA syn-thesis were measured in parallel cultures.
The removal of EGF and CT resulted in a morerapid increase in ciliated cell development; by 3 days, the - EGF/ -CT cultures showed a 5-fold increase over controls in the percentage of surface area covered by ciliated cells (Figure 7A). After 5 and 7 days in the reduced growth factor media, the percentage of ciliated surface area was 4-fold and 2-fold greater, respectively, than in controls. About one third of the culture surface was covered by ciliated cells 7 days af-ter removal of EGF and CT.
RTE cells cultured under control conditions undergo an initial period of rapid proliferation before reaching a plateau at between 2 to 8 x 10⁶ cells per culture (Figure 7B).
DNA synthesis was high early in culture and decreased by nearly two orders of magnitude as the cultures entered pla-teau phase. Removing EGF and CT from the media at day 7 resulted in a further decrease in DNA synthesis. At day 10, DNA synthesis in the -EGF/-CT cultures was 5-fold less than in the CM cultures (1.31
±
0.5x
102/104 cells versus6.77
±
1.69x
102 cpm/lf)' cells). The decrease in DNA synthesis was followed by a decrease in cell number, so that by day 14 the - EGF/ -CT group of cultures contained about 50% fewer cells (2.9±
0.2x
106cells in the -EGF/-CTgroup versus 5.6
±
1x
106cells in the CM group). Thisexperiment was repeated with the same results.
Because the removal of EGF and CT from the media caused a decrease in total cell number, the measurements of ciliated surface area may underestimate the effect of remov-ing EGF and CT on ciliated cell differentiation. For example, if two cultures contained the same number of ciliated cells
on the surf~ce, but one contained twice as many cells, the percentage of ciliated cells could differ by 50 %. Therefore, the actual percentage of ciliated cells in the two groups was determined in an additional experiment. Cultures grown in CM and -EGF/-CT as above were dissociated enzymati-cally at day 14, and cytospins were prepared. The cytospins were immunostained with RTE3, and the percentage of ciliated cells was determined. The - EGF/ -CT cultures con-tained 33 % ciliated cells, compared with only 8%in the CM cultures, indicating that withdrawal of mitogens probably in-creased ciliated cell differentiation to a greater extent than estimated by the immunostaining procedure.
To examine the effect of withdrawing EGF and CT from the media on the overall morphology of the cultures, thin sections were prepared from CM and -EGF/-CT cultures 7 days after creation of the air-liquid interface. Except for the increased number of ciliated cells in the -EGF/-CT cul-ture, no obvious differences were observed between the two groups. Both cultures showed some variability in the thick-ness of the epithelium, with most areas of the culture mem-brane covered by a pseudostratified epithelium containing morphologically identifiable ciliated, secretory, and basal cells (Figure 8).
Mitogen Removal Decreases Mucin Production
It was observed during media changes that the - EGF/-CT cultures appeared to be producing less mucus-like, viscous material on the apical surface than the CM cultures. Mucus production was therefore measured in an enzyme-linked im-munosorbent assay using mAb RTE11, which has been shown to react with rat mucin (18, 19). The -EGF/-CT tures produced 2- to 3-fold less mucin than the control cul-tures (0.7
±
0.1 versus 2.3±
0.2JLImucin equivalents at day15; significantly different atP
<
0.005).Discussion
Figure 8. Morphology of
14-day-old air-liquid interface cultures. a. RTE cells were cultured in CM for 14 days. b. RTE cells were cultured in CM for 7 days and then in CM without EGF and CT from day 7 through 14. The his-tology of the two cultures is simi-lar except that more ciliated cells are evident in panel b. Lee's meth-ylene blue-basic fuchsin stain, l-um-thick methacrylate sec-tions. Bars = 10Itm.
several stages in the formation of cilia. These included the appearance of fibrogranular aggregates, their maturation into deuterosomes, centrioles, and then basal bodies, and the as-sembly of the actual cilium (see also reference 21). However, the cellular pathway and the regulation of ciliated cell devel-opment in the airways is not well understood. This has been at least partially due to the lack of a suitable in vitro system that supports ciliated cell differentiation. Recently, a number of reports have described the presence of ciliated cells in cul-tured airway epithelium (9-15). Our laboratory has de-scribed a procedure in which RTE cells seeded on a collagen gel-coated membrane and cultured at an air-liquid interface differentiate into both secretory and ciliated cells (16). In this study, our goals were to develop a method to rapidly quanti-tate ciliated cell differentiation in RTE cultures and to iden-tify major factors regulating ciliated cell development.
RTE3 was previously shown to react with the surface of ciliated cells in rat tracheobronchial epithelium (19). Ultra-structural immunocytochemistry demonstrated that RTE3 was highly specific for ciliated cells. RTE3 clearly labeled the apical plasma membrane, microvilli, and cilia of cili-ated cells, with negligible labeling of noncilicili-ated cells. Preciliated cells, identified by the presence of long, thin mi-crovilli and basal bodies in the absence of mature cilia (13, 20, 22, 23), were also lightly labeled by mAb RTE3; how-ever, a more extensive study would be needed to conclude that the RTE3 antigen is expressed in preciliated cells. Other investigators have also described an antibody that recognizes ciliated cells in the absence of mature cilia (24). Immuno-staining of RTE cultures with. RTE3 and measuring the amount of stained surface area gave similar estimates of the extent of ciliated cell differentiation as more labor-intensive procedures such as SEM. The RTE3 immunostaining proce-dure allowed us to rapidly assess the effect of experimental variables on ciliated cell differentiation.
We observed that ciliated cell differentiation was inhibited by as much as 25-fold when RTE cultures were submerged with approximately 0.1 ml of media/em', This agrees with a previous report by Kaartinen and colleagues (16) that ciliated cell differentiation in RTE cultures is inhibited by submersion. Other studies have also demonstrated increased ciliogenesis in air-exposed cultures (11, 12, 14, 15, 25). However, ciliated cell differentiation has also been shown to occur in submerged cultures of hamster tracheal epithelial
cells when grown on a collagen gel in the presence of condi-tioned media (26). Ciliated cells also develop in submerged cultures of human nasal epithelium when grown in suspen-sion, but not when the same cells are cultured attached to a collagen gel (13). Ciliogenesis is also known to occur in fetal airways, which are submerged in fluid until birth (23). Thus, the effect of submersion on ciliated cell differentiation appears to be specific, both for the species and the particular culture conditions used. Additional studies will be necessary to understand the mechanism by which submersion inhibits ciliated cell differentiation.
Removal of HC from the media for the entire culture period resulted in an approximately 50%decrease in the amount of ciliated surface area compared with control RTE cultures. Our observations are in agreement with the earlier report that HC also improved the morphological differentia-tion obtained in cultures of canine tracheal epithelium (9). However, the canine tracheal cells were plated at a high den-sity (1
x
106 cells/em'); therefore, the effect observed oncanine cells may have been on maintenance of the differen-tiated phenotype and not on differentiation itself. It is in-teresting to note that steroid treatment has also been reported to increase ciliogenesis in asthma patients (27). Therefore, the possible role of steroids in ciliogenesis and ciliated cell differentiation should be examined further.
These results indicate that high levels of growth-promoting factors may inhibit ciliated cell differentiation.
The removal of EGF and CT from the culture media resulted in a higher percentage of ciliated cells at each time point examined. DNA synthesis was significantly reduced in the -EGF/-CT groups at day 10. However, the observed increase in ciliated cell differentiation after withdrawal of mitogens may not be the direct result of a decrease in pro-liferation, because the rate of DNA synthesis decreases rap-idly as confluence is attained in both the CM and the -EGF/ -CT cultures. The decrease in DNA synthesis was followed by a reduction of total cell number in the - EGF/ -CT groups. This decrease in cell number may be the result of in-creased ciliated (terminal) cell differentiation.
The mechanism(s) by which removal of growth factors leads to an increase in ciliated cell differentiation is un-known. However, in other systems, mitogenic compounds have been shown to have significant effectson differentiation. For example, depletion of mitogens from the media of myo-blast cell lines results in muscle cell differentiation (28, 29). Terminal differentiation is inhibited by EGF in cultures of human (30) and mouse (31) keratinocytes. EGF is also known to have many other effects in addition to stimulating growth. For example, our laboratory has shown that EGF treatment of primary RTE cells increases fibronectin RNA and protein expression and induces organization of a fibrillar matrix (P. Ferriola and associates, unpublished data). In the present studies, the removal of EGF and CT decreased the secretion of mucus in addition to increasing the percentage of ciliated cells. Removing EGF from cultures of RTE cells has also been shown to reduce the number of secretory cells present in RTE cultures (K. Guzman and associates, unpub-lished data). An increase in ciliated cell differentiation while the number of secretory cells decreases is consistent with the hypothesis that secretory cells are the precursors for ciliated cells. Further studies will be needed to understand fully the mechanisms by which mitogen withdrawal regulates ciliated and/or secretory cell differentiation and the interrelation-ships between them.
The results presented here may lead to improvements in conditions for the culture of respiratory epithelium. Many of the factors commonly used in cultures of airway epithelial cells have been shown to increase proliferation. However, the effects of these compounds on differentiation in air-liquid cultures has not been carefully examined. The normal rat tra-chea has been reported to contain between 17%and 33%
ciliated cells (32). In RTE cultures grown in the absence of EGF and CT, we observed
>
30%ciliated cells, in good agreement with thein vivoestimates. These studies have also identified conditions that significantly reduce or enhance ciliated cell development, and will form the basis of further studies directed at understanding the regulation and pathway of ciliated cell differentiation.In conclusion, these studies have identified submersion and mitogenic compounds as being key regulators of ciliated cell differentiation in vitro. Our results indicate that factors that stimulate proliferation of tracheobronchial epithelium may inhibit ciliated cell differentiation. Identification of other factors \that regulate airway cell differentiation and
their mechanism(s) of action may be useful in the treatment of some disease states.
Acknowledgments:The authors thank Dr. Pat Coin for assistance with the image analysis system, Vicky Madden for her expert assistance with the SEM work, and Dr. David Umbach for assistance with statistical analysis.
References
1. Lee, R. M. K. W., andJ.B. Forrest. 1991. Structure and function of cilia. InThe Lung: Scientific Foundations. R. G. Crystal and J. B. West, edi-tors. Raven Press, New York. 169-181.
2. Diamond, G., D. E. Jones, and C. L. Bevins. 1993. Airway epithelial cells are the site of expression of a mammalian antimicrobial peptide gene. Proc. NatI. Acad. Sci. USA 90:4596-4600.
3. Rossi, G. A., O. Sacco, B. Balbi, S. Oddera, T. Mattioni, G. Corte, C. Ravazzoni, and L. Allegra. 1990. Human ciliated bronchial epithelial cells: expression of the HLA-DR antigens and of the HLA-DR alpha gene, modulation of the HLA-DR antigens by gamma-interferon and antigen-presenting function in the mixed leukocyte reaction.Am.J.Respir. Cell Mol. BioI. 3:431-439.
4. Sturgess, J. M. 1989. Ciliated cells of the lung.InLung Cell Biology. D. Massaro, editor. Marcel Dekker, New York. 115-151.
5. Abdi, S., M. J. Evans, R. A. Cox, H. Lubbesmeyer, D. N. Herndon, and D. L. Traber. 1990. Inhalation injury to tracheal epithelium in an ovine model of cotton smoke exposure.Am. Rev. Respir. Dis. 142:1436-1439. 6. Carson, J. L., A. M. Collier, S. S. Hu, and R. B. Devlin. 1993. Effect
of nitrogen dioxide on human nasal epithelium.Am.J.Respir. Cell Mol. BioI. 9:264-270.
7. Colizzo F., M. J. Krantz, J. E. Fish, and A. T. Hastie. 1992. Ciliated respi-ratory epithelial surface changes after formaldehyde exposure.J.Toxicol. Environ. Health 35:221-234.
8. Keenan, K. P., J. W. Combs, and E. M. McDowell. 1982. Regeneration of hamster tracheal epithelium after mechanical injury. Virchows Arch. B Cell PathoI.41: 193-214.
9. van Scott, M. R., N. P. Lee, J. R. Yankaskas, and R. C. Boucher. 1988. Effect of hormones on growth and function of cultured canine tracheal epi-thelial cells. Am.J.Physiol. 255(Cell PhysioI.24):C237-C245. 10. Baeza-Squiban, A., E. Boisvieux-ulrich, C. Guilianelli, O. Houcine, G.
Geraud, C. Guennou, and F. Marano. 1994. Extracellular matrix-dependent differentiation of rabbit tracheal epithelial cells in primary cul-ture.In Vitro Cell. Dev. Bioi.30A:56-67.
11. Adler, K. B., P.-W. Cheng, and K. C. Kim. 1990. Characterization of guinea pig tracheal epithelial cells maintained in biphasic organotypic cul-ture: cellular composition and biochemical analysis of released glycocon-jugates.Am.J.Respir. Cell Mol. Bioi. 2:145-154.
12. Dejong, P. M., M. A. J. A. Van Sterkenburg, S. C. Hesseling, J. A. Kem-penaar, A. A. Mulder, A. M. Mommaas, J. H. Dijkman, and M. Ponec. 1994. Ciliogenesis in human bronchial epithelial cells cultured at the air-liquid interface. Am. J. Respir. Cell Mol. Bioi. 10:271-277. 13. JorissenM., B. VanderSchueren, H. VandenBerghe, andJ.-J. Cassiman.
1990. Ciliogenesis in cultured human nasal epithelium.ORL 52:368-374. 14. Whitcutt, M. J., K. B. Adler, and R. Wu. 1988. A biphasic chamber
sys-tem for maintaining polarity of differentiation of cultured respiratory tract epithelial cells. In Vitro Cell. Dev. Bioi. 24:420-428.
15. Yamaya, M., W. E. Finkbeiner, S. Y. Chun, andJ. H. Widdicombe. 1992. Differentiated structure and function of cultures from human tracheal epi-thelium.Am.J.Physiol. 262(Lung Cell Mol. Physiol. 6):L713-L724. 16. Kaartinen, L., P. Nettesheim, K. B. Adler, and S. H. Randell. 1993. Rat
tracheal epithelial cell differentiationin vitro. In Vitro Cell. Dev.Biol. 29A:481-492.
17. Barrow, R. E., C.-Z. Wang, R. A. Cox, and M. J. Evans. 1992. Cellular sequence of tracheal repair in sheep after smoke inhalation injury.Lung 170:331-338.
18. Shimizu, T., P. Nettesheim, F. C. S. Ramaekers, and S. H. Randell. 1992. Expression of "cell-type-specific" markers during rat tracheal epithelial regeneration. Am.J.Respir. Cell Mol. BioI. 7:30-41.
19. Shimizu, T., P. Nettesheim, E. M. Eddy, and S. H. Randell. 1992. Mono-clonal antibody (Mab) markers for subpopulations of rat tracheal epithe-lial (RTE) cells.Exp. Lung Res. 18:323-343.
20. Sorokin, S. P. 1968. Reconstruction of centriole formation and ciliogenesis in mammalian lungs.J. Cell Sci. 3:207-230.
21. Dirksen, E. R. 1991. Centriole and basal body formation during ciliogene-sis revisited. BioI. Cell 72:31-38.
22. Moscoso, G., K. Nandra, and M. Driver. 1989. Ciliogenesis and ciliation of the respiratory epithelium in the human fetal cartilaginous trachea. PathoI. Res. Pract. 184: 161-167.
In vivo ciliogenesis in human fetal tracheal epithelium. Am. J. Anat. 185:415-428.
24. Aitken, M. L., M. Villalon, M. Pier, P. Verdugo, and M. Nameroff. 1993. Characterization of a marker of differentiation for tracheal ciliated cells independent of ciliation. Am.J.Respir. Cell Mol. BioI. 9:26-32. 25. Kondo, M., W. E. Finkbeiner, and J. H. Widdicombe. 1991. A simple
technique for culture of highly differentiated cells from dog tracheal epi-thelium. Am.J.Physiol. 261(Lung Cell. Mol. Physiol. 5):L106-Ll17. 26. Lee, T.-C., R. Wu, A. R. Brody, J. C. Barrett, and P. Nettesheim. 1984. Growth and differentiation of hamster tracheal epithelial cells in culture. Exp. Lung Res. 6:27-45.
27. Heino, M., J. Karjalainen, J. Ylikoski, A. Laitinen, and L. A. Laitinen. 1988. Bronchial ciliogenesis and oral steroid treatment in patients with asthma. Br.J.Dis. Chest 82: 175-178.
28. Trouche, D., M. Grigoriev, J.-L. Lenormand, P. Robin, S. A. Leibovitch, P. Sassone-Corsi, and A. Harel-Bellan. 1993. Repression of c-fos
pro-moter by MyoD on muscle cell differentiation. Nature 363:79-82. 29. Coppola, J. A., B. A. Lewis, and M. D. Cole. 1990. Increased
retino-blastoma gene expression is associated with late stages of differentiation in many different cell types. Oncogene 5:1731-1733.
30. Marchese, C., J. Rubin, D. Ron, A. Faggioni, M. R. Torrisi, A. Messina, L. Frati, and S. A. Aaronson. 1990. Human keratinocyte growth factor activity on proliferation and differentiation of human keratinocytes: differentiation response distinguishes KGF from EGF family.J. Cell. Physiol. 144:326-332.
31. Drozdoff, V., and W. J. Pledger. 1993. Commitment to differentiation and expression of early differentiation markers in murine keratinocytes in vitro are regulated independently of extracellular calcium concentrations.
J.Cell BioI. 123:909-919.