Comparison of SNR Improvement for Lower
Atmospheric Signals Using Wavelets
S. Kavya Sindhura
1, Dr. S. Narayana Reddy
2, P. Kamaraj
3PG Student (CS), Dept. of ECE, SV University College of Engineering, Tirupati, India1
Professor, Dept. of ECE, SV University College of Engineering, Tirupati, India2
Scientist/Engineer-SD, National Atmospheric Research Laboratory (NARL), Gadanki, Tirupati, India3
ABSTRACT: Lower Atmosphere Wind Profiler (LAWP) radar is to provide wind profiles in the atmospheric boundary layer (ABL) and lower troposphere. It gives important data for research on winds and atmospheric boundary layer. However, LAWP radar is relatively low-cost system and it is yet to be developed in India. Hence it is very important to develop de-noising algorithms for LAWP system. LAWP system gives good resolution wind profiler parameters in all weather conditions[3].In wind profiler radar, height profiler of wind vector by detecting Doppler shift of return signals and SNR can be computed by signal processing technique in LAWP.In this paper SNR is improved by using different wavelet de-noising techniques. Among these symlets, coiflets,daubechies,biorthogonalwavelets. coiflet gives maximum SNR. SNR is computed for denoised and original signals. By comparing all these wavelets coiflet wavelet gives 10db improvement in SNR for LAWP signals.
KEYWORDS: Wavelet, Symlet, Coiflet, Biorthogonal, Daubechies, De-noising, Signal to Noise Ratio
I. INTRODUCTION
Radar wind profiler, a coherent-pulse-Doppler radar, derive information on the dynamical atmospheric phenomena (winds, turbulence and waves) by making use of variations in amplitude and frequency of radio waves which are transmitted from radar system, backscattered by the atmospheric refractive index irregularities and received by radar system again. The L-band Lower Atmospheric Wind Profiler (LAWP) is used for conducting research in the lower atmosphere [4]. National Atmospheric Research Laboratory (NARL) at Gadanki (13.47°N,79.18°E) near Tirupati, India has been operating this1280 MHz, atmospheric radar for studying structure and dynamics of the lower atmosphere. The wind, as it varies in direction and/or speed, produces turbulent eddies (small, whirling currents of air). Wind velocity profiles are very important for studying meteorological phenomena and for weather forecasting. These radars achieve better range resolution with maximum average power (height coverage).
II. LOWER ATMOSPHERIC WIND PROFILER (LAWP) RADAR
Atmospheric radars operating in the lower VHF (40-60 MHz) band has some distinct advantages. The vertical atmospheric motions can be measured at these frequencies, even during the rainfall. However, these radars have a serious limitation, namely their inability to measure high-resolution winds in the first few kilometres. Radar wind profiler operating in the frequency band 900-1400 MHz has become very popular for measuring the wind vector in the lower part of the atmosphere. It is also referred as Lower Atmospheric Wind Profiler or boundary layer (BL) radar as it probes up to about 5 km.The system should have a height resolution of 100 m or better. The features of high spatial resolution and fast system recovery time require operation at frequencies near 1000 MHz and these wind profiler radars are very high sensitive, coherent and pulse Doppler Radars.
Fig 1: Block diagram of LAWP Radar
Technical features of the LAWP system are listed below:
Should operate in 1250-1400 MHz
(allotted band in the Indian region)
Operate with DBS technique.
Minimum height range should be as low as 100m
Maximum height range should be about 3-6 km in clear air and up to 12 km during precipitation
Utilize solid-state technology
Compact and transportable
Relatively inexpensive
Pulse length range is 0.25µs to 8µs
System recovery time should be < 0.5µs(to meet minimum range of 100m)
Radar wind profilers use either Doppler Beam Swinging (DBS) technique or Spaced Antenna (SA) technique for measuring the atmospheric winds. Present work uses DBS technique for measuring the atmospheric winds [2].
III. DATA PROCESSING
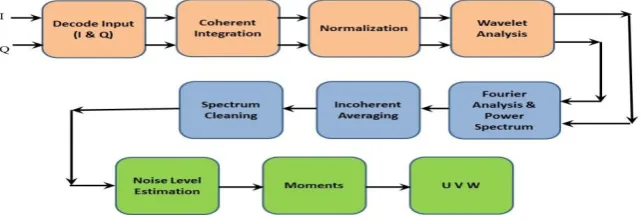
The received signals are converted into quadrature base band signals using the down converter and quadrature detection. The demodulated quadrature signals, which represent the combination of signal plus noise are sampled at regular intervals. The Data processing steps includes pulse compression, coherent integration, spectral processing steps like clutter removal, incoherent integration etc.
The Profiler‟s Range Resolution is equal to
c
/2.The best range resolution is obtained with short pulse length but the profiler‟s height coverage will be minimum due to low average transmit power. Receiver noise is independent from one IPP to the next, whereas the signal remains coherent over the same period. This characteristic of received signal being phase-coherent over many IPPs allows the integration of weak complex signal samples of several pulses to improve the „detectability‟. This process, carried out independently for each range gate, is known as „coherent integration‟.The time series complex data {(Ii, Qi), i = 0, 1. . . NFFT - 1} is subjected to FFT to obtain the complex Doppler spectrum {(Xi, Yi), i = 0. . .NFFT - 1} of the received echoes. Ii, and Qi are the in-phase and quadrature components in time series data, Xi, and Yi are the real and imaginary components of the complex Doppler spectral data. The incoherent averaging procedure makes it easier to discriminate the signal from the noise, i.e., improves the detectability.
IV. WAVELETS
A wavelet is a wave like oscillation with amplitude that begins at zero, increases, and then decreases back to zero. Wavelet transformation is one of the most popular candidates of the time-frequency transformations. Wavelet transform decomposes a signal into a set of basic functions. These basis functions are called wavelets. Wavelets are obtained from a single prototype wavelet y (t) called mother wavelet by dilations and shifting
Ψa, b (t) = 1
aψ t−b
a (1)
An analysing function ψ (t) is classified as a wavelet if the following mathematical criteria is satisfied.
Coiflets wavelets:
Fig3.Types of coiflets
Coiflet wavelets: Coiflets are discrete wavelets developed by Daubechies. On the request of Ronald Coifman, by using vanishing moments we get scaling functions. Coiflet wavelets are symmetric. It has L/3 vanishing moments and L/3-1scaling functions.
Bi-orthogonal wavelets:
Fig4:Types of biorthogonal wavelets
Daubechies wavelets:
Fig5: Types of Daubechies wavelets
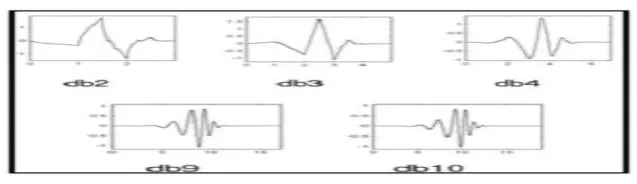
Daubechies wavelets: The Daubechies family is named after Ingrid Daubechies who invented the compactly supported orthonormal wavelet, making wavelet analysis in discrete time .It chooses scaling function with highest vanishing moments depends on order, If it is high then we have better frequency localization of decomposition.dbM, M is order.
Symlets wavelets:
Fig6: Types of symlets
Symlet wavelets: Symlet wavelets are modified version of daubechies wavelets with increased symmetry and have great symmetry.symM, where M is order.
V. WAVELET DE-NOISING
Wavelet analysis is used for removing noise and extracting signal for many data. Wavelets have been used in Spectrum cleaning of the atmospheric signals. Different types of wavelets are in use. The wavelet families like symlets, coiflets, daubechies etc., have their own specifications. Signal degradation is very less in wavelet denoising.
The term „de-noising‟, describing various schemes which attempt to reject noise by damping or thresholding in the wavelet domain. The aim of this study is to decide which wavelet function is optimum to de-noise the radar signal.
The basic steps required for wavelet de-noising:
A) Selection of Wavelet:
B) Obtaining Wavelet Transform Coefficient:
Compute the wavelet decomposition of the signal at the selected level N separately for I data and Q data of the received raw data signal. Here decomposition of signal is performed at level 3.
C) Selection of Threshold:
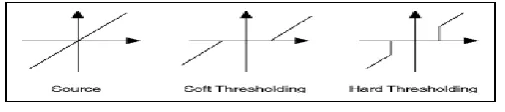
Thresholding is the important step in wavelet de-noising. In wavelet transform denoising is done by representing the signal by a small number of coefficients. The signal is composed into L levels before thresholding is applied. There are two types of thresholding (as Shown in fig. 8).
1) Hard thresholding: It zeros out small coefficients, resulting in an efficient representation.
2) Soft thresholding: It softens the coefficients exceeding the threshold by lowering them by the threshold .
When thresholding is applied, no perfect reconstruction of the original signal is possible.
Fig 8: Thresholding
D) Reconstruction:
Reconstruct the signal using the approximation coefficients of level 3and the modified detail coefficients of levels from 1 to 3.
VI. LAWP RADAR SIGNALS DE-NOISING USING COIF2 WAVELET
De-noising is applied to LAWP Radar data of August 20, 2014.
Algorithm for Doppler profile using coif2 wavelet:
• DC removal from the raw data using Hilbert transform technique. • FFT computation for the raw data.
• Signal to noise ratio is computed for each range bin. • The raw data is de-noised using coif2 wavelet.
VII. RESULTS
Comparison of the SNRs for the LAWP Radar data on different dates using Wavelet de-noising
Wavelets
SNR in dB
EAST WEST NORTH SOUTH
Db10 7.72 7.71 7.69 7.23
Coif2 10.20 10.27 10.33 9.68
Sym8 8.73 8.89 9.02 8.23 Bior2.8 9.14 9.16 9.11 8.54
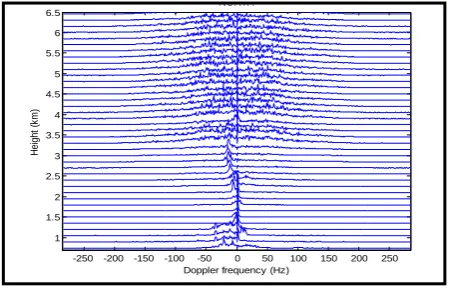
Fig 9: Before De-noising
Power spectrum plot for before De-noising(Height verses Doppler frequency).
Fig 10: After De-noising
Power spectrum plot for After De-noising(Height verses Doppler frequency).
-250 -200 -150 -100 -50 0 50 100 150 200 250 1 1.5 2 2.5 3 3.5 4 4.5 5 5.5 6 6.5
Doppler frequency (Hz)
H e ig h t (k m )
-250 -200 -150 -100 -50 0 50 100 150 200 250 1 1.5 2 2.5 3 3.5 4 4.5 5 5.5 6 6.5
Doppler frequency (Hz)
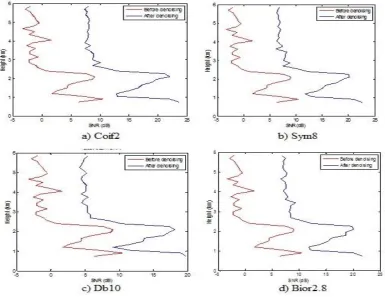
Fig 11: Comparison of SNR for before and after De-noising using different wavelets
Comparison of SNR for before and after De-noising using Coiflet wavelet is shown in fig 11(a).Comparison of SNR for before and after De-noising using Symlet wavelet is shown in fig 11(b).Comparison of SNR for before and after De-noising using Daubechies wavelet is shown in fig 11(c).Comparison of SNR for before and after De-noising using Bi-orthogonal wavelet is shown in fig 11(d).
VIII. CONCLUSIONS
In this paper we have discussed about improvement of signal to noise ratio and comparison of SNR for LAWP Radar signals using different wavelets. SNR is improved by minimizing the noise in LAWP signals through coiflet wavelet de-noising. The improvement is observed by comparing original signal and de-noised signals. Improvement of 10dB is observed after using coiflet wavelet de-noising technique.
IX. ACKNOWLEDGEMENT
Prof. D. Jayaraman, Director, P. Kamaraj, Scientist/Engineer - SD and Smt. P. Yashoda, Scientist/Engineer – SD from NARL, Dept. of Space, Gadanki is gratefully acknowledged for supporting and providing the data.
REFERENCES
1) P. Srinivasulu, P. Yasodha, S. N. Reddy, S.Satyanarayana and A. Jayaraman,“Simplified Active Array L-Band Radar for Atmospheric Wind Profiling: Initial Results”, Journal of Atmospheric and Oceanic Technology, Volume 28, 1436-1447, November 2011.
3) P. Srinivasulu, P. Yasodha, P. Kamaraj, S. N. Reddy, T. N. Rao, and A.Jayaraman, “Development of Lower Atmospheric Wind Profiling Radars at NARL” Presented at National Space Science Symposium, NSSS-2012, organized by S. V. University, February, 2012 (won the second best paper award)
4) P. Srinivasulu, P. Yasodha, T. Rajendra Prasad, T. N. Rao and S. Narayana Reddy, “Development of 1280 MHz Active Array Radar at NARL”, International Radar Symposium India-2009, organized by IEEE in Bangalore, December 2009.
5) Donoho D L and Johnstone I M (1994), “Threshold Selection for Wavelet Shrinkage of Noisy Data”, IEEE. 6) Hildebrand, P. H., R. S. Sekhon, “Objective determination of the noise level in Doppler spectra”, J. Appl.
Meteorol.Pp808-811, 1974.
BIOGRAPHY
Ms.S.Kavya Sindhura completed her B.Tech in Electronics & Communication Engineering at Sri Venkateswara College of Engineering, Tirupati, Affiliation to JNTUA, Anantapur, INDIA in 2013. She is pursuing her M.Tech Degree with specialization in Communication Systems (CS) at SVUCE, SV University, Tirupati, INDIA. Her areas of interest include Signal Processing and Communication Systems.
Dr.S.Narayana Reddy worked as Scientist in SAMEER in the design of MST RADAR system for 4 years and later joined as Assistant Professor in the Department of EEE at S.V.University Tirupati, INDIA.He has 25 years of experience in teaching and research.Presently he is working as Professor in the department of ECE at S.V.University.He is life Member of ISTE, fellow of IETE, fellow IE(I).He has published more than 80 papers in various National and International papers/conferences and guided 9 Ph.D scholars, His current interests include radar systems, signal processing and antenna systems.