A study of the spring diatom increase in Loch Striven
26
0
0
Full text
(2) ~I'pth 00 1T1. .. IP. .0. 190. 1,0. 100. ,. merYes~l. l '\. Ma'(ch 10(;'. 0. . \,. \.. \. 201. 20. .. '. ... '.'. li ... ,.'.:\: . \ \ ., 0. ~. .301. 40. oP. 1.0. lapOfi' .(O(;J°f / ... '. "IQO 0".. 5. '-.( /. ( Moxch. ,. 11'-". I I I I I I I I. 20. 30. 40 0 5. '. \. j: ,\ I: ,\ I: .I \; ,I I.. .. .. ,. .,. : .. I i' I : i/ : y.. '" / (. I. I I I I. \. 1.0. \. (. JO. I I I I I I. 40. 0. .. :. ~. :. tOO. . -- '-. -- '. :. ,. 10. Maych 16"'. 0, 0,. 20. '\ :. .I \ :I 0. \.. i1. '\ i 0. .30. \. l I I. '. , :,. 0. I.. I. 1000. IQOOO. I I I I I I I I I. /.i J '-"" ". : ./'. \ \ i. " :. 401 I, " '1 40 75 /00 r.O,sat. so 75 100 125 /50 SO 8'0 pH 7.5 &0 8'S 1'5 ~ Os 0 /5 .30 45 60 75 a 15 .30 45 St 1-0/8 f020 1022 /.014 /'026 fOl8 /-020 /-022 FIG. I.-The. \ I. :. I. : I :. i : I , I ,.. , 10. 5. \. I I. lol. / ',"# '. ' ..', '0 \ : :. \. , \. 40. ...,,(' .',,'' :. \, .. .. /. :.. :/'. .\ .I. I,. Ii. ... I I I I. \.. k. Maych 14'!'. \1 ". ... : './. I. .\ . ,I.. ~. '0 15 tho. I ;. :J. I \ Maych. J. :. I. ... 10. : 0. :. .. :\. 30. 5. \ '\. I. 10. 20. :. \.. ,. oP \. \,. ..":i-,. 1000. '. I. 10. \. ,\. Maych 8~'. 19°0 ,. / '.: s,. 5. \. '/. spring increase in 1927.. --- diatoms,.. . . . . pH,- - - 0. satn., - .-. - . p.O. mg.percubicmetre,-.. -. .St.. .:.: ,\ :" : \.. '. ,. \. I I I I I. 125. 15/)' 8'5 75. 60 1-024. 1'026.
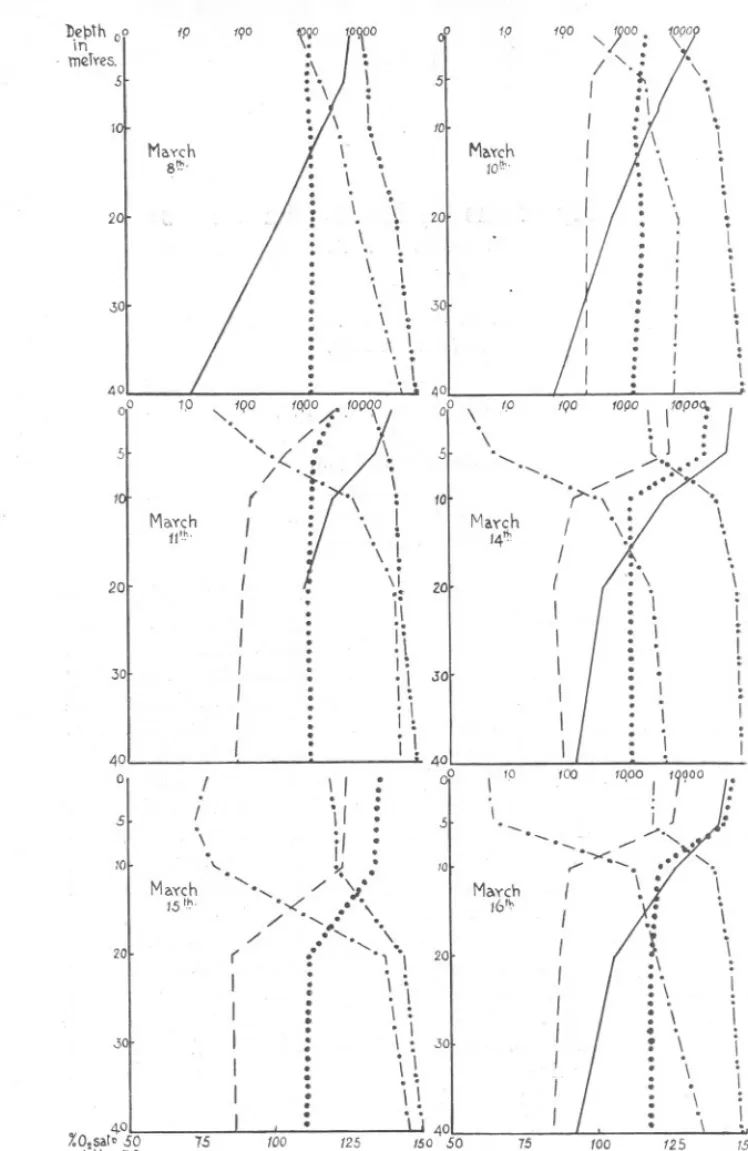
(3) SPRING. DiATOM. INCREASE.. 855. deeper water, so that the maximum at 5 fathoms occurred the week after the maximum at the sUrface, and the maximum at 10 fathoms a week later. After this the fall was rapid, showing that the diatoms had sunk below the depth to which photosynthesis was possible. Three weeks after the beginning of the increase the diatoms had almost disappeared from the loch. The chemical factors showed a similar series of changes, the pH value and oxygen content rising and the phosphate falling with an increase in diatom numbers. In 1927 (see Figs. 1, 2, 3 and 8, and Table 1) the loch was visited more frequently and the depths worked were 0, 5, 10, 20 and 40 metres. The increase had started before the first visit was made on March 8th and there were more than 5000 diatom chains per 20 c.c. in both surface and 5-metre samples. This is an unusually early increase when compared with previous years. The diatoms had increased again on the 10th, and between the lOth and the 11th the numbers were doubled at the surface (16,700 to 33,100) and 5 metres (6900 to 16,400). This very rapid change was accompanied by a sharp rise in oxygen saturation (110% to 121%), a slight rise in pH value and a marked fall in dissolved phosphate. In the deeper water, however, there was also a considerable change, the phosphate and dissolved oxygen saturation values being different from that for the 10th. This leads one to suppose that the change was not due entirely to diatom growth, but that the water examined was not the same as on the previous day. That such an increase can take place naturally, however, is shown by Gran (1927). At this time the surface density was lower than that of the other layers so that no vertical mixing was going on. On the 14th a- fall in density at surface and 5 metres stabilised the loch still further and the chemical changes were correspondingly more marked. The diatoms also reached their maximum for the increase and were almost as numerous at 5 metres (51,000) as at the surface (62,700), but this is probably due to the mixing of the waters between these depths. On the 15th there was a hard S.E. wind and the effect of this was similar to that described by Murray for some Scottish lochs (1888) and by Gran and Gaarder (1918) for the Oslo fiord. The surface waters were piled up in the loch so that the values found the previous day at surface and 5 metres were now found at surface, 5 and 10 metres. Diatoms were not counted this day, but it is almost certain that the high figures would have been found at 10 metres also. On the 16th and 17th conditions had returned to normal and were very much the same as on the 14th. By the 18th diatoms were very much more numerous at 5 metres than at the surface in spite of the fact that the density at these depths was much the same. This shows that the diatoms have begun to sink and this process had gone still further by the 22nd when the maximum numbers.
(4) {OO. !I. \ \. meTY'\!S,S. ':'.1''' 10 'l. iJ. '--. --'-... r. ~,. Ma'l"cn '9t):.. 40 0,. I. //. r,. :. '". 10000. 10 \' OO. 5~. J. ,. \'". / '". 10. /. ". i\. n~'. ". ~. I. '~I,., I. .30. ~. \. \. \. 4° 0°. ,. :. "". I. '. \,. \~..'. ). / \'.;\,. I. '. ,. I I I. ,. i \. 20. \. \. \. '\. \. '.. .30. \"~. Ma.ych. ". I I I I I. :. \ J : >', ,.' ">(.. I. (. !. I. : \. 20. .. 40. (. 23':~'. \,. I. I. '\. "'". M3~ch. ,. \ : .: \.'\,. \ :. I,. .s. \. " ", :. : .30. ,. I I I I. .30. \. '\. 20'. :I. .\. /. I. 18"". \. ,. '\. /. 20t. Moycn. : \. \. " " ,. \. : \. ~. 10'. '". : '. \. ". \. "".5. .,,' " ,,'. \ ". <f. :. //",. I I I J J I I I I. Ma.vch 1t". tel. 5. : 0°. .,. :. ;''. . \. /. / /. :. '. \. ''\:. '\,. !.. ~ '\. :,!. :',. '. [0°00. ,. .s fa. \. \.'. \. :' \. ". 2'. \" :. \:. ~... '\: . .: \ '. \.. .\. i '. \. :. ,. \. \ '. LJ. 150 85 75 f.oz6.
(5) SPRING. DIATOM. 857. INCREASE,. were found from 10 to 40 metres. By the 25th numbers at all depths had fallen and the increase was over. There are no chemical changes corresponding to the high diatom numbers at and below 20 metres, which indicates that the diatoms are sinking passively and that no photo~ synthesis is going on there. An examination of the loch at intervals of about two days shows that the regularity of the increase is not so marked as when the examination is made only once a week. These irregularities are partly because in an enclosed area the effect of wind and tide is much more marked than in the open sea. Another p'oint of interest is that the increase falls off before all ~i?lJth 0 In merYe5.. 5 10. I. I \. Mo.~ch 2.6m. .. \". ,. \ ", .: I "".:' ..t J. \. ~ \. /. /. :"', : ~. "' /. 20. :". '". /. 30. / /. : :..'. I .\ .. :. \. \. \. .\. \: '\:. .:\ .\. /. I : \. 401 I :"' %02sQI~50 75 100 /25 ISO P.H. 7'S 8-0 8-5 PzO 0 15 30 45 60 7-5 St5 1018 1020 1022 1024 102b. -. FIG. 3.-The spring increase in 1927 (contd.). diatoms, pH, O2 satn., - - P205 mg. per cubic metre, - ..- .. St.. - . . .. ....,.. ---. the phosphate is utilised, which is at variance with the results obtained in the open sea (Atkins, 1926), but is in agreement with the results obtained during the spring increase in the same loch in 1926. No other essential nutrient salts were estimated, however, and it is possible that one of these may have been limiting. There is, nevertheless, a definite relationship between the chemical factors and the diatoms. Estimation of small quantities of phosphate is not very exact when diatoms are very numerous, for they then give the sample a brownish tinge which interferes somewhat with the blue colour given by the phosphate reagent. In 1928 (see Figs. 4, 5, 6 and 9, and Table 2) the number of diatoms was estimated by counting the cells and not the chains. Several counts. ----.
(6) 100. 1000. . :. 10000. IOO. 11. SI. II. .. .. :r. . ... 101 Maych. 14th. 1. I :. jO. 17. Ii Ii. 51. If! Maych. I. 111'00. I. : .:. ,. 201. 301. t. 30 100\1 n. !I. II.. 101 MaYch :t:td. It. It. 2.01. II. Ii. Ii. Ii 100. 2 .51. 101 M(\'(ch 2.9t.. 201. :'. '.'. :. .. .:. I. If a I , " I. ./. .. I : .I. .. J. , 100. 10. r. Ii. M..Ych :t6t!'.. /'. ,". I I. I. 20. I I. I I. I I I I. . :. ,. ". .. \. :.. ..'.. I I. ... I. ...:. I :. .. , :. '. \. .I. I. 0. 5. . \ J '.. ... to Apyil 2d.. \ .. .,. . :. . '... \ \. . \. .. ,I. ... .II t. \. I. ,. .. . '. 20. \. I. ,.. ..... spring increase. I.. I. :. JO. %0'5arso 75 12.5 ISO 50 7.5 IJ H 7-5 8'0 8,5 7'05 p0 0 15 .30 45 60 75 0 IS 30 'si fatS 1.020 1'022 f{i24 l-02.b I{)/B 1.020 FIG. 4.-The. ;.. 2. : I ' ::. .... Ii. 3°'0. ,. ;(i. II. i : l. .. .: \. .'.. ,.. \. \l. lOCO. .5. 1'. .. .:.. '. \ :. 100. 2.. . I .... \. , .. \, .. .. .,. .30'. 0°. fOOOt. '. j,. 010. I 00. \. 20. 100. SI. 30. :. I. ... ,.. I. " I. I. .. .. 19th. 100000. ,... I 'I. I If. ... 100. 100000. DfJth metyes2. or. in 1928.. diatoms,. . . . . . pH,- - - O2satn., - . - . -'" . P20Smg.percubicmetre,- .. - .. St.. 125 60 ,.024. 150 8',5 7S 1.026.
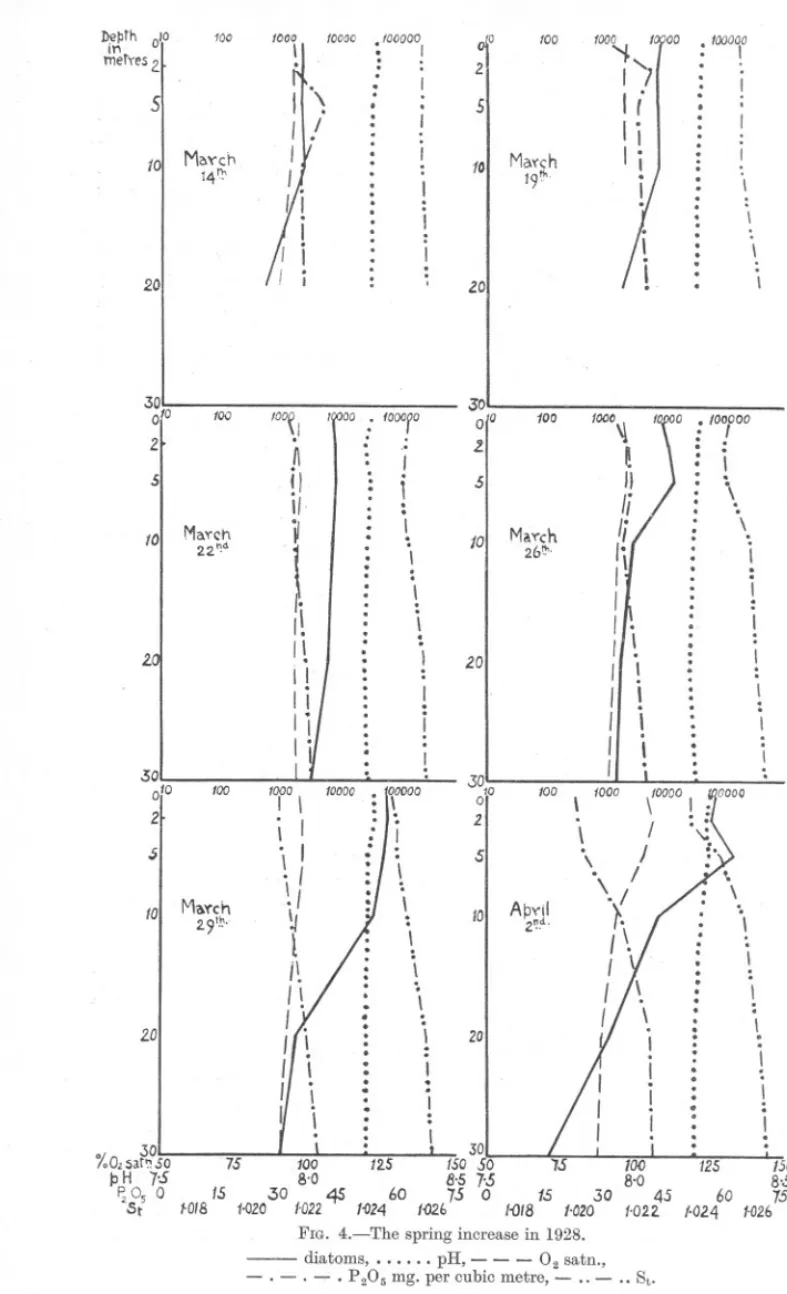
(7) SPRING. DIATOM. INCREASE.. 859. gave an average of about 10 cells per chain and this figure held till the end of the increase when it fell somewhat. They were counted in this way to bring the work into line with that done elsewhere, and the comparison with 1926 and 1927 can be made by multiplying the figures for those years by 10. Gran (1929) estimates that the number of cells in a chain of Skeletonema costatum is 16 or more. The reason for the difference may be that our samples were centrifuged living and not after preserving. The depths worked were 0, 2, 5, 10 and 20 metres. The additional depth of 2 metres was chosen because the maximum amount of photosynthesis may not occur at the surface. On March 14th there were already between two and three thousand cells per 20 C.c.down to a depth of 10 metres. This is higher than normal for winter, and a certain amount of growth must have been going on. The pH value was also higher than the normal winter value. By March 19th numbers had increased at all depths counted but were still much the same, 7000 to 8000 from 0 to 10 metres. Values for density, oxygen saturation, pH and phosphate show the same conditions. The temperature overturn had not yet taken place and the loch was therefore in an unstable condition in which vertical mixing was possible. Conditions were much the same on the 22nd, but mixing, and along with it, diatom numbers had spread deeper. The increase had progressed considerably by the 26th and diatoms were fairly rich (9000 cells at the surface, 11,300 at 2~metres, 13,500 at 5 metres). At the same time, however, density was al~ost uniform to 5 metres so that this distribution is apparently not due to a real sinking of the diatoms but to vertical mixing to this depth. The chemical changes also agreed with density. By the 29th the temperature had risen at the surface, the loch was in a more stable condition, and there was a great increase in the number of diatoms down to 10 metres. The values for the chemical factors, however, showed little alteration. On April 2nd the loch was supersaturated with oxygen down to 5 metres and the phosphate values had fallen as far as the same depth. The diatom distribution was irregular, rising as far as five metres, then falling sharply in the deeper water. Two days later, on April 4th, density had fallen again at the surface and there was a steep gradient from there down to 10 metres. Corresponding with this phosphate had fallen to zero at the surface, the oxygen saturation had risen to 115% and pH value had also risen, while the diatoms had multiplied still further and were richer in the 2-metre sample (248,000) than at the surface (180,000). Since the loch was now quite stable, this is probably a real sinking and not caused simply by mixing. . On April 6th the loch remained stable, the diatoms had fallen to 5 metres where they reached their maximum number for this increase (510,000 cells in 2(/ c.c.), the oxygen saturation had also reached its.
(8) Oo. 2r. ,. s,. fOO. " .. 1000. (0000 ,. .\. ,. ". /'(. ". \ fOI ApYil. \. /. /.. . /. ~I. 6~h.. ,'. ""'.. .'. 'y'. ;. ;/\. ') t. , \. ,. ". I'. 20. lO. '. 1. I .. .. I I. I l. /t. I 301 O. 100. (OOOO .1 if,. fOO(). r.. z.'", 5. ,i Ii:I ., .\ I. "'. I',,'. .. 101 Apyil ~.. ),. .I ,. I. ~. 10. 1~ ~I. .. '.. 1000. '. /. s. /. I. '-' I. 20. I. ,. '.. \. \. I. \. I I , \. ".. i:. /. 12."". \",. / 10000. JOooo,. /. '.. \. 3D!. 1000~Q. 100. I. .. 100000. 10000. i. ~1. '. 5. ~ I t. :; . ". .. :. \'. :: :, .:. ". j. fO. ::. I\ I \. :. :. I". :. :". I I. .' ApYl1 191)).. i. ],. ~. I. r,. I. I' \. 20. \. /. I. :. ". . I. \. " '\. .. J'. %02sat~SO RH. 1-5 P,0 0 IS St'S 1.0/8. .. f,. ". ~. J. AP'I'il. '. \. U. ZO. J'. ,. .I I I \ .""". \. \. I:. ~\ I. ! I. fOI ApYil /61!:. 10000. I. i. .. I '. I \ I '. 30. I. I. \/ I~\.. zo. I. /000. ".. : \,. :. .;. 100. 5. :. '. ,. 9. 30 01° z,. I. I0 S 100 125 ISO 8,5 7-5 8'0 8'S 60 7S 0 15 JO 45 60 7s f'OZ4 1{)26 IOt8 1-020 1{)2Z 1-024 1-026 FIG, 5,-The. -. -,. spring increase in 1928 (contd.).. diatoms,'. . , . . pH,- - - 0. satn.,. - . -.. p.Os mg,percubicmetre,-., -. ... St,.
(9) SPRING. DIATOM. 86'1. INCREASE.. maximum (138% at 2 metres), pH value had risen to 8.47, and phosphate had fallen at 2 and 5 metres. There are slight discrepancies in the phosphate results at surface and 2 metres on the 4th, 6th and 9th. These are due in part at least to the increased difficulty in matching colours when diatoms are very numerous. It is curious that on the 6th, although the diatom present was as before, Skeletonema costatum, the type of cell was quite different from that of previous days, the cells being both larger and longer. This new type was found at surface and 2 metres while in all other samples they ])eprh. 0. °. tO,oo. .:. ..I. 100.029. ~erTes 2 1. ... .: \.. \. 5. \ 101 Ap'!'iI. 261\,. \. /. 1. \. \. 1 '.1. ;.. 20. I. ,. ii'! Ii. Ii .30-. ---. ..:. .:. .. I.. :..'. i... ". .: i. :. i. :. .I .. I I. , ,. %02SoJn 5075 100 12.5 ISO I:5H 7'5 8'0 8'5 ROO 15. .30 45 60 75 ?t 5 1-018 1'020 1022 1-024 (-026 FIG. 6.-The. spring increase in 1928 (contd.).. --- diatoms,.. . . . . pH,- - - 0. satn., - . - . - . p.Osmg.percubicmetre,-.. -.. St. were of the usual form. On April 9th the diatoms were sinking and numbers had fallen except in the deeper water. The new type of Skeletonema cell was predominant at surface and 2 metres, at 5 metres the types were mixed and below this a few chains of the new type were present at each depth. Density conditions had altered again, so that there was vertical mixing between 0 and 2 metres, and between 5 and 10 metres. The chemical factors were correspondingly altered. By April 12th mixing had gone on to 5 metres and had brought up a fresh supply of phosphate into the surface water, at the same time lowering pH and oxygen saturation values. With the introduction of phosphate the diatoms had increased slightly again at the surface and 2 metres..
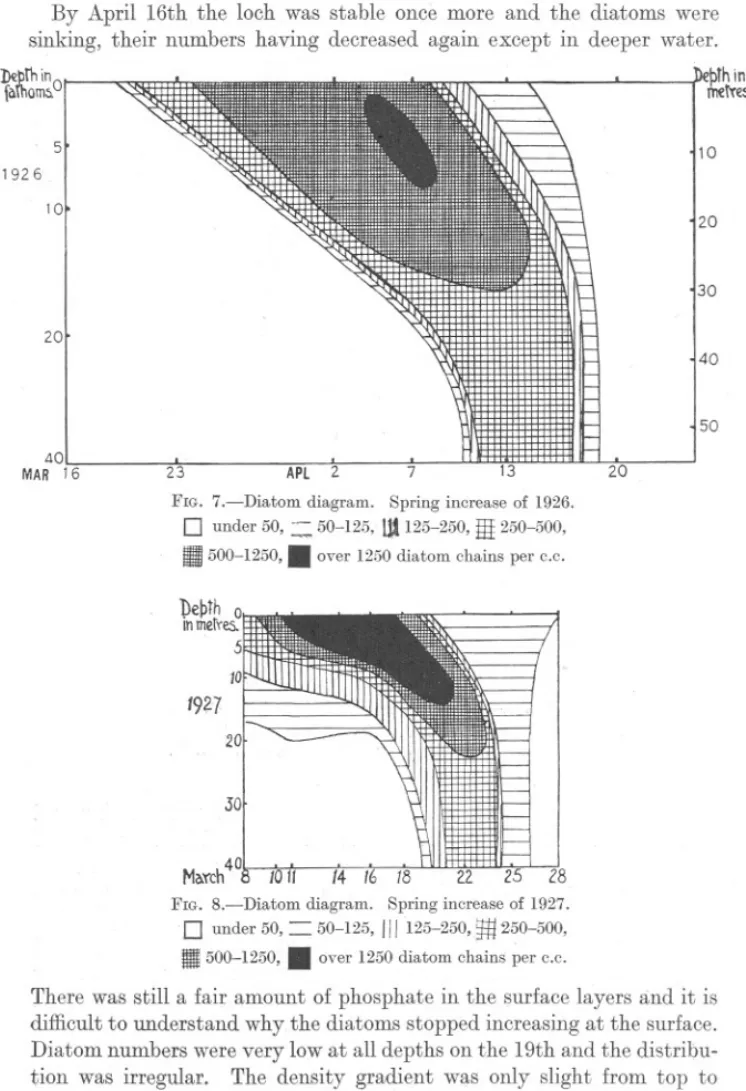
(10) 862. S. M. MARSHALL AND A. P. ORR.. The newtype of cell had disappearedand all samplescontainedonly the old type.. .. By April 16th the loch was stable once more and the diatoms were sinking, their numbers having decreased again except in deeper water. D£prhin faThom:;.°1. ~IIIIII'.. I'. 'NJ ,. ~. .. 5. ~bthin 1'netTes. 10. 1926 10. 20. 30 20 40. 50 40 MAR 16. 23. APl. FIG. 7.-Diatom. 2. diagram.. 0. under 50, ~ 11500-1250,.. 13. 7. 20. Spring increase of 1926.. 50-125, Ut 125-250,HI 250-500, over 1250 diatom chains per c.c.. 20. 30 40 March I FIG. S.-Diatom. 0 Ii. under 50,. 500-1250,. 2.8 diagram. Spring increase of 1927. 50-125, 111125-250, 250-500,. .. =. ~. over 1250 diatom chains per c.c.. There was still a fair amount of phosphate in the surface layers and it is difficult to understand why the diatoms stopped increasing at the surface. Diatom numbers were very low at all depths on the 19th and the distribution was irregular. The density gradient was only slight from top to.
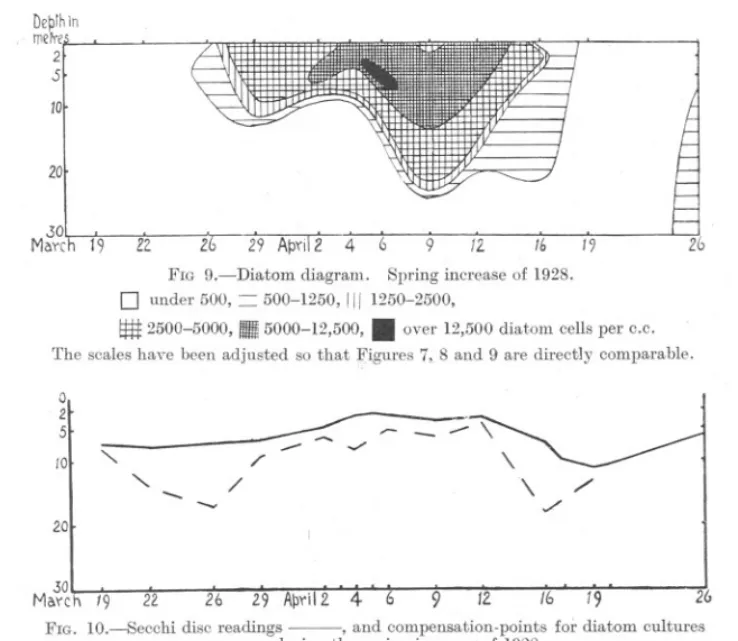
(11) 863. SPRING DIATOM INCREASE.. bottom and the loch appeared to be mixed. A week later it was visited again and there was evidence that another small increase of diatoms had taken place meanwhile, for the phosphate value had fallen a little, the pH value and oxygen saturation had risen and the diatoms increased in numbers down to 10 metres and then remained constant down to 30 metres. The spring increase of 1928 was thus of a quite different type from that of 1926 and 1927, being much less regular. It began while vertical DeprhIn metre 2 S. 10 20. I .30 Maych19. --.. l2. 6. Z FIG 9.-Diatom. diagram.. 9. Spring increase. .. 0. under 500, = 500-1250,III 1250-2500,. ~. 2500-5000,. I11III5000-12,500,. 12. 16. 19. of 1928.. over 12,500 diatom. cells per C.c.. The scales have been adjusted so that Figures 7, 8 and 9 are directly comparable. 0 2 5 10. ". - --. '". /. -- ::: ../. r-. - ,/'. /. 20. .30. . Maych 19. 22. 26. 29 ApYil2 4. 6. 9. /2.. 16. 19. 26. FIG. 1O Secchi disc readings -, and compensation-pointsfor diatom cultures - - -, during the spring increase of 1928.. mixing was still going on and the diatoms increased in numbers simultaneously down to a considerable depth instead of only at the surface as usual. Since in deeper water there was not enough light for growth, the diatoms there sank as soon as mixing stopped and there was a great fluctuation in numbers at depths of 10 and 20 metres. When the temperature rose and stabilisation took place, the increase progressed much as in previous years, increasing rapidly at the surface and then sinking downwards. This process was interrupted, however, by further mixing, this time due to wind as well as temperature, and diatom numbers rose at the surface once more..
(12) 864. S. M. MARSHALL AND A. P. ORR.. There ttre thus two hctors responsiblefor the verticttl distribution of the diatoms. First, there is the sinking of the diatoms which is strongly marked in the years 1926 and 1927 and is particularly clear in the late autumn of 1926 (Marshall and Orr, 1927). Second, there is the mixing of the diatoms which occurs when the sea-water itself is mixed by wind or temperature. This is recognisable by a uniform density at the depths mixed. This second factor was of considerable importance in 1928, but was found only on one occasion in 1927 (see p. 855). Another unusual event in the increase of 1928 was the change of diatom type for a short period, although the species remained unaltered. There was no apparent cause for either its arrival or its departure. Finally, as in the years 1926 and 1927, the end of the spring increase was not marked by a total lack of phosphate in the surface layers, but there was sufficient still in solution to supply another increase which in all probability followed after a short interval. The spring increase starts at a time of year when the light for photosynthesis is comparatively poor, except at the surface, and the enormous number of diatoms present must decrease the light available still further. The figures for oxygen content are to some extent a measure of the amount of photosynthesis going on, but they are not reliable, partly because during the increase the water was often supersaturated and so gave too low an estimate of the oxygen produced, and partly because during the windy weather there was probably a good deal of movement among the different water layers. It was therefore thought of inter'est to estimate the amount of photosynthesis possible by sinking diatom cultures to different depths in the sea and measuring the amount of oxygen produced. Since the sea at that time was an almost pure culture of Skeletonema costatum, some samples of sea-water were tested in the same way. A culture of Coscinosira J!°lychordawas used, while the seawater samples used were taken from various depths (see Marshall and Orr, 1928). The most important external factor was, as might be expected, the number of diatoms present in the sea, and during the increase the total photosynthesis decreased from day to day as the cloud of diatoms in the water grew denser. Figure 11 and Tables 4 and 5 show two curves for diatom culture photosynthesis in the sea, the first taken before and the second during the spring increase of 1928. In the curve for March 22nd-23rd the oxygen production at 5 metres was considerable and the compensation-point lay between 10 and 20 metres. In the curve I. for April 6th-7th. a steep fall occurred. between. t. and 2 metres. and. another between 2 and 5 metres, while the compensation-point lay between 2 and 5 metres. Since there was more sunshine on April 6th than on March 22nd, the smaller amount of photosynthesis going on at and below 2 metres must be ascribed to the effect of a thick screen of diatoms.
(13) SPRING. DIATOM. 865. INCREASE.. in the surface water. The same type of result is seen in Figure 12 of which the curve for March 18th-19th was taken during, and that for March 28th29th after the spring increase of 1927. After the diatoms had disappeared the photosynthesis at 5 metres increased again considerably. There was more sunshine on March 28th-29th than on March 18th-19th and the ~~Th in mqr~es. 0 Z 5 10. 20. a. b. .300 05 a 02Pl'oducedpee IObdlO-Toms inccper lirw.. 05. FIG. ll.-Oxygen production per 106 diatoms in Loch Striven, (a) 22-23/3/28 (0.41 hours sunshine), (b) 6-7/4/28 (4.25 hours sunshine).. DepTn in merW5. 01 5. 10. 20. a 40ij 0-5 6 O2p~oducqd per 10.diarom:i In c.c. po~ Iirn. b o.s. FIG. 12.-0xygen production per 106 diatoms in Loch Striven, (a) 18-19/3/27 (no sunshine), (b) 28-29/3/27 (5 hours 50 minutes sunshine).. greater amount of photosynthesis at 5 metres may be due in part to this, but, as shown below, it is probable that it was also caused partly by the disappearance of the diatoms from the surface waters. . There is thus a relation between the type of curve and the number of diatoms present in the water. This is shown clearly in Figure10 and Table 3,.
(14) 866. S. 1\L MARSHALL AND A. P. ORR.. where the compensation-points of eleven culture experiments carried out during the increase are plotted under the diatom increase diagram. The actual figures for compensation-points were arrived at by interpolation and are therefore only approximate. Before the increase began it was as deep as 17 metres, during the increase it rose as near the surface as 4 metres, and after the increase it sank again to 18 metres. This result is further confirmed by the Secchi disc readings which are plotted on the same figure. Before the increase the disc was seen to 7 metres and it disappeared at 2t metres during the height of the increase on April 5th. Diatoms were not counted on this day, but were at their recorded maximum on the 6th when the Secchi disc disappeared at 3 metres. After the increase was over, the reading was as deep as 11 metres. Confirmatory results were obtained with compensation-point figures in 1927, but Secchi disc readings were not taken. If allowance is made for the fact that the Secchi disc is not always seen as deep as the richest layer of diatoms, the correspondence becomes still more marked. Poole a,nd Atkins (1929) have found evidence of a decrease in the intensity of illumination due to the zoo-plankton, but did not find any effect produced by a diatom increase. While no data concerning the effect of the zoo-plankton are available for Loch Striven, the evidence quoted above seems to us conclusive concerning the obscuring effect of the phytoplankton. The results are not explicable either by rainfall or wind, the former by carrying down land detritus and the latter by agitation of the water. The much greater abundance of diatoms in the loch as compared with the open sea offers the most probable explanation of the discrepancy. The diatoms gave a distinct brownish tinge in columns of sea-water 15 cm. deep at the height of the increase and the quantity of detritus in centrifuged water samples was insignificant in comparison with the diatoms. The experiments done with samples of sea-water taken during the course of the increase gave small and irregular results. The production was usually much less than that of a diatom culture and was often within, or very near to, experimental error. This is largely because the diatoms are so much smaller than the culture diatoms that twenty-four hours is hardly long enough to show production. Gaarder and Gran (1927) left samples of sea-water in flasks in the sea for periods of three days and got a considerable amount of oxygen produced. In our experiments the compensation-point was always.found nearer the surface than in"the case of culture diatoms. On an average the compensation-point for diatom cultures during the increase (7 experiments) was 8 metres, while that for sea-water experiments giving positive results (13 experiments) on the same dates as the above"culture experiments was 3 metres. Since the sea diatoms do not produce so much as culture diatoms, it might be thought.
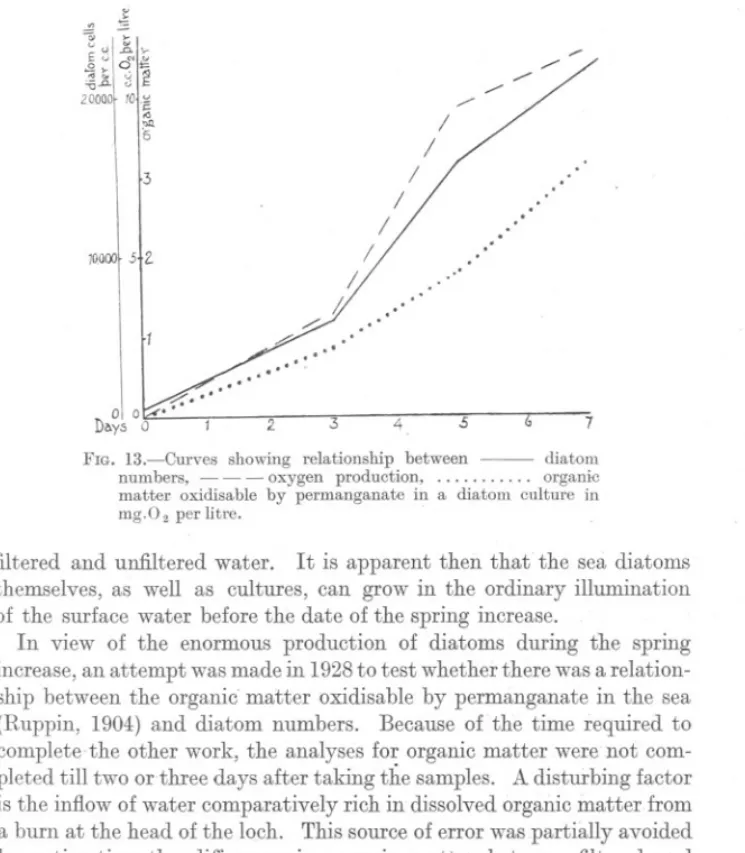
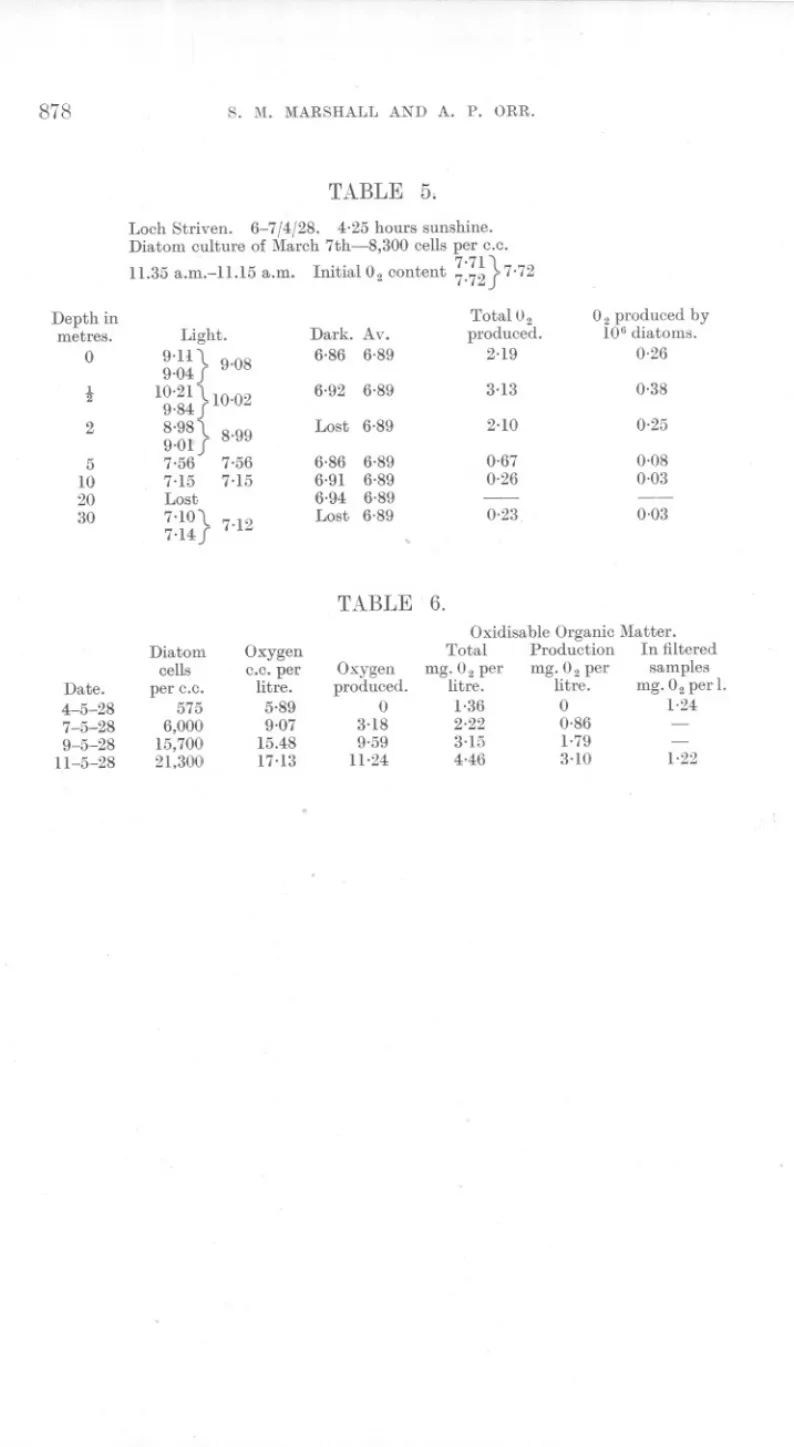
(15) SPRING. DIATOM. 867. INCREASE.. that the illumination before the spring increase, although good enough for the latter (seeFig. lla), was not good enough for the former to multiply. Proof that there is, at the surface at any rate, sufficient light for the growth of sea diatoms, was obtained in another way. Some weeks before the spring increase in 1928, a sample of sea-water was taken.intothe laboratory, filtered through a sterile sintered glass filter (see p. 868) and allowed to stand in an unheated room. After some days a good mrxed cultille of Skeletonema, Thalassiosira, Nitzschia and a few other small forms appeared. Similar results were obtained in December 1929 with both. ~. ~. v ~ K >E v ~.. .2,0;: '" ~. u. ~. 2~~l ~1c. .0 "". I. '6. /. I. 3. .. I.. I. /. JOOOOf 5+Z. I. 11. ..'. ,,'. ::::. Q. ,,'. . " ..." 01 0 Di\.ys 0. ,.'~,..,.." j. 2.. 3. 4. 5. FIG. 13.-Curves showing relationship between numbers, - - - oxygen production, matter oxidisable by permanganate in a diatom mg.O 2 per litre.. 7 diatom organic culture in. filtered and unfiltered water. It is apparent then that the sea diatoms themselves, as well as cultures, can grow in the ordinary illumination of the surface water before the date of the spring increase. In view of the enormous production of diatoms during the spring increase, an attempt was made in 1928to test whether there was a relationship between the organic' matter oxidisable by permanganate in the sea (Ruppin, 1904) and diatom numbers. Because of the time required to complete-the other work, the analyses for organic matter were not completed till two or three days after taking the samples. A disturbing factor is the inflow of water comparatively rich in dissolved organic matter from a burn at the head of the loch. This source of error was partially avoided by estimating the difference in organic matter between filtered and unfiltered samples. The filter used was a Jena sintered glass filter which.
(16) S68. S. M. MARSHALL AND A. P. ORR.. was found to be sufficiently fine in grain to stop practically Rll diRtoms, although a few small forms were usually found on centrifuging the filtrate. The results were small but showed generally an increase with increasing diatom content. There was no good evidence that the organic matter in the filtered samples increased when the diatoms became richer, as would have been expected from the results obtained by Piitter (1924). He states that a large part of the organic matter produced by diatoms diffuses directly into the sea. Support was given to this work of Piitter's by Gran and Gaarder (1927), Gran and Ruud (1926), and Foyn and Gran U t.i >'" .a.. x. '15. .!E. 1i E. ~. '..". . ,.., ... 20,000 1 1O~ '". .a. .." <» u :> ~ 0. G. >.a. d' u 10,00015 v. DayP~ 2. 4 FIG. a.-Diatom. 6. Eo 10 12 /4. /b. 18 20 22 24 26 28. numbers (0) and oxygen production (x) in a diatom culture.. (1928) from results obtained in the Oslo fiord and later in the open sea. They~used a biological method of estimating organic matter. Since the results in sea-water are liable to error, some experiments were carried out with diatom culture, Coscinosira polychorda again being used. A few preliminary tests showed that while the total oxidisable organic matter was variable, the dissolved organic matter was higher in <lultures old enough to have a fair number of dead cells. A culture was then started off by inoculating severallitres of Miquel with a considerable amount of rich culture so that there were about 500 cells per C.c. This was then transferred to a large number of sterile stoppered bottles of about 120 C.c. capacity of which three were used for estimation of dissolved.
(17) SPRING. DIATOM. 869. INCREASE.. oxygen content, diatom numbers and dissolved organic matter, filtered and unfiltered. The results obtained are shown in Figure 13 and Table 6. The difference in organic matter in the filtrate is negligible, showing that the dissolved organic matter does not increase along with the growth of diatoms but probably only when a number of the cells have died. The organic matter in the whole culture increases with the diatoms. At the end of the experiment the diatoms were very rich (21,300cells per c.c.), so that, had diffusion of the organic matter taken place, the filtrate would have shown this clearly. Alkaline permanganate will, of course, only oxidise a portion of the organic matter present. In addition, though the analyses were made as described by Ruppin, it was found that, with diatom cultures, if the time of heating was increased the oxidation was also increased. It seems improbable, however, that any organic matter diffusing from the diatoms and so present in the filtered culture should have been entirely unaffected by it. While the above is true of a young {)ulture, an old culture does show an increase in soluble organic matter, but this is more probably because the dead cells which are present are being attacked by bacteria. The dissolved oxygen was estimated in the hope that it might be possible to find a factor by which the organic matter oxidisable by permanganate must be multiplied to give total organic matter. Th~ increase of oxygen was so rapid and the degree of supersaturation so high that such a figure would be of doubtful significance. By the end of the experiment all the bottles had developed bubbles. The same type of growth was found in a similar experiment (Fig. 14) in which the slower rate of growth was probably due to the smaller amount of light in February than in May. DISCUSSION.. Of the many factors which might influence the beginning of the spring increase, there are several which can be excluded at once. The nutrient salts are probably present in abundance. Only one of these, phosphate, was actually estimated, but it does not seem likely that the mixing which led to the presence of phosphate did not bring up the other food salts .also. Temperature also affects the spring increase only indirectly, since we find that on several occasions it started before the spring temperature .overturn took place. We know, too, that Skeletonema can, and does, grow in waters both considerably warmer and considerably colder. It :flourished at a temperature of 2-30 C. on the Norwegian coast in 1922 (Foyn, 1929), and at a temperature of 8-90 C. in Loch Striven in May, 1926 (Marshall and Orr, 1927), while it appears occasionally in the tropics ((Karsten, 1907). When we come to the question of light intensity the facts are more NEW SERIES.-VOL.. XVI.. No.3.. MAY, 1930.. 3 K.
(18) 870. S. M. MARSHALL AND A. P. ORR.. complt\x. Diiltom cultures grow well in winter, not onlyin the laboratory but also in the sea. The rate of growth is, of course, much slower than in summer and the growth in the sea shows that at the surface this effect is due chiefly to the shorter day. Below the surface the light intensity is suboptimal and growth is affected by both these factors. The result is that the compensation-point rises closer to the surface than in summer, to a depth of about 4 to 6 metres at midwinter (Marshall and Orr, 1928). If we consider now the conditions for the sea diatoms themselves, we see that there is not only a sufficiency of food salts present in the sea throughout the winter, but the diatoms can grow in sea-water some time before the date of the spring increase if they are kept in a light approximately equal to that at 'the surface (see p. 867). Small diatom increases have been recorded after the autumnal temperature overturn has taken place. For example, in Loch Striven in November, 1926, there was a small increase of Skeletonema, and Atkins (1927a) has recorded an increase of Rhizosolenia in late autumn 1925 at Plymouth. In these cases food salts were present in sufficient quantity to have caused quite a large increase but did not do so. A probable explanation of this seems to be that the diatoms did not remain long enough in a sufficiently wellilluminated zone. In other words, the vertical mixing which takes place probably carries the diatoms below their compensation-point. Since the compensation-point in winter lies at 4 to 6 metres for culture diatoms and even nearer the surface for sea diatoms, it would need only a small vertical movement to bring the diatoms below their compensation-point. Such movements do occur in Loch Striven even in summer when the water is comparatively stable if there is a hard up-loch or down-loch wind and will be frequent in winter, during which time the loch is unstable. With the increasing light of the advancing spring, the compensation-point goes deeper and finally the diatoms will no longer be carried below it. Even after the increase has started, however, further mixing may modify its course considerably. Gran (1929) has shown that on the Norwegian coast the spring increase near land is independent of the increase which occurs off the continental shelf. The former comes earlier and depends on the date of the melting of the snows. This fresh water lowers the salinity and adds large quantities of nutrient salts. In the Gulf of Maine also Bigelow (1924) believes that the spring increase depends on the nutrient salts added by the melting snows. This explanation will not hold for any area which has not a permanent covering of snow in winter, for the salts brought down by land drainage are being added all through the winter and are not held up to be added in a comparatively short time during the spring thaw. On the other hand, Atkins (1928), among others, considers that the most important factor is the amount of spring sunshine. Figure 15 shows..
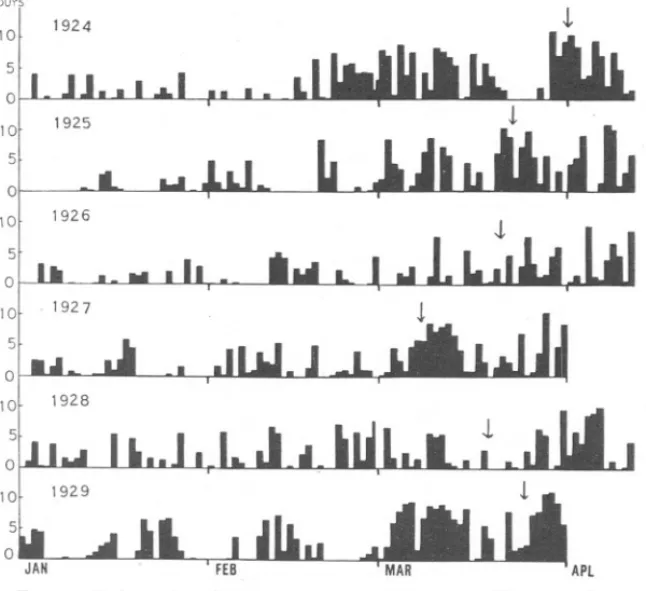
(19) SPRING. DIATOM. 871. INCREASE.. the amount of sunshine daily during the spring months 1924-29, along with the date on which the number of diatom chains reached 20 per c.c. (or 200 in the case of diatom cells).* This is, of course, a purely arbitrary figure, but since the numbers usually increase very rapidly within a few days, the actual figure chosen makes little difference. It will be seen that the date of the spring increase is approximately constant, on about March 20th. In 1924 it was a little later and in 1927 a little earlier than usual, and it is interesting to notice that off the Norwegian coast in 1927 Hours. i. 1924. 10 5. 10'. 1925. 5 0 IQl. 1926. 5 0. FIG. 15.-Daily. sunshine during spring months of 1924-1929. The arrows show the beginning of the spring diatom increase.. it began exceptionally early too (Foyn, 1929). This was not a year with much early sunshine. At Plymouth the spring increase began earlier in 1924 than in 1925 (Atkins, 1927b), whereas the reverse was the case in the Clyde. In Loch Striven, then, it appears that the date of the spring increase is decided chiefly by the total light which depends both on length of day and brightness. Only such a comparatively constant external factor could account for the narrow limits of time within which the increase * The observations. on diatoms. in 1929 were made by J\{r. Elmhirst..
(20) 872. S. M. MARSHALL AND A. P. ORR.. begins. Vertical mixing may alter this date a little, but the incrM9ing light gradually overcomes this factor and allows the spring increase to begin. As soon as the loch becomes stabilised the increase runs its normal course. SUMMARY AND CONCLUSIONS. 1. The spring increase in Loch Striven is described in detail for three consecutive years. Contemporaneous experiments with diatom cultures and sea-water samples helped to elucidate the changes which occurred. Vertical mixing of the water layers was found to have an important effect on the form of the increase. 2. Although there is a relationship between organic matter oxidisable by permanganate and the total number of diatoms present, there is no relationship between dissolved organic matter oxidisable by permanganate and diatoms. We wish to thank Mr. Elmhirst and members of the staff for their help throughout the work. REFERENCES. 1926. ATKINS,W. R. G. A quantitative consideration of some factors concerned in plant growth in water. Part 2. Some chemical factors. Journal du Conseil, Vol. I, No.3. 1927 (a). ATKINS,W. R. G. Seasonal changes in the Silica Content of Natural Waters in Relation to the Phytoplankton. Journ. Mar. BioI. Assoc., N.S., Vol. XIV. 1927 (b). ATKINS,W. R. G. The Phosphate Content of Sea-Water in Relation to the Growth of the Algal Plankton. Ibid., Vol. XIV. 1928. ATKINS,W. R. G. Seasonal variations in the phosphate and silicate content of sea-water during 1926 and 1927 in relation to the phytoplankton crop. Ibid., Vol. XV, No. 1. 1924. BIGELOW,H. B. Plankton of the Offshore waters of the Gulf of Maine. Bulletin of the Bureau of Fisheries, Vol. XL, Part 2. 1929. FOYN,BIRGITHERUUD. Investigations of the Phytoplankton at Lofoten, March-April, 1922-1927. Skrifter utgitt av Det Videnskaps-Akademi i Oslo. 1. Matem.-Naturv. Klasse, 1928, No. 10. 1928. FOYN, B., ANDGRAN,H. H. Uber Oxydation von organischen Stoffen im Meerwasser durch Bacterien. Avhandlinger utgitt av Det Norske Videnskaps-Akademi i Oslo. 1. Matem.-Naturv. Klasse, No.3..
(21) SPRING. DIATOM. INCREASE.. 873. 1927. GAARDER,T.,ANDGRAN,H. H. Investigations of the Production of Plankton in the Oslofjord. Rapports et Proces-verbaux des Reunions, Vol. XLII. 1927. GRAN,H. H. The Production of Plankton in coastal waters off Bergen, March-April, 1922. Report on Norwegian Fishery and Marine Investigations, VoL III, No.8 1929. GRAN, H. H. Investigation of the Production of Plankton outside the Romsdal-fjord, 1926-1927. Rapports et Procesverbaux des Reunions, Vol. LVI. 1918. GRAN,H. H., ANDGAARDER,T. fiber die Einfluss des atmospharischen veranderungen Nordeuropas auf die hydrographischen Verhaltnisse des Kristianiafjord bei Drobak im Marz, 1916. Publications de Oirconstance, No. 71. 1926. GRAN,H. H., ANDRUUD,B. Untersuchungen uber die im Meerwasser gelosten organischen Stoffe und ihr Verhaltnis zur Planktonproduktion. Avhandlinger utgitt av Det Norske Videnskaps-Akademi i Oslo. I. Matem.-Naturv. Klasse, No.6. 1907. KARSTEN,G. Das Indische Phytoplankton nach dem Material der deutschen Tiefsee Expedition, 1898-99. Wissenschaftliche Ergebnisse der deutschen Tiefsee Expedition, Zweiter Band, Zweiter Teil. 1927. MARSHALL, S. M., ANDORR,A. P. The Relation of the Plankton to some Chemical and Physical Factors in the Clyde Sea Area. Journ. Mar. BioI. Assoc., N.S., Vol. XIII, No.4. 1928. MARSHALL, S. M., ANDORR,A. P. The Photosynthesis of Diatom Cultures in the Sea. Journ. Mar. BioI. Assoc., N.S., Vol. XV, No. 1. .. 1888. MURRAY,JOHN. On the effects of winds on the distribution of temperature in the sea- and fresh-water lochs of the West of Scotland. Scottish Geographical Magazine. 1929. POOLE,H. H., ANDATKINS,W. R. G. Photoelectric measurements of submarine illumination throughout the year. Journ. Mar. BioI. Assoc., N.S., Vol. XVI, No. 1. 1924. PUTTER,AUGUST. Der Umfang der Kohlensaurereduktion durch die Planktonalgen. Pfliigers Archiv. fiir die gesamte Physiologie, Bd. 205. 1904. RUPPIN, E. Ueber die Oxydierbarkeit des Meereswasser durch Kaliumpermanganat. Publications de Circonstance, No. 20..
(22) 874. s. M. MARSHALL AND A. P. ORR.. TABLE. 1.. 1927. Depth Temperainm. ture 'C.. Salinity %,. Density.. Oxygen c.c. per I.. 8-3-27. 0 5 10 20 40. 6.79 6,87 H8 7,30 7,38. 31.97 32.11 32.30 34.01 34.43. 1.0251 1-0253 1.0253 1-0262 1.0269. 10-3-27. 0 5 10 20 40. 7.09 7.22 7.21 7-30 7,39. 31.54 33.02 33,39 33.78 34.49. 1-0247 1-0258 1-0262 1.0265 1-0270. 7,60 6.72 6,33 5.97 5,85. 11-3-27. 0 5 10 20 40. HI 7.25 7.21 7.26 7.29. 32.41 33.09 33.39 33,56 34,39. 1.0254 1.0259 1.0262 1.0263 1.0269. 14-3-27. 0 5 10 20 40. 6.27 6.28 7.22 7,35 7,38. 30.21 30.34 33,30 34.21 34,39. 15-3-27. 0 5 10 20 40. 6.12 6.12 6.12 7,30 7,38. 16-327. 0 5 10 20 40. 0, Satnration%.. pH.. P,O, c.m.. mg. per. ])ja torn chains. in 20 c.c.. 8.13 8.12 8.13 8.14 8.13. 45 50 55 59 70. 6,400 5,400 2,280 423 12. 109.6 99.5 98.4 97.4 9H. 8.18 8.16 8.14 8.17 8.13. 38 50 52 59 58. 16,700 6,900 2,800 670 65. 8,35 H6 6.33 6.12 5.92. 120.7 104.2 92.1 89,5 87.2. 8.22 8.14 8.13 8.12 8.13. 22 36 58 69 70. 33,100 16,400 3,200 1,050 .. . ... 1.0238 1-0239 1-0261 1.0268 1-0269. 8,99 8.98 6.35 5,89 6.04. 124.4 125.2 92.3 85.9 88.8. 8.38 8.37 8.12 8.12 8.12. 5 13 39 52 55. 62,700 51,000 4,350 402 141. 30,34 30.58 30.60 33.74 34.47. 1.0239 1.0241 1-0241 1.0264 1-0270. 8,96 8.92 8.88 5.82 5,88. 124.5 123.9 123.3 85.2 86,7. 8.36 8.35 8,35 8.12 8.10. 20 17 22 66 72. 6.24 7.17 H9 7.28 7,37. 30.41 30.55 33.26 33.82 34.41. 1.0239 1-0239 1.0260 1.0265 1.0269. 9.18 8.82 6.23 5,97 5.81. 127.6 125.7 90.6 87.4 85,6. 8.46 8.43 8.21 8.18 8.18. 10 13 47 52 64. 17-3-27. 0 5 10 20 40. 6.18 6.14 H9 7.13 7,38. 30,33 30.31 33.73 33.88 34,46. 1.0239 1.0239 1.0264 1.0266 1-0270. 8,98 8.91 6.25 6.29 5,77. 125.1 123.8 91.2 91.8 85.1. 8.50 8.50 8.22 8.22 8.19. 12 18 55 64 70. 18-3-27. 0 5 10 20 40. 6.49 6.48 HI 7.21 7,35. 30,07 30.16 33.30 33.72 34.48. 1-0236 1-0237 1-0261 1.0264 1-0270. 9.44 7.91 6,37 6.17 5,83. 131.0 110.6 92.5 90.1 86.0. 8.51 8.35 8.19 8.19 8.17. 14 20 48 63 74. 47,500 36,iloo 6,300 600 138. 11,000 39,600 26.400 2,740 212.
(23) 875. SPRING DIATOM INCREASE. TABLE Depth Temperainm. ture 'C. 193-27. 0 6.79 5 6.51 10 6,99 20 7.25 40 7.35. Salinity %,. Density.. I (continued). Oxygen c.c. ° Satnraper l. tion %.. pH.. P,O, mg. per c.m.. 2!H;:J 30.21 33.12 33.72 34.49. 1.023'1 1-0237 1.0260 1.0264 1.0270. g.OO 9,07 6.66 6,00 5,87. 127.0 126.9 96,5 88.1 86.6. 8.49 8.47 8.21 8.17 8.18. 12 14 35 57 62. Diatom chains in 20 c.c. 22-3-27. 0 5 10 20 40. 7.50 7,53 7.00 6.92 7.25. 29.87 30,05 33.26 33.24 33.72. 1.0233 1.0235 1.0261 1.0261 1.0264. 7,75 7.75 6.61 6.91 5.91. 110.7 110.7 95.7 100.2 86.4. 8.48 8.48 8.23 8.24 8.19. 13 14 31 32 68. 23-3-27. 0 5 10 20 40. 7,57 7.47 7.12 7.17 7.33. 28.79 31.92 32.99 33,70 34.41. 1-0225 1-0250 1-0259 1.0264 1-0269. 7.33 7.76 7.51 5,95 5.61. 104.4 112.3 108,9 86,9 82.5. 8.48 8.45 8,34 8.22 8.22. 16 17 24 43 67. 25-3-27. 0 5 10 20 40. 7.20 7.21 7.20 7.03 7.32. 31.24 30.98 31.24 33,37 34.26. 1-0245 1.0243 1-0245 1-0262 1-0268. 7.42 7.42 7.39 6.40 6.15. 106.4 105,9 105,7 92.6 9q'3. 8.43 8.42 8.42 8.26 8.22. 15 19 21 51 69. 2,200 1,700 2,200 2,300 2,200. 26-3-27. 0 5 10 20 40. 7.17 7.20 7-18 7.02 7,30. 29.32 31.97 32.40 33.14 34,10. 1-0230 1.0250 1.0254 1.0260 1-0267. 7.38 7,55 7.51 6.70 5.36. 104.2 108.6 108,3 97.0 78,6. 8.41 8,34 8.34 8.26 8.16. 18 18 23 30 63. 1,090 67 143 688 192. P,O, mg. per c.m.. Diatom cells in 20 C.c.. 1,280 1,700 16,100 12,000 7,400. TABLE 2. 1928. Depth Temperainm. ture 'C. 14-3-28. 0 5,56 2 5,50 5 5.50 10 5.52 20 6.24 19-3-28. 0 2 5 10 20. 5,55 5.51 5,50 5,50 6.17. Salinity ;.;,. Density.. Oxygen C.c. l'er l.. 0, Saturation%.. pH.. 32.66 32.65 32.65 32.65 33.02. 1.0258 1.0258 1-0258 1-0258 1-0260. 6.75 6.75 6,79 6.76 6.31. 94,5 94.1 94.6 94.3 89,5. 8.22 8.22 8.21 8.21 8.21. 33 34 41 35 36. 2,182 2,246 2,191 2,607 579. 32.38 32.38 32.34 32.38 33,30. 1-0255 1.0256 1.0255 1.0256 1-0262. 6.95 6.92 6.90 6.91 ..... 96,9 96'3 96.0 96.2. 8.23 8.22 8.22 8.21 8.21. 32 42 38 39 40. 8,100 7,300 7,300 7,600 1,900. .....
(24) 876. s. M. MARSHALL AND A. P. ORR.. TABLE 2 (continued). Depth Temperain m. ture '0. 22-3-28. 0 5,63 2 5,50 I) 5,58 10 5.67 20 5.94 30 5,99. Salinity %,. Density.. 32.01 32.01 31.87 32.25 :32.89 33,04. 1.0253 1.0253 1.0252 1.0254 1-0259 1-0260. Oxygen c.c. per I. 0, Satnra-. P,O, c.m.. Diatom. mg. per. eel's in. 20 c.c.. tion%.. pH.. 6.91 6.90 6.95 6.87 6.77 6.78. 96.2 95.7 96.5 95.9 95.4 95.9. 8.21 8.19 8.21 8.20 8.19 8.20. 32 34 33 34 37 38. 7,600 8,300 8,800 7,800 6,800 3,400. 26-3-28. 0 2 5 10 20 30. 5.93 5.97 5,85 5.90 6.02 6.19. 31.85 31.75 31.87 32.83 33.15 33.49. 1.0251 1.0250 1-0251 1.0259 1.0261 1.0264. 6.85 6.92 6.93 6.64 6.55 6.37. 95.7 97,0 96.8 93.5 92.8 90.7. 8.22 8.21 8.21 8.20 8.19 8.21. 33 36 37 35 38 40. 9,000 11,300 13,500 2,900 1,800 1,500. 29-3-28. 0 2 5 10 20 30. 5.95 5,95 5.97 5.95 6.02 6.09. 31.52 31.70 31.75 32.21 33.02 33.27. 1.0248 1-0250 1.0250 1.0254 1-0260 1-0262. 6,95 7.01 7.00 6.83 6,57 6.42. 97.2 98.1 98.0 96.0 93.0 91.2. 8.22 8.22 8.20 8.20 8.20 8.20. 30 30 31 33 37 40. 64,000 68,000 57,000 41,000 2,000 1,050. 2-4-28. 0 2 5 10 20 30. 6.62 6'50 6.09 6.08 6.22 6.36. 30,36 30.44 31-62 32.63 33,34 33,68. 1.0239 1-0239 1.0249 1-0257 1.0262 1.0265. 7.43 7,53 7.32 6.65 6.25 6.18. 104.2 105.6 102.7 93,9 89.0 88.4. 8.25 8.24 8.25 8.22 8.20 8.20. 23 24 26 34 41 42. 73,000 61,000 133,000 8,000 1,200 115. 4-4-28. 0 2 5 10 20 30. 6'55 6,48 6'18 6.12 6.12 6.15. 29.54 30,98 31.99 33.02 33.15 33.25. 1.0232 1-0243 1-0252 1.0260 1.0261 1.0262. 8.37 7.79 6,73 6,56 6.53 .6.37. 117-1 109.7 94.8 93.1 92.7 90.6. 8.37 8.31 8.24 8.22 8.21 8.21. 0 22 32 42 42 42. 180,000 248,000 60,000 2,100 1,250 890. 6-4-28. 0 2 5 10 20 30. 6.49 6.96 6,56 6.19 6.11 6.11. 28.56 29.93 30,76 32.24 32.81 33.19. 1.0225 1.0235 1.0242 1.0254 1.0258 1.0261. 9.33 9.77 8.28 6.81 6,55 6.41. 129.2 138.0 116.6 96.1 92.8 91.2. 8.47 8.44 8.32 8.22 8.21 8.20. 5 10 19 30 37 39. 128,000 199,000 510,000 56,000 3,100 1,280. 9-4-28. 0 2 5 10 20 30. 7.00 7,00 6'77 6.73 6.27 6.28. 28.83 28.81 30.21 30.27 32.45 33,54. 1-0226 1.0226 1-0237 ],0238 1.0255 1.0264. 7.77 7.76 7.05 7,04 6.60 6.15. 109.0 108.8 99.5 99.1 93.6 88.0. 8.46 8.44 8.24 8.24 8.22 8.20. 0 0 24 27 34 46. 90,000 106,000 176.000 152,000 77,000 3,500. 12-4-28. 0 2 '5 10 20 30. 7.15 7.14 7'13 6.40 6.17 6,30. 30.32 30.21 30.32 32.31 32.89 33,55. 1.0237 1.0237 1.0238 1-0254 1-0259 1.0264. 7.47 7.47 7.51 6.83 6,43 6,04. 106.3 106.0 106.7 96.8 91.2 86,3. 8.24 8.26 8.25 8.23 8.21 8.21. 17 17 17 32 43 44. 225,000 220,000 169,000 83,000 10,000 2,400.
(25) SPRING DIATOM INCREASE.. 877. TABLE 2 (continued). Oxygen C.c. 0, SaturaDensity. per I. tion;';.. Depth Tempera- Salinity inm. ture "C. ;.;, 16-4-28. 0 7.20 29.88 2 6.70 30,97 5 6,50 31.97 10 6.50 32.30 20 6.36 32.72 30 6.26 33.76. PH.. P,O, c.m.. mg. per. Diatom cells in 20 c.c.. 1.0234 1.0243 1.0251 1.0254 1.0257 1.0266. 7.43 7-06 6.71 6.72 6,57 6.00. 105.4 99.7 95.1 95.6 93.4 85.8. 8,36 8.26 8.22 8.23 8.22 8.21. 17 24 28 28 34 48. 14,20099,000 24,000 13,800 10,900 4,700. 19-4-28. 0 2 5 10 20 30. 6.32 6.32 6.29 6.29 6.40 6,40. 33,03 33,09 33.09 33.27 33,94 34.20. 1.0260 1.0260 1.0260 1-0262 1-0267 1.0269. 6,47 6,45 6.41 6.25 5,90 6.06. 92.1 91.9 91.3 89.0 84.7 87.1. 8.22 8.21 8.21 8.21 8.20 .8.21. 24 25 28 28 33 36. 1,120 2,015 1,400 306 400 1,008. 26-4-28. 0 2 5 10 20 30. 7.52 7-43 7.18 6.67 6,50 6.47. 32.74 32.77 32.77 33.30 33.47 33,65. 1.0256 1-0256 1.0257 1.0261 1.0263 1.0265. 7-19 '7.18 7.22 6.88 6,50 6.47. 104.7 104,4 104.6 98.8 93.1 92.7. 8,33 8.30 8,30 8.25 8.23 8.22. 17 21 22 27 34 35. 101 138 3,072 18,400 17,800 19,600. TABLE 3. MARCH. DATE Compensationpoint of culture in metres. Secchi disc reading in metres.. APRIL. 19. 22. 2629. 8. 14. 17. 7. 7t -. 2. 3. 4. 5. 6. 9. 9. 6. -. 8. -. 5. 6. 6t. tt. 3t 2! 2& 21 3t. 12. 16. 17. 4 18 3. 7. 19. 20. 13 9t 11 1O}. TABLE 4.. Loch Striven. 22-23/3/28. 0.41 hours sunshine. Diatom culture of Feb. 20th-7,400 cells per C.c. 12.20 p.m.-l1.45 a.m. Initial O2content 1. 8'21. 2. 8.18 8.20 3. 8.22}. Depth in metres. 0. t 2 5 10 20 30. Light. 11'26\"11'46 l1'65f 11-64\"11'76 11'88 f 11'34\"11'38 l1'41f 9'51\.. 9,53 9'55f 8.37\.. 8,33 8'29f 8.0l\.. 8.02 8'04f 7'95\.. 8'03f 7,99. Dark. Av. 7.70 7,73. Total O2 produced. 3,74. O2produced by 10. diatoms. 0.51. 7.15. 7,73. 4.03. 0,54. 7.74. 7,73. 3,65. 0.49. 7.71 7,73. 1.80. 0.23. -. 7,73. 0.60. 0.08. 7.79. 7,73. 0.29. 0,04. 7,68. 7,73. I 0.26. 0,04.
(26) 878. S. M. MARSHALL AND A. P. ORR.. TABLE 5, Loch Striven. 6-7/4/28. 4.25 hours sunshine. Diatom culture of March 7th-8,300 cells per C.c. 11.35 a.m.-lL15 Depth in metres. 0. t 2 5 10 20 30. a.m.. Light. 9.H.L 9,08 9'04f 10.21L10.02 9'84f 8,98 L 8,99 9'Olf 7.56 7.56 7-15 7-15 Lost 7-10L 7-12 7-14f. Initial O2content ~:~~} 7.72 Total O2 produced. 2.19. O2produced by 106 diatoms. 0.26. 6.89. 3-13. 0,38. Lost 6.89. 2.10. 0.25. 6.86 6.91 6,94 Lost. 0.67 0.26. 0.08 0.03. 0.23.. 0.03. Dark. Av. 6.86 6.89 6.92. 6.89 6,89 6.89 6.89. TABLE 6.. Date. 4-5-28 7-5-28 9-5-28 11-5-28. Diatom cells per C.c. 575 6,000 15,700 21,300. Oxygen c.c. per litre. 5.89 9,07 15.48 17.13. 0 xygen produced. 0 3-18 9.59 11.24. Oxidisable Organic Matter. Total Production In filtered mg. O2per mg. O2per samples litre. litre. mg. O2per 1. 1.36 0 1.24 2.22 0.86 3.15 1.79 1.22 4-46 3.10.
(27)
Figure
+5

Related documents
Figure 6: With series demand sharing, the modulating boiler's firing rate increases until the load requires an additional boiler. Then the additional boiler starts and becomes
This paper provides outcomes from an evaluation of a federally funded program combining HIV prevention services with an integrated mental health and substance abuse treatment
Both market scenarios (Transatlantic Market and Global Economy), have higher growth rates (respectively 1.9% and 2.4% per year) than both public scenarios (Regional Communities
This study therefore assessed to what extent adolescents’ perceived anti-smoking norms among best friends, teachers, and society at large were associated with
To that end, the Open Travel Alliance (OTA) was formed in 1998 and now has a global membership of over 150 travel companies from suppliers, such as airlines, hotels, car rental, rail,
RESUMO - No presente trabalho, foi desenvolvido um estudo referente à variabilidade, correlação e te- petibilidade dos caracteres de tamanho de inflorescência, número de botões,
knowing what terms are in the top position in Google, and being able to quantify their value through cold, hard data will go a long way in understanding the true value of those
Using the multimammate mouse (Mastomys natalensis ) in Tanzania and the house mouse (Mus domesticus ) in southeastern Australia as primary case studies, we demonstrate how ecology
