KINETIC, THERMODYNAMIC AND EQUILIBRIUM STUDIES
OF RHODAMINE B ADSORPTION BY LOW COST
BIOSORBENT SUGAR CANE BAGASSE
Z. M. Abou-Gamra
[a]* and H. A.A. Medien
[a]Keywords: kinetics, adsorption, Lignin, Rhodamine-B, dye
The present study deals with the feasibility of removal of basic dye Rhodamine-B (RB) from aqueous solutions by using a low cost natural adsorbent lignin. Batch adsorption studies were conducted to evaluate various experimental parameters such as, contact time, initial concentration of the adsorbate, adsorbent dosage, pH and temperature. Pseudo first order and pseudo second order were used to fit the experimental data. Pseudo second order kinetics described of adsorption reasonably well. The experimental isotherms data were also modelled by the Langmuir and Freundlich equation of adsorption. Equilibrium data fitted well with the Freundlich isotherm. Lignin was shown to be a promising material for adsorption of RB from aqueous solutions.
*Corresponding Authors
E-mail: [email protected]
[a] Chemistry Department, Faculty of Science, Ain Shams University, Abbassia, Cairo, Egypt
Introduction
Many industries such as textile, paper, rubber, plastics, paints, printing, and leather discharge coloured effluents which cause pollution in receiving water. Textile industries cause serious problem because they are major consumers of the dyes, most of which are toxic, particularly azo dye. The coloured water depletes sunlight penetration which reduces the photosynthetic activity in aquatic plants impeding their growth. Rhodamine B (RB) is used mostly in paper printing, textile dyeing, and leather industries. It is carcinogenic, and causes irritation of eyes, skin, respiratory tract and the gastrointestinal tract.1
The removal of Rhodamine B from colour effluents is the one major environmental concern these days. Several techniques have been used such, Fenton-like,2-4 photocatalytic5-8 which is convenient techniques are expensive.
Adsorption process has been found to be superior technique for treating dye effluents due to simplicity and insensitivity to toxic substance. Although the activated carbon9-10 is most effective for adsorption of dye, but it has some disadvantages such as (i) high adsorbent cost, (ii) problems of regeneration and difficulties of separation of powdered activated carbon from waste water for regeneration are expensive and hence increasing need for equally effective but commercially low cost sorbents. A wide variety of materials such as animal bone,11 black tea leaves,12 cocoa,13 almond shell,14 mango leaves,15 saw dust.16
The present study is concerned to evaluate the efficiency of adsorbent (lignin) extracted from sugar cane bagasse for removal of Rhodamine B.
Materials and methods
Dye solution
Rhodamine B is cationic basic dye with molecular formula C28H31ClN2O3. It was obtained from BDH was used as received without further purification. A stock solution of RB, 479.02 mg L-1, was prepared in doubled-distilled water. Solutions of desired concentration were obtained by dilution with buffer solutions.
Adsorbent
Sugar cane bagasse was obtained from a sugar cane mill, Egypt. It was wet then air dried. Lignin was extracted from bagasse by soda process as previously described.17
Experimental Methods
The reaction was followed spectrophotometrically at λmax=554 nm using thermostated 292 Cecil spectrophotometer. pH of solution was conducted with a Grifin pH meter fitted with glass calomel electrode.
The surface textures of lignin before and after adsorption were observed by Scanning electron microscope (JEOL, JEM-1200X II).
Results and Discussion
Characterization of adsorbent
SEM micrograph of lignin (Figure 1) shows that the adsorbent surface is irregular, rough and highly porous indicating the possibility of its good adsorption properties.
a)
b)
Figure 1. SEM micrographs of lignin (a) before adsorption, (b) after adsorption at pH = 3.6
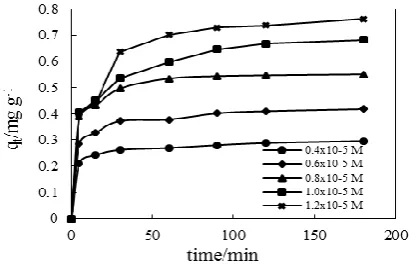
Effect of contact time and Initial concentration of dye
To study the effect of dyes initial concentration and contact time on adsorption uptake, RB solution with initial concentrations 1.9-5.7 mg L-1 was shaken with 0.3 g/50ml of lignin. In this case, the solution pH was 3.6 and temperature was 35 oC. The experimental results of sorption of RB on lignin at various initial concentrations are shown in Figure 2. The adsorption at different dye concentrations was rapid at the initial stages and then gradually decreases with the progress of adsorption until the equilibrium was reached. The rapid adsorption at the initial contact time can be attributed to a large number of surface sites are available for adsorption at the initial stages and after a lapse of time, the remaining surface sites are difficult to occupy because of repulsion between RB molecules of solid and bulk phases.15 Also this may be explained by rapid adsorption on outer surface followed by slower adsorption inside the pores, the same result obtained by Majid et al.14
Figure 2:Effect of contact time on adsorption of Rhodamine B at different dye concentrations, adsorbent dose = 6 g L-1, temp. = 35 oC, pH = 3.6.
As shown in Figure 2, the contact time needed for RB solution to reach equilibrium was 120 min. The results indicated that there was no change in the sorption capacity after 120 min, therefore 180 min was fixed as contact time for isotherm studies. The adsorption capacity increased from 0.3 to 0.8 mgg-1as the dye concentration increased from 1.9-5.7 mg L-1, (Figure 2).
Effect of pH
pH is one of important factors in controlling the adsorption of dye on adsorbent. The adsorption capacity initially increased from 0.8 to 0.92 mgg-1 (69.8 to 77.6%) with increasing pH, with optimal uptake at pH = 3.6-4.4, the RB uptake decreased from 0.92 to 0.125 mgg-1 (77.6 to 10.4%) in the pH range of 4.4 to 8.75, this clear from (Figure 3). This may be explained on the basis of fact that at pH values lower than 4.5, the RB ions can enter into the pore structure. At a pH value higher than 4.5, the zwitterions of RB in water may increase the aggregation of RB to form a bigger molecular form (dimer) and become unable to enter into the pore structure of lignin surface. The greater aggregation of the zwitterions is due to the attractive electrostatic interaction between the carboxyl and Xanthane groups of the monomer. This is confirmed by darkness of the colour of lignin after adsorption by increasing pH till 4.1, then the colour faint by increasing pH, (Figure 3).
Similar trend was observed by other workers for RB dye in the range of pH under investigation.15, 18
Figure 3. Effect of pH on removal of Rhodamine B,[RB] =10-5 mol.L-1, temp. = 28 oC, adsorbent dose = 4 g L-1.
Effect of adsorbent dose
Figure 4. Effect of adsorbent dose on adsorption of Rhodamine B, [RB] =10-5 mol. L-1, T= 35 oC, pH = 3.6.
Adsorption isotherm
In order to describe the adsorbate-adsorbent interaction, the isotherm data were analyzed by fitting them into Langmuir and Freundlich equations to find out the suitable model that may be used for design consideration.
Langmuir isotherm
The Langmuir adsorption mode21 is based on the assumption that maximum adsorption corresponds to saturated monolayer of solute molecules on the adsorbent surface. The linear form of Langmuir equation is
where
b is adsorption equilibrium that is related to energy of adsorption and
Qm is the quantity of adsorbate required to form single monolayer on unit mass of adsorbent (mg g-1) and
qe is the amount of adsorbed on unit mass of the adsorbent (mg g-1) when the equilibrium concentration is Ce (mg L-1).
The linear plot of Ce/qe against Ce (Figure 5) shows the adsorption obeys equation (1). The Langmuir constants
Qm and b were determined from the slope and intercept of the plot, are 1.25 mg g-1 and 48.78 L mg-1 respectively. R2 value (0.927) suggests that the adsorption follows Langmuir model. The higher value of (Qm>1) indicates strong adsorbent- adsorbate interaction.
The essential characters of Langmuir isotherm can be expressed in term of dimensionless constant separation factor RL22 given by
where
Co (mg L-1) is the highest initial concentration of dye and
b (L mg-1) is Langmuir constant.
The value of RL in the present investigation is found to be 0.0043 showing the adsorption is favour adsorption (0RL < 1) at the temperature studied.
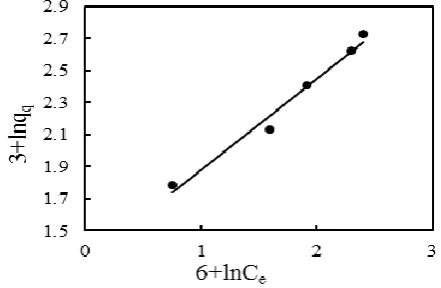
Freundlich isotherm
The Freundlich isotherm considers multilayer adsorption with heterogeneous energetic distribution of active sites accompanied by interaction between adsorbed molecules.23 The linear Freundlich isotherm is
1
lgqe lgKf lgCe (3)
n
where, Kf is Freundlich constant, which indicates the relative adsorption capacity of the adsorbent and n is a measure of the adsorption intensity or surface heterogeneity (a value closer to zero represents a more heterogeneous surface). The linear plot of lgqq against lgCe, (Figure 6) shows that the adsorption of RB on lignin also follows Freundlich isotherm model. Freundlich constant Kf and n were 5.5 and 1.76 respectively. The value of n1 indicates favourable adsorption. Regression correlation coefficient (R2 = 0.978) is better than one obtained from Langmuir isotherm (R2 =0.927) indicates that Freundlich isotherm model more fit.
Adsorption kinetics
Pseudo first order and second order models were applied to test experimental data and explain the kinetic adsorption process. Lagergren proposed a method for adsorption analysis24 in the form
where,
k1 (min-1) is the rate constant,
qe (mg g-1) is the amount of dye adsorbed on surface at equilibrium,
qt (mg g-1) is the amount of dye adsorbed on surface at time t (min).
The adsorption rate constant, k1 and qe were calculated from the plot of log (qe –qt) vs. t, (Figure 7) and are listed in Table 1.
The pseudo second order kinetic model is given by equation 5.25
where, k2 (g mg-1 min-1) is pseudo second order rate constant. The plot of t/qt vs t is shown in Figure 8. The values of qe and k2 are listed in Table 1.
1 1
(1)
Ce
Ce qe Q bm Qm
1
(2)
1 o
RL bC
1
lg( ) lg (4)
2.303
k qeqt qe t
1 1
(5) 2
2
t
t qt k qe qe
Table 1. Kinetic parameters for the adsorption of Rhodamine B on lignin
Table 2. Thermodynamic parameters for the adsorption of Rhodamine B on lignin
Temperature/ K Ke Thermodynamic parameters
G0 (kJ mol-1) H0 (kJ mol-1) S0(J mol-1 K-1)
301 3.47 -3.12
-29.5 -81.34
308 5.88 -4.52
315 3.72 -3.44
323 3.39 -3.27
Lower correlation coefficient of pseudo first order kinetics model and the calculated qe values are found to be lower than the experimental one comparing to pseudo second order kinetics model indicating that the applicability of pseudo second order kinetics model.
Figure 5. Langmuir isotherm plot for adsorption of Rhodamine B on lignin.
The kinetic results were further analyzed by the intraparticle diffusion to explain the diffusion mechanism.26
where C is the intercept and kid is intraparticle diffusion rate constant (mg g-1 min-0.5) are listed in Table 1 which
can be evaluated from the slope of the linear plot of qt vs t0.5 (Figure 9). If the straight line passes through the origin, then intraparticle diffusion is the sole rate-limiting step which is not the case in (Figure 9). It may be concluded that surface adsorption and intraparticle diffusion were concurrently operating during RB interaction. Also increasing the C, value indicating increasing the boundary layer. The same results obtained by Prasad et al.20
Figure 6. Freundlich Isotherm plot for adsorption of Rhodamine B on lignin.
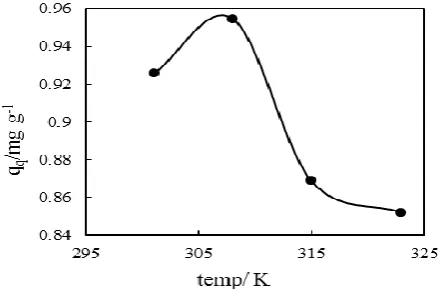
The effect of temperature
The effect of temperature for RB adsorption on lignin was shown in (Figure 10). The results show that there is no consistent trend found for the relationship between temperature and amount of adsorption. Figure 10 shows that the adsorption of RB onto lignin increases with increasing temperature below 308 K, which indicates that
Kinetic model [RB]=0.4x10⁻⁵ M [RB]=0.6x10⁻⁵ M [RB]=0.8x10⁻⁵ M [RB]=10-5 M
Lagergren pseudo first order qe (mg g-1) experimental qe calculated
k1 (min-1)
R2
0.296 0.076 0.018 0.964
0.418 0.127 0.023 0.966
0.550 0.165 0.033 0.977
0.681 0.335 0.026 0.992 Pseudo second order
qe calculated k2 (g mg-1 min-1)
R2
0.299 0.77 0.999
0.425 0.51 0.999
0.561 0.53 0.999
0.708 0.18 0.998 Intraparticle diffusion
kid (mgg-1min-0.5) C
R2
0.007 0.21 0.896
0.011 0.28 0.874
0.015 0.39 0.821
0.026 0.37 0.936
0.5
(6)
the adsorption is endothermic. Above 308 K, the decrease of adsorption capacity with increasing the temperature indicating that the adsorption of RB onto lignin is controlled by exothermic process. A similar temperature effect on the adsorption has been observed by Yati Yang et al27 for the adsorption of methylene blue on anionic starch microsphere and Choiu et al28 for adsorption of reactive dye on crosslinked chitosan beads.
Figure 7. Lagergren pseudo first order plot for adsorption of Rhodamine B on lignin
Figure 8. Pseudo second order plot for adsorption of Rhodamine B on lignin.
Thermodynamic Parameters
Thermodynamic parameters were evaluated to confirm the nature of adsorption of RB onto lignin. Thermodynamic parameters were calculated by the Van’t Hoff equation.
From the slope and intercept of Van’t Hoff plot, the value of H0 andS0 was calculated. The Gibbs free energy change G0 was calculated using the following equation are listed in Table 2.
It is clear from Table 2 that Ke decreases by increasing temperature above 301K.
Figure 9. Intraparticle diffusion plot for adsorption of Rhodamin B on lignin.
This suggests that the adsorption process is exothermic. The negative values of free energy change indicating that the adsorption is spontaneous process. The negative value of enthalpy change suggests that adsorption is exothermic. Generally, the enthalpy change due to chemisorption takes value between 40-120 kJ mol-1, which is larger due to physisorption.29 Consequently, the low value of the enthalpy change indicates that the adsorption is likely due to physisorption. The low value of entropy change indicates the adsorption of RB onto lignin is favour process. The R2 value in the plot of lnK
e vs 1/T was very low (R2 = 0.068) for the experiments including low temperature, 301 K, which altered the trend of the temperature effect. Excluding this temperature, the plot, was closer to straight line with R2 = 0.853. The values of
H0 and S0 were, -29.51 kJ mol-1 and -81.34 J mol-1 K-1 respectively, confirming that the adsorption is exothermic process at temperature above 301 K. A similar temperature effect on the adsorption has been observed by Sudipta Chatterjee.30
Figure 10. Effect of temperature on adsorption of Rhodamine B on lignin
0 0
lnKe S H (7)
R RT
0 100 200 300 400 500 600 700
0 50 100 150 200
0.4x10⁻⁵ M 0.6x10⁻⁵ M 0.8x10⁻⁵ M 1.0x10⁻⁵ M
time/min
t/q
t
0 0,1 0,2 0,3 0,4 0,5 0,6 0,7 0,8
0 3 6 9 12 15
0.4x10⁻⁵ M 0.6x10⁻⁵ M 0.8x10⁻⁵ M 1.0x10⁻⁵ M
t
0.5/ min
0ln (8)
G RT Ke
Conclusion
Kinetics, equilibrium and thermodynamic of adsorption of Rhodamine B onto lignin from aqueous solution are investigated. The adsorption data is fitted Freundlich adsorption model. The kinetic data is agreed with pseudo second-order rate equation. High amount adsorbed at low pH. The adsorption is exothermic process at temperature above 28 oC.
Acknowledgements
The authors are grateful to Dr. Atef S. Darwish (lecturer of physical chemistry, Faculty of Science, Ain-Shams university, Cairo, Egypt ) for preparing the adsorbent.
References
1Rochat, J., Demenge, P., Rerat, J. C., Toxicol. Eur. Res., 1978, 1, 23-26.
2Xue, X., Hanna, K., Denga, K., J. Hazard. Mater., 2009, 166, 407–414.
3Xu, H. Y., Prasad, M., Xuail, H. E., Lian, W. S., Shu, Y. Q.,
Sci. China. Ser E-Tech. Sci., 2009, 52(10), 3054-3060.
4Medien, H. A. A., Khalil, S. M. E., J. King Saud Univ.
(Science), 2010, 22(3), 147–153.
5Gondal, M. A., Chang, X., Ali, M. A., Yamani, Z. H., Zhou, Q. and Ji, Q., Applied Catalysis A, 2011, 397(1-2), 192-200. 6Wilhelm, P., Stephan, D., J. Photochem. Photobiol. A: Chem.,
2007, 185, 19–25.
7Byrappa, K., Subramani, A. K., Ananda, S., Lokanatha Rai, K. M., Dinesh, R. and Yoshimura, M., Bull. Mater. Sci., 2006,
29(5), 433–438.
8 Libanori, R., Giraldi, R. T., Longo, E., Edson, R. L. and Ribeiro, C., J. Sol-Gel. Sci. Technol., 2009, 49, 95–100. 9Lalitha, P., Sangeetha, S. N., Oriental J. Chem., 2008, 24(3),
983-988.
10Vausa, A. E., E-J. Chem., 2008, 5(4), 844-852.
11El Haddad, M., Mamouni, R., Saffaj, N. and Lazar, S., Global
J. Human Soc. Sci. Geography Environ. Geo Sci., 2012,
12(10), 18-29.
12Abul Hossain, M., Atiqur. R. M., Orbital Elec. J. Chem.
Campo Grande, 2012, 4(3), 187-201.
13Theivarasu, C., Mylsamy, S., Int. J. Eng. Sci. Technol., 2010,
2(11), 6284-6292.
14Aliabadi, M., Khazaei, I., Hajiabadi, M. and Shahrzad, F., J.
Bio. & Env. Sci., 2012, 2(9), 39-44.
15 Khan, T. A., Sharma, S. and Ali, I., J. Toxicol. Environ.
Health Sci., 2011, 3(10), 286-297.
16Wttek-Krowiak, A., Mittek, M., Pokomeda, K. and Szafran, R. G., Modelski S., Chem. Process Eng., 2010, 31, 409-420. 17Mousavioun, P., Dohrty, W. O. S., Ind. Crops Prod., 2010,
31(1), 52-58.
18Ramuthai, S., Nandhakumar, V., Thiruchelvi, M., Arivoli, S.and Vijayakumaran, V., E-J. Chem., 2009, 6(S1), 363-373.
19Ahamed, A. J., Balakrishnan, V. and Arivoli, S., Arch. Appl.
Sci. Res., 2011, 3 (3), 154-166.
20Prasad, A. L., Santhi, T., Sustain Environ. Res., 2012. 22(2), 113-122.
21Langmuir, I., J. Am. Chem. Soc., 1918, 40, 1361–1367. 22Hall, K. R., Eagleton, L. C., Acrivos, A.and Vermeulen, T.,
Ind. Eng. Chem. Fundam., 1966, 5, 212–219.
23Freundlich, H., J. Phys. Chem., 1906, 57A, 385–470. 24Lagergren S, Kungliga Svenska Vetenskapsakad., 1898, 24,
1-39.
25YS Ho, Mckay, G., Adsorpt. Sci. Technol., 1998, 16, 243-255. 26Weber, W. J., Morris, J. C., J. Am. Soc. Civil Eng., 1963, 89,
31-60.
27Yang, Y., Wei, X., Sun, P. and Wan, J., Molecules, 2010. 15, 2872-2885.
28Chiou, M. S., Li, H. Y., J. Hazard. Mater., 2002, B93, 233– 248.
29Alkan, M., Demirbas, O., Celikcapa, S. and Dogan, M.,
J. Hazard. Mater., 2004, B116, 135–145.
30Chatterjee S, Woo, S. H., J. Hazard. Mater., 2009, 164, 1012– 1018.
![Figure 4. Effect of adsorbent dose on adsorption of Rhodamine B, [RB] =10-5 mol. L-1, T= 35 oC, pH = 3.6](https://thumb-us.123doks.com/thumbv2/123dok_us/7836256.2090161/3.595.57.284.66.215/figure-effect-adsorbent-dose-adsorption-rhodamine-rb-mol.webp)