© 2020 by the Serbian Biological Society How to cite this article: Veličković I, Žižak Ž, Rajčević N, Ivanov M, Soković M, 105 Marin P, Grujić S. Examination of the polyphenol content and bioactivities of
Prunus spinosa L. fruit extracts. Arch Biol Sci. 2020;72(1):105-15.
Examination of the polyphenol content and bioactivities of
Prunus spinosa
L. fruit extracts
Ivona Veličković1,*, Željko Žižak2, Nemanja Rajčević1, Marija Ivanov3, Marina Soković3, Petar Marin1 and Slavica Grujić1
1University of Belgrade - Faculty of Biology, Institute of Botany and Botanical Garden “Jevremovac“, Studentski trg 16,
11000 Belgrade, Serbia
2Institute of Oncology and Radiology of Serbia, Pasterova 14, 11000 Belgrade, Serbia
3Department for Plant Physiology, Institute for Biological Research “Siniša Stanković“ – National Institute of the Republic of
Serbia, University of Belgrade, Bulevar despota Stefana 142, 11060 Belgrade, Serbia
*Corresponding author: [email protected]
Received: December 17, 2019; Revised: February 7, 2020; Accepted: February 8, 2020; Published online: February 10, 2020
Abstract: We investigated the total phenolic and flavonoid contents and the anthocyanin profiles in aqueous, ethanol and acetone extracts of Prunus spinosa (Rosaceae) fruit, and their antioxidant, antibacterial, antifungal, antidiabetic and antitumor properties. The contribution of polyphenol contents to the bioactivity of the extracts was calculated and observed through Pearson’s coefficient of correlation. The acetone extract was the richest in phenols and anthocyanins and the ethanol extract in flavonoids. Cyanidin was the most abundant anthocyanin compound in all examined extracts. The ethanol extract showed the most promising antioxidant activity in DPPH, ABTS and FRAP assays. Tested bacteria were more affected by the etha-nol than by the aqueous extract. Both the ethaetha-nol and aqueous extracts exhibited potential antidiabetic effects, observed as inhibition of α-amylase and α-glucosidase, enzymes linked with diabetes mellitus type II. The ethanol extract was a potent α-glucosidase-inhibitor with a significantly lower IC50 value than the positive control, glucobay, used to treat diabetes mel-litus type II. Neither the ethanol nor the aqueous extracts had any effects on tested human malignant cell lines. Our results indicate that the ethanol extract showed the most pronounced in vitro antioxidant and antimicrobial effects, and a potential antidiabetic activity, which can be ascribed to its high flavonoid content. Our results indicate that research of compounds, particularly of flavonoids present in the ethanol extract and their anti-diabetic properties should be examined further.
Keywords: P. spinosa (blackthorn); antioxidant activity; antimicrobial activity; antidiabetic activity; α-glucosidase inhibi-tory activity
INTRODUCTION
The genus Prunus L. (Rosaceae) includes about 200 species that are widespread in the temperate climate of the northern hemisphere, particularly in East Asia [1]. Prunus spinosa L., also known as blackthorn or sloe, is a deciduous, dense shrub up to 4 m in height, which grows wild on uncultivated areas, beside roads and canals. P. spinosa stems are usually covered by thorns. Fruits are spherical bluish-black with a single stone and a sour and pungent taste [2,3]. Prunus spp. contain many economically important species whose fruits are freshly consumed, frozen and processed [4,5]. Most of them possess laxative, diuretic, diapho-retic, astringent [6-11], spasmolytic [12] and analgesic
properties [8,10-11,13], and are used in folk medi-cine for the treatment of common colds and cough [14], diabetes, obesity, kidney stones [13], nephritis, respiratory [15,16] and cardiovascular disorders [15]. Prunus species, like other plants with intensely- and dark-colored fruits, are considered to be a treasury of health-promoting polyphenols, particularly anthocya-nins [17], phenolic acids [18-20], flavonols, coumarins [19,20] and proanthocyanidins [21].
[21]. Previously, authors have reported the presence of protocatechuic, gallic [20], ferulic, chlorogenic [22], neochlorogenic and caffeic acid [11,20-22] in P. spinosa extracts. Flavonoids, particularly anthocyanins, are an-other large group of secondary metabolites identified in P. spinosa extracts [11,22,23]. Beside their importance for plants, anthocyanins also have significant benefi-cial effects on human health, since high anthocyanin intakes are associated with decreased risk of various human diseases [24,25]. Proanthocyanidins, which are recognized health-promoting substances due to their antimicrobial, antioxidative, antiinflammatory, antial-lergic, vasodilatory and enzyme-inhibitory effects, are also found in blackthorns [20,26]. It is worth mention-ing that B-type proanthocyanidins are more widespread in nature, while the A-type is distributed only in Erica-ceae, HippocastanaErica-ceae, Lauraceae and some member of Rosaceae, including Prunus species [20].
In spite of their wide usage as food and in folk remedies, blackthorn fruits are still insufficiently ex-plored. Therefore, this study aimed to evaluate the total phenol and flavonoid contents in P. spinosa aque-ous, ethanol and acetone fruit extracts. To examine the anthocyanin profile, HPLC analysis was performed and in vitro antioxidant, antimicrobial, antidiabetic and antitumor activities were examined. The correla-tion between the polyphenol contents and biological properties was considered. To the best of our knowl-edge, this is the first report of the potential antidia-betic activity of P. spinosa fruit extracts.
MATERIALS AND METHODS Plant material
P. spinosa fruits were collected from a natural popula-tion in July 2015 in Croatia (village Brdine; N 44.5936; E 15.6467) and a voucher specimen was deposited in the Herbarium of the Institute of Botany and the Botan-ical Garden “Jevremovac” (Voucher No. 17482). Frozen fruits were macerated and extracted with distilled water, 96% ethanol and acetone for 24 h. In order to improve extraction, an ultrasound water bath was used during the first and the last hour. Extracts were then filtered through Whatman filter paper No 1 and evaporated in a rotatory vacuum evaporator (Buchi rotavapor R-114) until dry. Crude extracts were stored at +4°C.
Chemicals and reagents
All chemicals and reagents were at least of analyti-cal grade of purity. The organic solvents used for extraction and experimental procedures (methanol, ethanol and acetone), as well as, sodium hydrogen phosphate dihydrate (NaH2PO4x2H2O), disodium hy-drogen phosphate dodecahydrate (Na2HPO4x12H2O), sodium-carbonate anhydrous (Na2CO3) and potas-sium acetate (C2H3KO2) were purchased from VWR Chemicals (Lutherworth, Leicestershire, UK). 2,2-di-phenyl-1-picrylhydrazyl (DPPH), the Folin-Ciocalteu phenol reagent, gallic and L-ascorbic acid, 2(3)-t-bu-tyl-4-hydroxyanisole (BHA), iron (III) chloride hexa-hydrate (FeCl3×6H2O), iron (II) sulfate heptahydrate (FeSO4 × 7H2O), potassium hexacyanoferrate (III) [K3Fe(CN)6], α-glucosidase type I from baker’s yeast, α-amylase from porcine pancreas, 4-nitrophenyl-α-D-glucopyranoside, Lugol’s solution, [p-iodonitrotet-razolium violet [2-(4-iodophenyl)-3-(4-nitrophenyl)-5-phenyltetrazolium chloride (INT), ampicillin were obtained from Sigma-Aldrich, USA. Sodium acetate trihydrate (CH3COONa x 3H2O) and potassium chloride (KCl) were obtained from Centrohem (Stara Pazova, Serbia) and aluminum nitrate nonahydrate [Al(NO3)3×9H2O] and 2,4,6-Tris(2-pyridyl)-s-triazine (TPTZ) from Fluka Chemie AG (Buchs, Switzerland); [2,2’-azino-bis(3-ethylbenzothiazoline)-6-sulfonic] acid (ABTS) and quercetin hydrate were purchased from TCI Europe N.V. (Zwijndrecht, Belgium), sodium-chloride anhydrous (NaCl) from Superlab (Belgrade, Serbia) and 1% starch solution from Carl Roth Gmbh & Co. KG (Karlsruhe, Germany). Potas-sium peroxydisulfate (K2O8S2) and trichloroacetic acid (CCl3COOH) were obtained from Thermo Fisher Sci-entific (New Jersey, US); glacial acetic (CH3COOH), concentrated hydrochloric acid (HCl) and ketocon-azole were from Zorka Pharma (Šabac, Serbia). The 96-well micro titer plates were obtained from Alfamed d.o.o. (Belgrade, Serbia). Tryptic soy broth (TSB) and malt extract broth (MEB) was purchased from Torlak (Belgrade, Serbia). Glucobay was obtained from Bayer d.o.o. (Leverkusen, Germany).
Evaluation of the total phenol content (TPC)
to 0.2 mL of aliquots of the sample and incubated for 6 min. The mixture was supplemented with 0.8 mL of 7.5% sodium carbonate (Na2CO3). After 2 h of incuba-tion, the absorbance was measured at 740 nm against the blank (distilled water instead of sample). Results were calculated from the gallic acid (GA) calibration curve (y=7.0632x–0.0159) and expressed as mg of gal-lic acid equivalents (GAE) per g of dry weight (DW). Evaluation of total flavonoid content (TFC)
The TFC was estimated according to the previously re-ported method [28]. A mixture of 4.1 mL 80% ethanol (C2H5OH), 0.1 mL Al(NO3)3 and 0.1 mL 1M potassium acetate (CH3COOK) was added to 1 mL aliquots of sample or ethanol (blank). The absorbance was read after 40 min at 415 nm. The results were obtained from the quercetin (QE) calibration curve and expressed as mg quercetin equivalents (QE) per g of DW.
HPLC analysis of anthocyanins
Before injection into HPLC, samples were prepared by dissolving dry extracts in 2N HCl solution in metha-nol to obtain 5 mg/mL and incubated in a water bath at 90ºC for 1 h. Samples were then centrifuged for 15 min at 6100 x g and the supernatant was evaporated until dry in a rotatory vacuum evaporator (100 mbar, 40ºC). Samples were dissolved in methanol, filtered through NY filter 0.4 µm and injected into HPLC. The HPLC analyses of anthocyanins were performed using the Thermo HPLC UltiMate 3000 and UV-DAD (UV-Diode Array Detector). The column was an AcclaimTM PolarAdvantage II C18 (L=150mm, r=4.6mm, 3µm). The column was kept at 30°C. An-thocyanins were detected using DAD (200-600 nm). For each sample, 15-30 µL of extracts at concentra-tion of 10-100 mg/mL was injected in triplicate. The mobile phase was a gradient of three solvents: ddH2O (A), methanol (B) and 1% formic acid in acetonitrile (C), with a constant flow rate of 1mL/min using the following program: isocratic 0-5 min (A:B:C=90:0:10), gradient 5-20 min (final ratio A:B:C:=0:90:10), iso-cratic 20-25 min (A:B:C=0:90:10), followed by a sharp return to the initial conditions and an isocratic 10 min washout (A:B:C=90:0:10). Six-point calibration curves were made using anthocyanin standards (delphinidin, cyanidin, malvidin, pelargonidin). Peak detection at
525 nm was used for construction of the calibration curve and quantification of anthocyanins in the sam-ples. Anthocyanin compounds in samples were iden-tified by comparing the retention time of unknown peaks with the reference standards. The total amount of anthocyanins in each sample was calculated.
In vitro evaluation of the antioxidant activity
DPPH assay
Free radical scavenging activity was evaluated using the 2,2-diphenyl-1-picrylhydrazil (DPPH) method [29] with minor modifications. Briefly, 0.4 mL with different concentrations of the sample (10 to 100 µg/ mL) was added to 3.6 mL of a stable DPPH methanol solution and incubated for 30 min in the dark at room temperature. The blank contained methanol instead of the sample. The efficacy of the sample to scavenge DPPH free radicals was calculated from the following equation (Eq. 1):
Percentage of inhibition (%)
(Eq. 1)
where Ac and As are the absorbance of the blank and sample solution, respectively. The results were ex-pressed as EC50 values (µg/mL) and compared with known antioxidant compounds, 2(3)-t-butyl-4-hy-droxyanisole (BHA) and L-ascorbic acid.
ABTS assay
of free radicals for 50%. BHA and L-ascorbic acid were used as standards.
Ferric reducing antioxidant power (FRAP) assay
The FRAP assay of extracts was tested as described [31]. The method is based on the ability of antioxi-dants to reduce iron in complex with 2,4,6-tripyridyl-s-triazine (TPTZ) from the ferric (Fe+3) to the ferrous (Fe+2) form, which leads to the development of an in-tense blue color and can be observed spectrophoto-metrically at 595 nm. Samples dissolved in distilled water were mixed with freshly prepared FRAP reagent (0.3 M acetate buffer solution: 10 mM TPTZ solution in 40 mM HCl : 20 mM FeCl3 = 10:1:1 (v/v/v)) in a final volume of 3 mL and incubated for 10 min at 37ºC. The results were read from the calibration curve constructed using aqueous series dilutions of iron (II) sulfate heptahydrate (FeSO4×7H2O) and expressed as μmol Fe+2 equivalents per mg of DW. BHA and L-ascorbic acid were used as a positive control.
Total reducing capacity (TRC) assay
The TRC of extracts was estimated according to the reported method [32]. Briefly, different concentrations of aqueous sample solutions (0.2 mL) were mixed with 0.5 mL of 0.2 M phosphate buffer (pH=6.6) and 0.5 mL 1% hexacyanoferrate (III) ([K3Fe(CN)6]). After 20 min incubation at 50ºC, the mixture was supple-mented with 0.5 mL of 10% trichloroacetic acid (CCl3COOH) and vigorously shaken. The mixture was diluted with 1.7 mL of distilled water and filled with 0.1% iron (III) chloride (FeCl3). Absorbance was read at 700 nm after 30 min incubation at room tempera-ture against the blank which consisted of all reagents except the sample. The results were presented as EC50 values calculated from the graph of the absorbance at 700 nm against extract concentration and compared with BHA and L-ascorbic acid.
Evaluation of antibacterial activity
The antibacterial properties of the extracts were evalu-ated by a modified microdilution method [33, 34]. The following Gram-positive bacteria were used: Bacillus cereus (clinical isolate), Micrococcus flavus ATCC 10240, Staphylococcus aureus ATCC 6538 and
Listeria monocytogenes NCTC 7973; and the following Gram-negative bacteria: Enterobacter cloacae ATCC 35030, Pseudomonas aeruginosa ATCC 27853, Sal-monella typhimurium ATCC 13311 and Escherichia coli ATCC 35210.
The aqueous and ethanol P. spinosa fruit extracts were dissolved in 30% ethanol and mixed in a final volume of 100 µL with TSB in 96-well microtiter plates with a flat bottom. Ten µL of the bacterial inoculum, previously adjusted with sterile saline to a concentra-tion of 1×10⁵ CFU/mL, were added to obtain the ap-propriate concentration of the mixture. After a 24-h incubation at 37ºC, the lowest concentration causing visible inhibition of bacterial growth (under a binocu-lar microscope) was defined as the minimal inhibi-tory concentration (MIC). The bacterial strains were stained by the addition of aliquots (40 µL) of 2 mg/mL p-iodonitrotetrazolium violet [2-(4-iodophenyl)-3-(4-nitrophenyl)-5-phenyltetrazolium chloride] (INT) stain and 30 min incubation. Minimal bactericidal concentrations (MBCs) were determined by serial re-inoculation with 10 µL of the inoculum in 100 µL of liquid TSB in microplates and incubation for another 24 h. The lowest concentration without visible bacte-rial growth was defined as the MBC, indicating 99.5% killing of the original inoculum. Thirty % ethanol was used as a negative control, and ampicillin was used as a positive control.
Evaluation of antifungal activity
low-est concentration without visible fungal growth under a binocular microscope. MBCs were determined by serial re-inoculation of 2 µL inoculums in 100 µL of sterile broth and incubation for 72 h at 28ºC, and de-fined as the lowest concentrations without visible fun-gal growth indicating 99.5% killing of the original in-oculums. The negative control was 30% ethanol, while the positive control was the commercially available medicine, ketoconazole, an antifungal medication.
α-amylase inhibitory activity
The α-amylase inhibitory activity was tested by the Caraway-Somogyi iodine/potassium method as pre-viously described [36] with slight modifications. Dif-ferent concentrations of sample solution (25 µL) were pre-incubated with 0.5 mg/mL α-amylase solution in phosphate buffer (pH 6.8 with 6mM sodium chlo-ride (NaCl)) (50 µL) for 15 min at 37ºC in a 96-well microplate. The reaction was initiated with the addi-tion of 0.2% starch soluaddi-tion in phosphate buffer (pH 6.8 with 6mM sodium chloride (NaCl)) (50 µL) and incubation for 20 min at 37ºC. Aliquots (25 µL) of 1 M hydrochloric acid (HCl) were used to stop the reac-tion. Subsequently, iodine-potassium iodide solution (IKI reagent) was added (100 µL) and the absorbance was read at 630 nm. The percentage of the inhibited enzyme was obtained using the following equation (Eq. 2):
Percentage of inhibition (%)
ΔAC – ΔAS
ΔAC × 100%
[
[
(Eq. 2)where ΔAC represents the difference between the con-trol solution (containing all reaction reagents except extract) without and with enzyme solution. Similarly, ΔAS is the difference between the sample solutions without and with α-amylase. The obtained results were expressed as IC50 (mg/mL) values and compared to glucobay, an antidiabetic drug used to treat diabetes mellitus type II.
α-glucosidase inhibitory activity
The α-glucosidase inhibitory activity was estimated as described [37]. Different concentrations of the sample in final volume of 120 µL were pre-incubated with 20
µL of 0.6U/mL α-glucosidase solution in 0.1 M phos-phate buffer (pH 6.8) in 96-well microtiter plates for 15 min at 37ºC. Twenty µL of 3.5 mM p-nitrophenyl-α-D-glucopyranoside (PNPG) solution in 0.1 M phos-phate buffer (pH 6.8) were added to start the reaction. After 20 min of incubation at 37ºC, the reaction was stopped by the addition of 0.2 M sodium carbonate (Na2CO3) and the absorbance was measured at 405 nm. The percentages of the inhibited enzyme were calculated by the following formula (Eq. 3):
Percentage inhibition (%)
ΔAC – ΔAS
ΔAC × 100%
[
[
(Eq. 3)Where ΔAC and ΔAS are the absorbance for the control (containing all reaction reagents except extract) and sample, respectively, subtracted by the control/sample solution without enzyme. The results were presented as IC50 values. Glucobay served as the positive control. Statistical analysis
All experimental measurements were carried out in triplicate and the results are presented as their average value (AV) ± standard deviation (SD). Correlations between specific groups of secondary metabolites and antioxidant activities were expressed through Pear-son’s’ coefficient of correlation and interpreted accord-ing to Taylor [40]. All calculations were performed using MS Office Excel 2007.
RESULTS
Yields, total phenol and flavonoid contents
HPLC analysis of anthocyanins
The results of HPLC analysis of anthocyanins are presented in Table 1. The sum of the anthocyanins ranged from 9 to 23 µg/g of DW, the highest being in the acetone sample. Four anthocyanin compounds were identified in the ethanol and acetone extracts, delphinidin (Dp), cyanidin (Cy), malvidin (Mv), pel-argonidin (Pg), while in the aqueous extract Pg was absent. Samples were the most rich in Cy among the present anthocyanin compounds.
Antioxidant activity of P. spinosa
fruit extracts
P. spinosa fruit extracts were evaluated in 4 in vitro antioxidant tests and the results are presented in Table 2. The ethanol ex-tract was the most effective in scaveng-ing DPPH, as well as ABTS free radicals, with EC50 values of 257.84 and 184.43 µg/mL, respectively. In both tests, the acetone extract showed the lowest free radical scavenging activity. Similarly, the ethanol extract possessed the best ferric reducing ability, with 0.10 µmol Fe+2 equivalents/g DW in contrast to the aqueous sample. The aqueous sample exhibited the highest antioxidant ability in the TRC assay (EC50=3848.00 µg/mL) while acetone had the lowest antioxidant potential. However, the extracts were a few times less active than antioxidant compounds, BHA and L-ascorbic acid in all used tests.
Correlations between phenols, flavo-noids and anthocyanins were expressed through Pearson’s coefficient of tion (Table 3). A strong negative correla-tion between phenols and flavonoids was observed, as well as between flavonoids and anthocyanins, which was unusual. A high correlation was established be-tween the phenol content and the val-ues obtained for DPPH, ABTS and TRC tests. In contrast to phenols, flavonoids strongly negatively correlated with the antioxidant activity evaluated by the same assays. Moreover, the correlation of anthocyanin compounds to DPPH and ABTS was similar to that of phenol and to TRC as flavonoid compounds. A moderate negative/positive correla-tion was observed in the FRAP assay and phenols/ flavonoids, respectively. Anthocyanins weakly con-tributed to the antioxidant activity measured by the FRAP assay. High values of Pearson’s coefficient of correlation were obtained for the relation of DPPH with ABTS and TRC, as well as for the relation of ABTS and TRC. The lowest correlation was found
Table 1. Yields, total phenol (TPC), flavonoid (TFC), delphinidin (Dp), cyanidin (Cy), malvidin (Mv) and pelargonidin (Pg) contents and the sum of anthocyanins (TAC) in P. spinosa fruit extracts.
Yield1 TPC2 TFC3 Dp4 Cy4 Mv4 Pg4 TAC5 Sample
water 18.45 23.19±2.52 2.96±0.22 3.00 9.00 2.00 0 14.00
ethanol 11.09 19.98±1.28 3.07±0.27 1.00 6.00 1.00 1.00 9.00
acetone 9.4 26.78±4.44 2.89±0.36 4.00 17.00 1.00 1.00 23.00
1 (%)
2 mg GAE/g of dry extract 3 mg QE/g of dry extract 4,5 µg/g of dry extract
Table 2. Antioxidant activities of P. spinosa fruit extracts estimated by four in vitro colorimetric methods.
DPPH1 ABTS1 FRAP2 TRC3 Sample
water 490.16±10.72 216.66±9.48 0.01±0.00 3848.00±102.06
ethanol 257.84±6.57 184.43±3.88 0.10±0.01 4071.50±82.73
acetone 606.09±29.10 348.16±8.04 0.06±0.00 8348.00±19.80
BHA 5.43±0.02 NM 1.83±0.41 10.97±0.29
L-ascorbic acid 3.74±0.12 2.33±0.12 6.30±0.22 8.72±0.83
1 DPPH and ABTS free radical scavenging antioxidant activities expressed in EC 50 values
(µg/mL);
2 Ferric reducing antioxidant power, expressed in µmol Fe+2 equivalents per g of the dry
extract;
3 Total reducing antioxidant capacity, expressed in EC
50 values (µg/mL);
NM- not measured.
Table 3. Correlations between TPC, TFC and antioxidant properties of P. spinosa fruit extracts expressed through Pearson’s coefficient of correlation (r).
r TPC TFC TAC DPPH ABTS FRAP TRC
TPC 1
TFC -0.9873 1
TAC 0.9914 -0.9579 1
DPPH 0.9752 -0.9980 0.9380 1
ABTS 0.9540 -0.8941 0.9850 0.8642 1
FRAP -0.4144 0.5540 -0.2917 0.6053 0.1225 1
TRC 0.8601 -0.7678 -0.9194 0.7260 0.9734 0.1077 1
among FRAP and ABTS/TRC assays with the r values of 0.1225 and 0.1077, respectively.
Antimicrobial activity of P. spinosa fruit extracts
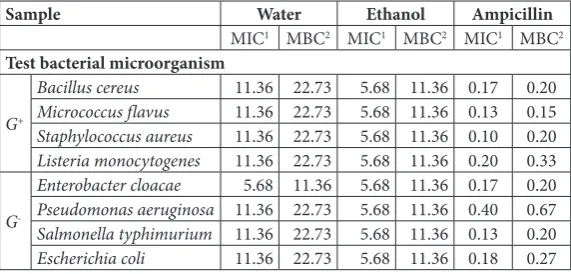
Antibacterial and antifungal activities of the aqueous and ethanol P. spinosa fruit extracts are presented in Tables 4 and 5, respectively. MIC values for antibac-terial activity ranged from 5.68 to 11.36 mg/mL and MBC from 11.36 to 22.73 mg/mL. The ethanol ex-tract was more effective against the examined bacteria. E. cloacae was the most affected by both samples. An-tifungal activity was evaluated against 8 fungal strains and MIC values ranged from 2.87 to 22.94 mg/mL and MFC from 5.73 to 45.87 mg/mL. According to the obtained results, the aqueous extract possessed slightly better antifungal properties. The most
suscep-tible strain to both extracts was T. viride (MIC 2.87 mg/mL; MBC 5.73 mg/mL), while A. ochraceus was the most resis-tant to the ethanolic extract. Antibacte-rial as well as antifungal properties of the examined samples were lower than the commercially used antibiotic and anti-mycotic (ampicillin and ketoconazole, respectively), which served as positive controls.
The enzyme-inhibitory activity of P.
spinosa fruit extracts
Potential antidiabetic activities of the aqueous and ethanol extracts of P. spi-nosa fruits were measured through their ability to inhibit carbohydrate hydrolyz-ing enzymes, and the results are shown in Table 6. Both samples were more po-tent inhibitors of α-glucosidase than of α-amylase. IC50 values for α-AIAwere 389.83 and 13.44 mg/mL for the aque-ous and ethanol extracts, respectively, while for α-GIA they were 0.22 and 0.08 mg/mL, respectively. Glucobay contains acarbose as an active compound, which has the ability to inhibit α-glucosidase and α-amylase and was therefore used as a positive control. From the presented results it can be seen that the ethanol extract displayed significantly stronger inhibition of α-glucosidase than glucobay.
Table 6. In vitro evaluation of enzyme inhibition by P. spinosa fruit extracts.
Enzyme inhibitory activity α-AIA1 α-GIA2 Sample
Water 389.83±56.45 0.22±0.01
Ethanol 13.44±0.50 0.08±0.00
Glucobay 0.20±0.01 0.23±0.03
1α-amylase inhibitory activity in mg/mL; 2α-glucosidase inhibitory activity in mg/mL
Antitumor activity of P. spinosa fruit extracts
Potential antitumor properties of P. spinosa aqueous and the ethanol fruit extract on human carcinoma cell
Table 4. Antibacterial activity of P. spinosa fruit extracts determined by the mi-crodilution method.
Sample Water Ethanol Ampicillin
MIC1 MBC2 MIC1 MBC2 MIC1 MBC2
Test bacterial microorganism
G+
Bacillus cereus 11.36 22.73 5.68 11.36 0.17 0.20 Micrococcus flavus 11.36 22.73 5.68 11.36 0.13 0.15 Staphylococcus aureus 11.36 22.73 5.68 11.36 0.10 0.20 Listeria monocytogenes 11.36 22.73 5.68 11.36 0.20 0.33
G
-Enterobacter cloacae 5.68 11.36 5.68 11.36 0.17 0.20 Pseudomonas aeruginosa 11.36 22.73 5.68 11.36 0.40 0.67 Salmonella typhimurium 11.36 22.73 5.68 11.36 0.13 0.20 Escherichia coli 11.36 22.73 5.68 11.36 0.18 0.27 1,2 Minimal inhibitory (MICs) and bactericidal (MBCs) concentrations in mg/mL;
Table 5. Antifungal activity of P. spinosa fruit extracts determined by the micro-dilution method.
Sample Water Ethanol Ketoconazole
MIC1 MFC2 MIC1 MFC2 MIC1 MFC2 Test fungal microorganism
Aspergillus fumigates 11.57 23.15 11.57 23.15 0.23 0.67 Aspergillus versicolor 11.06 22.12 11.06 22.12 0.20 0.47 Aspergillus ochraceus 5.73 11.47 22.94 45.87 0.20 0.27
Aspergillus niger 11.26 22.52 11.26 22.52 0.27 0.42
Trichoderma viride 2.87 5.73 5.74 11.47 0.83 2.00
Penicillium funiculosum 5.68 11.36 5.68 11.36 0.23 0.67 Penicillium ochrochloron 5.48 10.96 5.48 10.96 1.33 1.67 Penicillium verrucosum var.
cyclopium 11.16 22.32 11.16 22.32 0.27 0.40
lines (HeLa, K562 and MDA-MB-453) were evaluated by the MTT assay and the results are presented as Supplementary Material. The obtained results with IC50 values higher than 2000 µg/mL indicate that nei-ther aqueous nor ethanol extracts exhibited antitumor activities on the tested malignant cell lines.
DISCUSSION
Solvent polarity, besides temperature, pressure, soni-cation time etc., has an influence on the group of com-pounds that are extracted [41]. Thus, in this study, water, ethanol and acetone were used because of their ability to extract different secondary metabolites that could have a role in bioactive responses. Not only is the bioactivity of secondary metabolites important, but also the amounts that are extracted by a specific solvent. Therefore, extraction yields were calculated. Stanković et al. [42] previously examined the extrac-tion yields of P. spinosa fruit methanol, 70% ethanol, 45% propylene glycol and water extracts and the ob-tained results ranged from 19.51 to 31.82% of fresh plant material. The yields reported in this survey were higher, which could be ascribed to differences in the solvent polarity used for the extraction. The value ob-tained for the yield of the aqueous sample (19.51%) was close to those presented in this research (18.45%).
The total phenol and flavonoid contents of P. spi-nosa fruit extract was previously reported by several authors [11,20,42-45]. Barros et al. [43] examined the phytochemicals in strawberry-tree, blackthorn and dog-rose fruits. Among the examined species, P. spinosa fruits possessed the lowest amounts of phenols (83.40 mg GAE/g DW) and flavonoids (8.68 mg CE/g DW), but about 4-fold higher than our samples. Significantly higher values for TPC and TFC in water and ethanol blackthorn fruit extracts were reported by Pinacho et al. [20], which could be explained by differences between the procedures used for extraction. Additionally, the authors used air-dried fruits for extract preparation. However, other authors reported similar amounts of phenols [44,45]. Furthermore, the total flavonoid con-tent in P. spinosa from Serbia previously reported by Stanković et al. [42] was close to the values presented herein. HPLC-DAD analysis of anthocyanins and com-parison of obtained peaks with reference compounds enabled the identification of four basic anthocyanins:
delphinidin, cyanidin, malvidin and pelargonidin in ethanol and acetone extracts, while in the water ex-tract pelargonidin was absent. The sum of anthocyanins was highest in the acetone extract. To the best of our knowledge, this is the first report of anthocyanins in blackthorn fruit acetone extract. Fraternale et al. [46] previously identified 3-O-glucoside, cyanidin-3-O-rutinoside chloride and peonidin-cyanidin-3-O-rutinoside chloride in blackthorn fruits from Italy. A similar an-thocyanin profile was determined by Veličković et al. [11]. Popović et al. [45] indicated differences in poly-phenols among fifteen wild blackthorn genotypes and aside from the previously mentioned anthocyanins they found hydroxycinnamic acids (3-caffeoyl-quinic acid, 3-p-coumaroyl-quinic acid, 5-caffeoylqunic acid), flavonoids (quercetin-3-galactoside, quercetin-3-gluco-side, quercetin-3-rutinoquercetin-3-gluco-side, quercetin) and anthocy-anin, peonidin-3-rutinoside.
The examined samples of P. spinosa possessed antioxidant activity, which is in accordance with lit-erature data [11,20,42-45]. The results presented in this study indicate that among the examined samples, the ethanol extract exhibited the most promising an-tioxidant properties in three out of the four assays used. The ethanol extract was also the richest in flavo-noids, which strongly correlated with the antioxidant properties. Thus, the highest antioxidant activity of the ethanol extract could be ascribed to this group of secondary metabolites. The contribution of flavonoid compounds to antioxidant properties was proven be-fore [11,20,44,47]. Furthermore, anthocyanins strong-ly correlated with the antioxidant ability estimated by the TRC assay, which is in compliance with previously reported results [11]. Therefore, it could be assumed that anthocyanins had a great contribution to the an-tioxidant properties of P. spinosa fruits as well.
was active against L. plantarum 6376, S. aureus 10788 and Citrobacter freundii 9750, while the dichlorometh-ane extract showed weak activity against all tested strains. Radovanović et al. [49] examined the anti-bacterial effects of wild blackberry, European cornel and blackthorn fruit extracts. Their results showed a higher antibacterial activity of the blackthorn extract than of the other two. Among the examined strains, the most sensitive Gram- bacteria was S. enteridis and the Gram+ bacteria S. aureus. They also noted that MIC values were equal to MBC for some strains, which means that the critical concentration of com-pounds possessed bactericidal effects. The P. spinosa ethanol fruit extract was also tested against S. abony NCTC6017, E. coli ATCC 25922, P. aeruginosa ATCC 9027 and B. subtilis ATCC 6633 [11]. With the excep-tion of B. subtilis, all examined bacteria were sensitive to the blackthorn fruit extract, which was linked with the identified flavonoid compounds in the extract. Available literature data about antifungal properties of blackthorn extracts are deficient and contradic-tory. The influence of P. spinosa fruit extract on C. albicans ATCC 10231 was noted by Veličković et al. [11], while Gegiu et al. [50] reported a lack of activity. Furthermore, the mold A. niger ATCC16404 was also resistant to blackthorn extracts in tests performed by Veličković et al. [11].
The potential antidiabetic properties of black-thorn fruits were evaluated through their ability to inhibit carbohydrate hydrolyzing enzymes. The obtained results demonstrate high enzyme inhibi-tory potential of blackthorn extracts, particularly on α-glucosidase. The obtained results are congruent with those reported by Popović et al. [45] who previ-ously explored α-amylase inhibitory activity (α-AIA) and α-glucosidase inhibitory activity (α-GIA) of dif-ferent P. spinosa genotypes. Additionally, all examined samples possessed higher α-GIA than acarbose, which is in accordance with our results.
In summary, the examined extracts are a rich source of polyphenols that could be linked with their antioxidant properties. Beside antioxidant activ-ity, the aqueous and ethanol extract displayed anti-microbial and potential antidiabetic activity, as the ethanol extract was particularly active in inhibiting α-glucosidase, a carbohydrate hydrolyzing enzyme. Taking into account the presented results, it could be
concluded that the ethanol extract of blackthorn fruits is a promising candidate for in vivo research of natural compounds with an antidiabetic effect.
Funding: The authors are grateful to the Ministry of Education, Science and Technological Development for the financial support through Projects: 173029, 173032 and 175011.
Author contributions: IV and SG designed the study. IV, ŽŽ, NR, MI designed, performed the experiments and analyzed the results. IV drafted the manuscript. SG and MS supervised the experi-ments. SG, MS and PM critically reviewed and edited manuscript. All authors read and approved the final manuscript.
Conflict of interest disclosure: The authors declare that there are no financial or non-financial conflict of interest.
REFERENCES
1. Lee S, Jun W. A phylogenetic analysis of Prunus and the Amygdaloideae (Rosaceae) using ITS sequences of nuclear ribosomal DNA. Am J Bot. 2001;88(1):150-60.
2. Webb DA. Prunus L. In: Tutin TG, Heywood VH, Burges NA, Moore DM, Valentine DH, Walters SM, Webb DA, edi-tors. Flora Europaea, 2. Cambridge: Cambridge University Press; 1968. p. 77.
3. Jovanović B. Prunus L. In: Tatić B, Josifović M, Stjepanović L, Janković MM, Gajić M, Kojić M, Diklić N, editors. Flora S.R. Srbije, Vol 4. Beograd: SANU; 1972. p. 179.
4. Pinto Carvalho AM. Etnobotánica del Parque Natural de Montesinho plantas, tradición y saber popular en un ter-ritorio del Nordeste de Portugal [dissertation]. [Madrid]: Departmento de Biologia, Universidad Autónoma de Madrid; 2005.
5. Ruiz-Rodríguez BM, De Ancos B, Sánchez-Moreno C, Fernández-Ruiz V, De Cortes Sánchez-Mata M, Cámara M, Tardío J. Wild blackthorn (Prunus spinosa L.) and haw-thorn (Crataegusmonogyna Jacq.) fruits as valuable sources of antioxidants. Friuts. 2014;69(1):61-73.
6. Leporatti ML, Pavesi A, Posocco E. Phytoterapy in The Val-neria Marche (Central Italy). J Ethnopharmacol. 1985;14:53-63.
7. Yeşilada E, Sezik E, Honda G, Takaishi Y, Takeda Y, Tanaka T. Traditional medicine in Turkey IX: Folk medicine in north-west Anatolia. J Ethnopharmacol. 1999;64(3):195-210. 8. Pieroni A. Medicinal plants and food medicines in the folk
traditions of the upper Lucca Province, Italy. J Ethnophar-macol. 2000;70:235-73.
9. Idolo M, Motti R, Mazzoleni S. Ethnobotanical and phyto-chemical knowledge in a long-history protected area, the Abruzzo, Lazio and Molise National Park (Italian Apen-nines). J Ethnopharmacol. 2010;127:379-95.
10. Cavero RY, Akerreta S, Calvo MI. Pharmaceutical ethno-botany in the Middle Navarra (Iberian Peninsula). J Ethno-pharmacol. 2011;137:844-55.
antioxidant and antimicrobial activity of the extracts from Prunus spinosa L. fruit. Hem Ind. 2014;68(3):297-303. 12. Darias V, Bravo L, Rabanal R, Mateo CS, Luis RG, Perez AH.
New contribution to the ethnopharmacological study of the Canary Islands. J Ethnopharmacol. 1989;25(1):77-92. 13. Miraldi E, Ferri S, Mostaghimi V. Botanical drugs and
prepa-rations in the traditional medicine of West Azerbaijan (Iran). J Ethnopharmacol. 2001;75:77-87.
14. Guarrera PM, Forti G, Maringoli S. Ethobotanical and eth-nomedicinal uses of plants in the district of Acquapendente (Latium, Central Italy). J Ethnopharmacol. 2005;96:429 15. Kültür Ş. Medicinal plants used in Kirklareli Province
(Tur-key). J Ethnopharmacol. 2007;111:341-64.
16. Alarcón R, Pardo-de-Santayana M, Priestley C, Morales R, Heinrich M. Medicinal and local food plants in the south of Alava (Basque Country, Spain). J Ethopharmacol. 2015;176:207-24.
17. Da Silva LP, Pereira E, Pires TC, Alves MJ, Pereira OR, Bar-ros L, Ferreira IC. Rubus ulmifolius Schott fruits: A detailed study of its nutritional, chemical and bioactive properties. Food Res Int. 2019;119:34-43.
18. Mariod AA, Ibrahim RM, Ismail M, Ismail N. Antioxidant activities of phenolic rich fractions (PRFs) obtained from black mahlab (Monechma ciliatum) and white mahlab (Prunus mahaleb) seedcakes. Food Chem. 2010;118:120-7. 19. Ieri F, Pinelli P, Romani A. Simultaneous determination
of anthocyanins, coumarins and phenolic acids in fruits, kernels and liqueur of Prunus mahaleb L. Food Chem. 2012;2157-62.
20. Pinacho R, Cavero RY, Astiasarán I, Ansorena D, Calvo MI. Phenolic compounds of blackthorn (Prunus spinosa L.) and influence of in vitro digestion on their antioxidant capacity. J Funct Foods. 2015;19:49-62.
21. Jayaprakasha GK, Murthy KC, Pellati F, Patil BS. BetaSweet carrot extracts have antioxidant activity and in vitro antip-roliferative effects against breast cancer cells. J Funct Foods. 2019;62:103552.
22. Dikić D, Balta V, Ivana K, Murati T, Orsolic N, Uzelac VD, Jurčević IL. UPLC/MS analysis of plasma bioavailability of 32 polyphenols in C57BL. Mol Exp Biol Med. 2018;2:23-31. 23. Marchelak A, Owczarek A, Rutkowska M, Michel P,
Kolodziejczyk-Czepas J, Nowak P, Olszewska MA. New insights into antioxidant activity of Prunus spinosa flowers: Extracts, model polyphenols and their phenolic metabolites in plasma towards multiple in vivo-relevant oxidants. Phyto-chem Lett. 2019;30:288-95.
24. Fang J. Classification of fruits based on anthocyanin types and relevance to their health effects. Nutrition. 2015;31:1301-6.
25. Hidalgo GI, Almajano MP. Red fruits: extraction of antioxi-dants, phenolic content, and radical scavenging determina-tion: a review. Antioxidants. 2017;6(1):7.
26. Kruger MJ, Davies N, Myburgh KH, Lecour S. Proantho-cyanidins, anthocyanins and cardiovascular diseases. Food Res Int. 2014;59:41-52.
27. Singleton VJ, Rossi JA. Colometry of total phenolics with phosphomolybdic-phosphotungstic acid reagents. Am J Enol Viticult. 1965;16:144-58.
28. Park K, Koo MH, Ikegaki M, Contado JLM. Compari-son of the flavonoid aglycone contents of Apismelifera propolis from various regions of Brazil. Arq Biol Tecnol. 1997;40(1):97-106.
29. Blois MS. Antioxidant determination by use of stable free radical. Nature. 1958;181:1199-200.
30. Miller N, Rice-Evans C. Factors influencing the antioxidant activity determined by the ABTS radical cation assay. Free Radic Res. 1997;26:195-9.
31. Benzie IFF, Strain JJ. The Ferric Reducing Ability of Plasma (FRAP) as a Measure of „Antioxidant Power“: The FRAP Assay. Anal Biochem. 1996;239:70-6.
32. Oyaizu M. Studies on product of browning reaction pre-pared from glucose amine. Jpn J Nutr. 1986;44:307-15. 33. Soković M, Glamočlija J, Marin PD, Brkić D, Van Griensven
LJ. Antibacterial effects of the essential oils of commonly consumed medicinal herbs using an in vitro model. Mol-ecules. 2010;15(11):7532-46.
34. Kostić M, Smiljković M, Petrović J, Glamočlija J, Barros L, Ferreira IC, Ćirić A, Soković M. Chemical, nutritive com-position and a wide range of bioactive properties of honey mushroom Armillaria mellea (Vahl: Fr.) Kummer. Food Funct. 2017;8(9):3239-49.
35. Sokovic MD, Vukojevic J, Marin PD, Brkic DD, Vajs V, Van Griensven LJLD. Chemical composition of essential oils of Thymus and Mentha species and their antifungal activities. Molecules. 2009;14:238-49.
36. Zengin G, Sarikurkcu C, Aktumsek A, Ceylan R, Ceylan O. A comprehensive study on phytochemical characteriza-tion of Haplophyllum myrtifolium Boiss. endemic to Turkey and its inhibitory potential against key enzymes involved in Alzheimer, skin diseases and type II diabetes. Ind Crops Prod. 2014;53:244-51.
37. Wan LS, Min QX, Wang YL, Yue YD, Chen JC.
Xan-thone glycoside constituents of Swertia
kouitchen-sis with α-glucosidase inhibitory activity. J Nat Prod. 2013;76(7):1248-53.
38. Mosmann T. Rapid colorimetric assay for cellular growth and survival: application to proliferation and cytotoxicity assays. J Immunol Methods. 1983;65:55-63.
39. Ohno M, Abe T. Rapid colorimetric assay for the quantifica-tion of leukemia inhibitory factor (LIF) and interleukin-6 (IL-6). J Immunol Methods. 1991;145:199-203.
40. Taylor R. Interpretation of the correlation coefficient: a basic review. J Diagn MedSonogr. 1990;6(1):35-9.
41. Ivanovic J, Tadic V, Dimitrijevic S, Stamenic M, Petrovic S, Zizovic I. Antioxidant properties of the anthocyanin-containing ultrasonic extract from blackberry cultivar “Čačanska Bestrna”. Ind Crops Prod. 2014;53:274-81. 42. Stanković MI, Savić VL, Živković JV, Tadić VM, Arsić IA.
Tyrosinase Inhibitory and Antioxidant Activity of Wild Prunus spinosa L. Fruit Extracts as Natural Source of Bio-active Compounds. Not Bot Horti Agrobot Cluj Napoca. 2019;47(3):651-7.
44. Tahirovic A, Basic N, Copra-Janicijevic A. Effect of solvents on phenolic compounds extraction and antioxidant activity of Prunus spinosa L. fruits. Glas Hem Tehnol Bos Herceg. 2018;(50):19-24.
45. Popović BM, Blagojević B, Pavlović RŽ, Mićić N, Bijelić S, Bogdanović B, Mišan A, Duarte CMM, Serra AT. Com-parison between polyphenol profile and bioactive response in blackthorn (Prunus spinosa L.) genotypes from north Serbia-from raw data to PCA analysis. Food Chem. 2020;302:125373.
46. Fraternale D, Giamperi L, Bucchini A, Sestili P, Paolillo M, Ricci D. Prunus spinosa fresh fruit juice: antioxidant activ-ity in cell-free and cellular systems. Nat Prod Commun. 2009;4(12):1665-70.
47. Acero N, Gradillas A, Beltran M, García A, Mingarro DM. Comparison of phenolic compounds profile and antioxidant properties of different sweet cherry (Prunus avium L.) vari-eties. Food Chem. 2019;279:260-71.
48. Kumarasamy Y, Cox PJ, Jaspars M, Nahar L, Sarker SD. Comparative studies on biological activities of Prunus padus and P. spinosa. Fitoterapia. 2004;75(1):77-80.
49. Radovanović BC, Anđelković SM, Radovanović AB, Anđelković MZ. Antioxidant and antimicrobial activity of polyphenol extracts from wild berry fruits grown in south-east Serbia. Trop J Pharm Res. 2013;12(5):813-9.
50. Gegiu G, Branza AD, Bucur L, Grigorian M, Tache T, Badea V. Contributions to antimicrobial and antifungal study of Prunus spinosa L. Farmacia. 2015;63(2):275-9.
Supplementary Material