SPECTROFLUORIMETRIC DETERMINATION OF
TETRACYCLINE AND TERBUTALINE SULPHATE IN ITS
PURE AND DOSAGE FORMS USING EOSIN Y REAGENT
Theia’a N. Al-Sabha
[a]*, Mohamed Y. Dhamra
[a]and Thabit S. Al-Ghabsha
[bKeywords: Tetracycline; terbutaline sulphate; Eosin Y; fluorimetry.
A spectrofluorimetric method has been developed for the determination of tetracycline hydrochloride and terbutaline sulphate in different dosage forms. The method is based on the quantitative quenching effect of tetracycline hydrochloride and terbutaline sulphate on the native fluorescence of Eosin Y at the pH 6.4 and 3.5 respectively. The quenching of the fluorescence of Eosin Y was measured at 545 nm after excitation at 350 nm. The fluorescence-concentration plots are rectilinear over the range 0.5–18 and 0.05-5.0 μg mL-1 with LOD of 0.531
and 0.241 μg mL-1 and LOQ of 1.77 and 0.806 μg mL-1 for above drugs respectively. The proposed method has been successfully applied
to the analysis of commercial tablets and capsules containing the drug. Statistical comparison of the results with those of the reference method revealed good agreement and proved that there were no significant differences in the accuracy and precision between the two methods.
* Corresponding Authors
E-Mail: [email protected]
[a] Chemistry department, College of Education, Mosul University, Mosul, Iraq
[b] College of Pharmacy, Mosul University, Mosul, Iraq
INTRODUCTION
Terbutaline sulphate [2-(tert -butylamino)-1-(3,5-dihydroxyphenyl)ethanol sulphate]1 is a short-acting bronchorelaxant which can be given orally,2 it is readily metabolized in the gut wall and liver when given orally. It has a short duration of action.3 It has the following chemical structure (Figure 1).
Figure 1. Structure of terbutaline sulphate.
Terbutaline sulphate is widely used as an effective bronco dilator in the management of asthma. This is used as prophylactic drug as well as to prevent acute exacerbations of asthma, chronic bronchitis, emphysema and other lung diseases. It relaxes and opens air passage in the lungs, making it easier to breathe3,4.
Tetracycline hydrochloride [(4S,4aS,5aS,6S,12aS )-4-dimethylamino-1,4,4a,5,5a,6,11,12a-octahydro-3,6,10,12,12 apentahydroxy-6-methyl-1,11-dioxonaphthacene-2-carboxa-mide hydrochloride]1 is an effective antibiotic in treating infections,5 and its absorption is reduced by anti-acids and milk, because it can form insoluble complexes with Ca, Mg, Al and Fe.6 It has the following chemical structure (Figure 2).
Tetracycline is an antibiotic with a broad antibacterial spectrum and bacteriostatic activity, having a good activity against acute disease caused by positive and gram-negative bacteria, including the species like Spirochete, Actinomyces, Ricketsia and Mycoplasma.7
Figure 2. Structure of tetracycline hydrochloride.
Different analytical techniques have been developed for determination of terbutaline sulfate and tetracycline. HPLC,8,9 LC–MS,10 CE,11 CE–MS,12 voltammetry,13 electrochemical method,14,15 liquid chromatography,16,17 capillary electrophoresis18 and chemiluminescence19,20 have been reported for determination of tetracycline. These methods are often time-consuming, expensive, and cumbersome.
Experimental
Fluorescence spectral measurements were made on a RF-5301PC-Spectrofluorophotometer (Tokyo, Japan) equipped with a xenon lamp and 10 mm quartz cells. Excitation and emission wavelengths were set at 350 and 545 nm with the excitation and emission slit widths of 10 nm, respectively. All measurements were performed at 28±1 °C. Philips PW 94 supplied with CE 10-12 pH electrode was used for pH measurement.
All reagents were of analytical-reagent grade which were provided by BDH and Fluka companies. Stock solutions of terbutaline sulphate and tetracycline hydrochloride drugs were prepared in concentration of 50 μg mL-1 by dissolving 0.01 g of each in distilled water and made up to 200 mL in volumetric flask. The solutions were kept in refrigerator. The Eosin Y solution of 50 μg mL-1 was prepared by dissolving 0.01g in distilled water and made up to 200 mL in a volumetric flask. The acetate buffer solution was prepared with pH 6.0 and 3.55 by mixing sodium acetate and acetic acid solutions of 0.1 M and adjusted by pH meter.
General procedure
Aliquots of solution containing 0.1-3.6 mL and 0.01-1.0 mL of 50 μg mL-1 for tetracycline hydrochloride and terbutaline sulphate were added separately into two series of 10-mL volumetric flasks containing 2.5 mL and 2.0 mL of
sodium acetate–acetic acid buffer solution of pH 6.0 and 3.5 respectively and 3.0 mL of 50 μg mL-1 Eosin Y. The solutions were diluted to the mark with distilled water and mixed well. The fluorescence intensity (ΔF) was recorded at 545 nm after excitation at 350 nm. The amount of the drugs was obtained either from their corresponding calibration graphs or the regression equations.
Procedure for pharmaceutical formulations
Tetracycline chloride capsule
Seven tetracycline hydrochloride capsules content (each capsule contains 250 mg tetracycline hydrochloride) were accurately weighed and pulverized. A portion of the fine and homogenized powder equivalent to one capsule was accurately weighed and dissolved in 5 mL ethanol for increasing dissolution and made up to 100 mL with distilled water. The mixture was mixing well and filtered through Whatman no.42 filter paper. The filtrate was diluted to the 250 mL with distilled water to obtain 1000 μg mL-1 concentration. A suitable volume was diluted, and the general procedure was followed.
Terbutaline tablet
Twenty terbutaline sulphate tablets (each tablet contains 5 mg terbutaline sulphate) were accurately weighed and pulverized. A portion of the fine and homogenized powder equivalent to one tablet was accurately weighed and dissolved in distilled water, mixing well and filtered through Whatman no.1 filter paper. The filtrate was diluted to the 100 mL with distilled water obtain a concentration of 50 μg mL-1. A suitable volume was diluted, and the general procedure was followed.
Results and Discussion
In the present study, tetracycline hydrochloride and terbutaline sulphate were found to form ion pair red complexes with Eosin Y at pH of 6.0 and 3.55 respectively, with maximum absorbance at 545 nm (Figure 3). The complexes are formed mainly due to the electrostatic interaction between the studied drug and anionic functional group of Eosin Y at suitable pH. The formed ion pair complexes are not fluorescent, therefore, the decrease in the fluorescence intensity of Eosin Y upon the addition of the drugs was the basis for the spectrofluorimetric measurement at 545 nm after excitation at 350 nm (Figure 4a, 4b).
Figure 3. Absorption spectra of (a) 8 μg mL-1 terbutaline sulphate
and (b) 40 μg mL-1 tetracycline hydrochloride with Eosin Y
against their respective reagent blank (a', b') under optimum conditions.
Figure 4a Excitation and emission spectra of: (a`, b`, c` ) Blank Eosin Y (15 μg mL-1) at pH 6.4; (a, b, c) Reaction product of Eosin
Y (15 μg mL-1) and tetracycline hydrochloride (0.0, 2.0 and 12.0
μg mL-1).
Figure 4b. Excitation and emission spectra of: (a`, b`, c` ) Blank Eosin Y (15μg mL-1) at pH 6.4; (a, b, c) Reaction product of Eosin
Optimization of Experimental Parameters
The different experimental parameters affecting the development of the reaction products and its stability were studied and optimized for the spectrofluorimetric method. Such parameters were changed individually while others were kept constant. These parameters include selection of Eosin Y concentration, pH, type of buffer and its volume, temperature, reaction time and effect of solvent.
Selection of Eosin Y concentration
To select the concentration of Eosin Y for determination of the drugs, a calibration curve was prepared by addition aliquots of 50 μg mL-1 Eosin Y in a set of 10-mL calibrated flasks and diluted to the mark with distilled water. The fluorescence intensity was measured after 5 min. at 545 nm after excitation at 350 nm. Beer's law was obeyed in the range 0.5-15 μg mL-1 (Figure 5). However; 15 μg mL-1 of Eosin Y was selected in this study.
Figure 5. Calibration curve of Eosin Y.
Effect of pH and buffers
When tetracycline hydrochloride added to the Eosin Y, a quenching of the fluorescence intensity for Eosin Y was immediately observed. The final pH of the solution was measured and found 6.0. But quenching of Eosin Y by addition of terbutaline sulphate was observed in the presence of acid with pH 3.55 at final dilution. Therefore, different buffers as phthalate, acetate and citrate of pH 6 and 3.55 were prepared to obtain high ΔF for above drugs respectively. However; acetate buffer was gave maximum ΔF for both drugs and chosen as the optimum throughout the study. It was found that 2.5 and 2.0 mL of acetate buffer gave high ΔF for above drugs respectively (Figure 6).
Effect of heating time and temperature
The effect of temperature, at room temperature (27 C) and 40 C, and of time on the quenching of the fluorescence intensity of Eosin Y was studied. It was found that the decrease in the fluorescence intensity of Eosin Y was immediate upon addition of drug in the presence of acetate buffer solution at room temperature and remained constant for more than 90 min for tetracycline hydrochloride and more than 120 min for terbutaline sulphate (Figure 7).
However, standing times of 5 and 10 min at room temperature were chosen for tetracycline hydrochloride and terbutaline sulphate, respectively.
Figure 6. Effect of the volume of acetate buffer solution onΔF of the tetracycline hydrochloride (2.5 g mL-1) and terbutaline
sulphate (2.5 g mL-1) with 15 g mL-1 Eosin Y.
Figure 7. Effect of temperature and standing time on the fluorescence intensity (ΔF) for 2.5 g mL-1 of (a) tetracycline
hydrochloride and (b) terbutaline sulphate ion pair complexes with 15 g mL-1 Eosin Y.
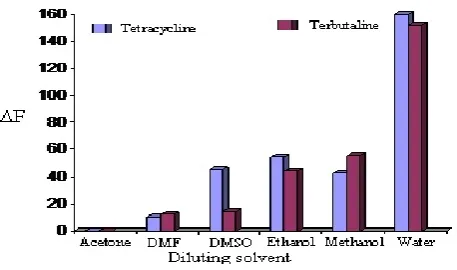
Figure 8. Effect of organic solvent and water on the fluorescence
intensity (ΔF) for 2.5 g mL-1 of tetracycline hydrochloride
and terbutaline sulphate ion pair complexes with 15 g mL-1 Eosin
Effect of diluting solvents
Dilution effect with different organic solvents, such as acetone, DMF, DMSO, ethanol and methanol in addition to water, were tested on the relative fluorescence intensity. The results revealed that best solvent was water, where as the organic solvents diminished the fluorescence of Eosin Y (Figure 8). Therefore, water was used as diluting solvent.
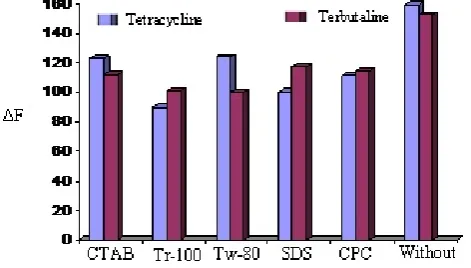
Effect of surfactant
In order to improve fluorescence intensity (ΔF), various surfactants such as sodium dodecyl sulphate (SDS), cetyltrimethyl ammonium bromide (CTAB), Tween 80 (Tw-80), Triton X-100 (Tr-100), and cetylpyridinium chloride (CPC) were added to the tetracycline hydrochloride and terbutaline sulphate solutions, and their effect was studied. None of the studied surfactants had significant effect on ΔF for both drugs (Figure 9).
Figure 9. Effect of surfactants on the fluorescence intensity.
Effect of order of addition of reagents
Series of solutions were prepared with different orders of addition of reagents but the same concentrations of reagents, and their corresponding blank solutions were measured at λex/λem = 350 nm/545 nm. The results shown in Figure 10 indicate that addition of acetate buffer followed by addition of Eosin Y and drug gave maximum ΔF and was used in general procedure.
Figure 10. Effect of addition order on the ΔF for tetracycline.HCl (2.5 g mL-1) and terbutaline.H
2SO4(2.5 g mL-1) whereas S= drug, B=buffer solution and R= Eosin Y.
Selectivity
The selectivity of the proposed method was evaluated by analyzing the standard solutions of tetracycline hydrochloride and terbutaline sulphate in the presence of some excipients such as cited in table 1. It was observed that these excipients did not interfere with the proposed method. The results of the recovery experiment also indicated that accuracy is not affected by the co-formulated substances.
Method validation
Linearity, limits of detection and quantitation
Under the optimized experimental conditions, the calibration graphs were constructed by plotting the difference in fluorescence intensity (ΔF) as a function of the corresponding tetracycline hydrochloride and terbutaline sulphate concentrations in g mL-1 (Figure 11). The linear relationships were obtained in the concentration range 0.5– 18 and 0.05-5.0 μg mL-1 for above drugs respectively. The linearity was represented by the regression equation and the corresponding correlation coefficient for drugs determined by the proposed method represents excellent linearity. Limit of detection (LOD) and limit of quantitation (LOQ) were calculated according to the following formulae
LOD = 3.3σ/b and LOQ = 10σ/b
where σ is the standard deviation of five reagent blank determinations and b is the slope of the calibration curve. The results obtained are in the accepted range below the lower limit of Beer's law range (Table 2).
Accuracy and precision
The accuracy was checked by five times analysis for three different concentrations of pure samples. The results obtained in Table 3 showed the close agreement between the measured and true values indicating good accuracy of the proposed method.The calculated relative standard deviation (RSD) values were found to be ≤ 2.58 % for tetracycline hydrochloride and ≤ 3.87 % for terbutaline sulphate indicating good repeatability and reliability of the proposed methods (Table 3).
Method validation and applications
Table 1. Effect of excipients for assay of tetracycline. HCl and terbutaline. H2SO4.
Excipient Recovery % of 2.5 g mL-1 tetracycline.HCl [Exciepient] g mL-1
Recovery % of 2.5 g mL-1terbutaline.H2SO4 [Exciepient] g mL-1
100 500 1000 100 500 1000 Starch 97.34 96.65 95.54 95.92 95.54 95.43 Glucose 100.39 97.75 95.90 98.97 97.93 95.69 Lactose 98.95 98.00 97.20 97.92 98.34 98.44 Sucrose 95.53 96.39 97.24 97.72 98.23 97.41 KCl 102.35 103.21 103.25 98.99 99.73 98.54 NaCl 98.78 99.85 97.39 100.89 102.00 99.99 Na2SO4 94.23 94.54 95.02 95.00 95.09 95.85
Mg-stearate 98.54 97.07 97.32 99.21 99.39 99.91
Stoichiometry
The stoichiometric ratio between tetracycline hydrochloride and Eosin Y at pH 6.4 and terbutaline sulphate and Eosin Y at pH 3.55 were evaluated by mole ratio method32 according to following equation: A
max = f ([Eosin Y] / [drug]), Where the concentration of drugs and Eosin Y are identical (1.04×10⁻⁴M for tetracycline hydrochloride and 9.11×10⁻⁵M for terbutaline sulphate). By the change of Eosin Y volume and keeping the volume of drug constant (0.5 mL) in final volume of 10 mL, the procedures were completed using the optimum conditions for each drug. The results confirm that the ratio of complexes Eosin Y : drug are equal to 2:1 (Figure 12).
Figure 11. Calibration graphs for determination of tetracycline hydrochloride and terbutaline sulphate
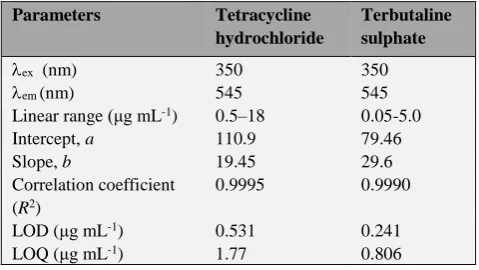
Table 2. Statistical parameters for the determination of tetracycline hydrochloride and terbutaline sulphate.
Parameters Tetracycline
hydrochloride
Terbutaline sulphate
ex (nm) 350 350
em (nm) 545 545 Linear range (μg mL-1) 0.5–18 0.05-5.0
Intercept, a 110.9 79.46 Slope, b 19.45 29.6 Correlation coefficient
(R2)
0.9995 0.9990 LOD (μg mL-1) 0.531 0.241
LOQ (μg mL-1) 1.77 0.806
Table 3. Accuracy and precision of the proposed method
Drug Amount
added (μg mL-1)
Recovery* % RSD*
Tetracycline hydrochloride
5 103.99 1.19 10 101.05 2.58 15 97.80 0.79 Terbutaline sulphate 1 102.80 0.93 2.5 98.38 3.87 4 97.69 1.98
Mechanism of the reaction
Table 4. Assay of tetracycline hydrochloride and terbutaline sulphate drugs in tabletpharmaceutical formulations by the proposed and British Pharmacopoeia methods. (a Every reading is an average of five determinations for the proposed method and average of three
determinations for British pharmacopoeia method. b provided from SDI Co. Iraq. c Manufactured by Mediotic labsHoms-Syria. d The
results obtained by Ref. 31).
a Every reading is an average of five determinations for the proposed method and average of three determinations for British
pharmacopoeia method. b provided from SDI Co. Iraq. c Manufactured by Mediotic labsHoms-Syria. d The results obtained by Ref. 31
Figure 12a. Molar ratio plot for terbutaline sulphate (0.5 ml of
9.11×10⁻⁵M) complexes with Eosin Y.
Figure 12b. Molar ratio plot for tetracycline hydrochloride ( 0.5 ml of 1.04×10⁻⁴M)
Figure 13. Proposed mechanisms for the reaction between (A) terbutaline sulphate and (B) tetracyclinehydrochloride with Eosin Y
Figure 13. Proposed mechanisms for the reaction between terbutaline sulphate and tetracycline hydrochloride with Eosin Y.
Procedure applied
Pharmaceutical preparation
Drug amount taken (g mL-1)
Recovery a (%)
Drug constant found, mg
Average recovery content
Certified value, mg
Proposed method
Tetracycline b
Capsule
5 102.49 256.22 248.06 t-test =1.61 F-test= 0.102
250 10 98.79 246.97
15 96.40 241.00 Asmanol c
tablets
1 105.68 5.28 5.07 t-test =1.12 F-test= 1.34
5 2.5 98.83 4.94
4 99.97 4.99 British
Pharmacopoei a
Tetracycline Capsule
250 mg 97.92 244.80 -
250 Asmanol d
tablets
15 mg 99.21 14.88 mg -
Conclusion
In this study, direct, simple, and sensitive spectrofluorimetric procedure was developed and validated for determination of two drugs; tetracycline hydrochloride and terbutaline sulphate without interference from common excipients. The most important advantage of the method is rapid and inexpensive that the ion-pair formed is measured directly without need for pretreatment of the drug and extraction with organic solvent beside the use of water as diluting solvent. Hence, it can be applied for the routine quality control of the studied drug in its dosage forms.
References
1British Pharmacopeia, London, Stationery Office, 2005.
2Singhall, P. G. S. Jadoun, Sinha, M. and Saraf, S. A., Int. J. Res. Pharm. Sci., 2010, 1, 440.
3Chanda, R., Nath, L. K. and Mahapatra, S., Iranian J. Pharm. Sci.,
2009, 5, 3.
4Senthilraja, M. and Giriraj, P., Asian. J. Pharm. Clin. Res,2011, 4,
13.
5Talaro, K., and Talaro, A., 1996, Foundations in Microbiology,
2nd Edn. WCB Publishers Dubuque, IA. 366p.
6Neuvonen P. J., Drugs,1976, 11, 45.
7Cinquina, A. L., Longo, F., Anastasi, G., Giannetti, L. and
Cozzani, R., J. Chromatogr A, 2003, 987, 227.
https://doi.org/10.1016/S0021-9673(02)01446-2
8Kim, K. H., Kim, H. J. Kim, J. H. Shinv and S. D., J. Chromatogr. B, 2001, 751, 69. https://doi.org/10.1016/S0378-4347(00)00449-7
9Herring, V. L. and Johnson, J. A., J. Chromatogr. B, 2000,741,
307. https://doi.org/10.1016/S0378-4347(00)00107-9
10Doerge, D. R., Bajic, S., Blankenship, L. R., Preece, S.W. and
Churchwell, M. I., J. Mass Spectrom., 1995, 30, 911.
https://doi.org/10.1002/jms.1190300617
11Li, S., Wang, J. S. and Zhao S. L., J. Chromatogr. B,2009, 877,
155. https://doi.org/10.1016/j.jchromb.2008.11.042
12Lu, W. Z. and Cole, R. B., J. Chromatogr. B, 1998, 714, 69.
https://doi.org/10.1016/S0378-4347(98)00054-1
13Yilmaz, N., Özkan, S. A., Uslu, B., Şentürk, Z., enturk, and
Biryol, I., J. Pharm. Biomed. Anal., 1998, 17, 349.
https://doi.org/10.1016/S0731-7085(97)00226-4
14Huang, C. Z., Liu, Y. and Li, Y. F., J. Pharm. Biomed. Anal.,
2004, 34, 103. https://doi.org/10.1016/j.japna.2003.08.006
15Ghandour, M. A. and Ali, A. M. M., Anal. Lett., 1991, 24, 2171.
https://doi.org/10.1080/00032719108053043
16Zhao, F., Zhang, X. and Gan, Y., J. Chromatogr. A, 2004, 1055,
109. https://doi.org/10.1016/j.chroma.2004.08.131
17Charoenraks, T., Chuanuwatanakul, S., Honda, K., Yamaguchi, Y.
and Chilapakul, O., Anal. Sci., 2005, 21, 241.
https://doi.org/10.2116/analsci.21.241
18Nozal, L., Arce, L., Simonet, B. M., Ríos, A. and Vacárcel, M.,
Anal. Chim. Acta, 2004, 517, 89.
https://doi.org/10.1016/j.aca.2004.04.050
19Lau, C., Lu, J. and Kai, M., Anal. Chim. Acta, 2004, 503, 235.
https://doi.org/10.1016/j.aca.2003.10.035
20Townshend, A., Ruengsitagoon, W., Thongpoon, C. and
Liawruangrath, S., Anal. Chim. Acta, 2005, 541, 105.
https://doi.org/10.1016/j.aca.2004.11.013
21Smith, A. A., Manavalan, R. and Sridhar, K., Int. Res. J. Pharm.,
2010, 1, 213.
22Li-qing, Z., Jing, L., Shun-li, F., Lin-xiao, G., Quan-min,
L., Huaxue Yanjiu Yingyong, 2010, 22, 961.
23Bhatt, K. K., Shah, S. A. and Pandya, S. S., Ind. Drugs, 1999, 6,
318.
24Raoand, K. E. and Sastry, C. S. P., Micochem. J., 1985, 32, 293.
https://doi.org/10.1016/0026-265X(85)90092-X
25Tanabe, S., Ise, C., Kosugi, T. and Kawanabe, K., Anal. Sci.,
1989, 5, 43. https://doi.org/10.2116/analsci.5.43
26Tanabe, S. and Kawanabe, K., Chem. Pham.Bull.,1989, 37, 3131.
https://doi.org/10.1248/cpb.37.3131
27Rufino, J. L., Fernandes, F.C.B., Ruy, M. S., Pezza, R. and
Pezza, L., Eclética Química, 2010, 35.
28Abdel-Khalek, M. M. and Mahrous, M. S., Talanta, 1983, 30,
792. https://doi.org/10.1016/0039-9140(83)80181-7
29Mahrous, M. S. and Abdel-Khalek, M. M., Talanta, 1984, 31,
289. https://doi.org/10.1016/0039-9140(84)80281-7
30Fahelelbom, K. M. S., El-Shabrawy, Y., Talal, A. and Ahmed,
N. , 6th Sci. Conference for Arab. Pharm. Colleges, Ajman -
UAE 19 - 21/10/2002, Oral Communication. Abs. page 43.
31Hashem,H. A., Elmasry, M. S. and Hassan, W. E., J. AOAC Int.,
2012, 95, 1412. https://doi.org/10.5740/jaoacint.11-056
32Hargis, L. G., Analytical Chemistry, Principles and Techniques,
Prentice HallInc, New Jersey, 1988, 424.