O R I G I N A L R E S E A R C H
Open Access
Detection and classification of multiple
power signal patterns with Volterra series
and interval type-2 fuzzy logic system
Rahul
1*, Rajiv Kapoor
1and M. M. Tripathi
2Abstract
The paper deals with the application of Volterra bound Interval type−2 fuzzy logic techniques in power quality assessment. This work proposes a new layout for detection, localization and classification of various types of power quality events. The proposed method exploits Volterra series for the extraction of relevant features, which are used to recognize different PQ events by Interval type-2 fuzzy logic based classifier. Numerous single as well as multiple powers signal disturbances have been simulated to testify the efficiency of the proposed technique. This time– frequency analysis results in the clear visual detection, localization, and classification of the different power quality events. The simulation results signify that the proposed scheme has a higher recognition rate while classifying single and multiple power quality events unlike other methods. Finally, the proposed method is compared with SVM, feed forward neural network and type−1 Fuzzy logic system based classifier to show the efficacy of the proposed technique in classifying the Power quality events.
Keywords:Non-stationary power signals, Power quality (PQ), Volterra series, Interval type-2 fuzzy logic system (IT2FLS), Power Spectral Entropy (PSE), Standard Deviation (SD)
1 Introduction
In the new era of power systems, power quality (PQ) is-sues have attained considerable attention in the last few decades due to increased demand of power electronics and/or microprocessor based non-linear controlled loads. While these devices create power quality prob-lems, at the same time, devices may also malfunction due to the severe power quality problems [1]. Electricity is now treated as commercial product that is evaluated not only by its reliability but also by its quality. The customer will choose the supplier providing electrical energy having better power quality, at lower cost and ac-ceptable reliability that meet his load needs. The utilities or other electric power providers have to ensure a high quality of power delivery to remain competitive and to retain/attract the customers in new electricity market scenario [2].
PQ disturbances/events cover a broad frequency range with significantly different magnitude variations and can be stationary or non-stationary signals [3]. The on-line de-tection and identification of PQ disturbances are essential so that source and cause of such disturbances is known for taking appropriate mitigation/corrective actions. A feasible approach to achieve this goal is to incorporate de-tection capabilities into monitoring equipment so that the events of interest can be recognized, captured and classi-fied automatically. This is done in a sequential manner by detecting the disturbance, then localizing it and finally classifying the various PQ events [4]. To carry out this task a tool is required which has both the capability to analyze different PQ events and classify them as well.
This paper proposes a tool which is the combination of Volterra series and Type-2 fuzzy logic. Volterra series does signal decomposition to extract valuable information from the signal in order to detect power quality distur-bances. The proposed type-2 fuzzy logic method classifies the power quality disturbances even in the presence of higher level of uncertainty hence it is very useful in real time scenario. The general structure of fuzzy reasoning * Correspondence:[email protected]
1Department of Electronics & communication Engineering, Delhi Technological University, Delhi, India
Full list of author information is available at the end of the article
handles much of the uncertainties and fuzzy systems utilize type-1 fuzzy sets (which express uncertainty by numbers in the range [0, 1]) for classification.
This paper has following 5 sections. First, the Volterra series expansion for nonlinear systems explained in Sec-tion II; ApplicaSec-tion of Volterra series in power quality events’detection presented in Section III; in Section IV power spectral entropy for analysis of power quality events, the utilization of the Interval type-2 fuzzy logic system (IT2FLS) for classification PQ events is presented in Section V, Proposed methodology for classification of PQ events given in Section VI, results and discussion in-cluded in section VII and Section VIII concludes the paper.
2 Volterra series expansion for nonlinear systems Let x[n] and y[n] represent the input and output signals, respectively, of a discrete-time and causal nonlinear sys-tem. The Volterra series expansion for y[n] using x[n] is given by:
y nð Þ ¼h0þ
X∞
m1¼0h1½ m1x n½ −m1 þX∞m
1¼0
X∞
m2¼0h2½m1;m2x n½ −m1x n½ −m2 þ::
ð1Þ
In (1), hp[m1, m2,…, mp] is known as the p-the order Volterra kernel of the system, Without any loss of gener-ality, the kernels can be assumed to be symmetric. In general any kernel hp [m1, m2. …, mp] can be replaced by symmetric one by simple setting.
hsym
p m1;m2; ::::mp
¼n!1X
mi1;mi2:::::mip
εshp mi1;mi2:::::mip
h i
2 4
3 5
ð2Þ
Where s is set of all permutations of m1, m2,.... mp. The Volterra series is a power series with memory. This can be checked by changing the input by a gain factor d so that the new input is dx(t). By using (2), the new out-put is
y nð Þ ¼h0þdm
X∞
m1¼0h1½ m1x n½ −m1
þX∞m
1¼0
X∞
m2¼0h2½m1;m2x n½ −m1x n½ −m2 þ::::
i
ð3Þ
This is a power series with amplitude factor d. The inte-grals are convolutions it shows that series having memory. As an effect of its power series features, it has some limi-tations associated with the application of the Volterra series to nonlinear problems. The convergence of Volterra series is one of the major limitations. One can think of the Volterra series expansion as a Taylor series expansion with memory. The limitations of the Volterra series expansion are similar to those of the Taylor series expansion both
expansions do not do well when there are discontinuities in the system description [5].
2.1 Volterra kernels estimation by exponential method Numerous methods have been explored in the literature for determining the kernels or the associated transfer functions. Among them, the method of exponential in-puts specifically chosen for calculating Volterra kernel in this paper. Let us consider the Volterra series expansion of a nonlinear system of the form
y tð Þ ¼X∞p¼1
Zt1
0 ::::
Ztp
0
hp m1;m2; ::::mp
x tð−m1Þ::::x t−mp
dm1::::::dmp
ð4Þ
Let the input x(t) be a sum of exponentials
x tð Þ ¼es1tþes2tþ ::::::esqt
Where s1;s2;…sq are rationally independent. This means that there are no rational numbers β1;β2;…:βq such that the sum β1s1þβ2s2þ…βqsq is rational. Then (4) becomes
y tð Þ ¼X∞p¼1 Xqq 1::::
Xq
qp¼1Hp sq1::::sqm
e sq1þ::::sqm
t
" #
ð5Þ
if each sioccurs (sq1……:sqm), ritimes, then there are
p! r1!r2!…::rq!
Then (4) can be written in the form
y tð Þ ¼X∞p¼1Xr p!
r1!r2!::::rq!Hp Sq1::::Sqm
e sq1þ::::sqm
t
ð6Þ
where r under the summation sign indicates that the sum includes all the distinct vectors r1;r2;…:rq
) such that Pqi¼1ri¼p . If r1¼r2¼…¼rq¼1 then the
amplitude associated with the exponential term
eðsq1þ…sqmÞt is q !H
q s1;…:sq
. Now just calculating the transfer function of the system, we can calculate Volterra series kernel.
differential equation in mathematics. The harmonically excited nonlinear systems’ behavior can be investigated better using Volterra series representation [6].
Volterra series expansion exists for nonlinearity and stationarity. Even though PQ events are non-stationary in nature so this technique is applicable to power quality disturbances, Volterra system models have been successfully employed in PQ events detection and localization applications in this paper and such models can also be implemented in real time PQ events moni-toring system which can change the present scenario of PQ events monitoring system.
3 Application of Volterra series
In this section application for Volterra series for analysis & detection of power quality events has been performed. Volterra series method for detection of power quality events involve applying Volterra series on nonstationary PQ events cause variation in output as compare to pure power signal. Sag refers to de-crease in rms voltage or current between 0.1 and 0.9 pu at the power frequency for durations of 0.5 cycles to 60 s. Swell causes an increase in rms voltage and current to between 1.1 pu and 1.8 pu at the power fre-quency durations from half cycle to 60 s. During the starting time electric motors draw high current, start-ing an electric motor can be a main cause of voltage sag. While the effects of sag are more prominent, the
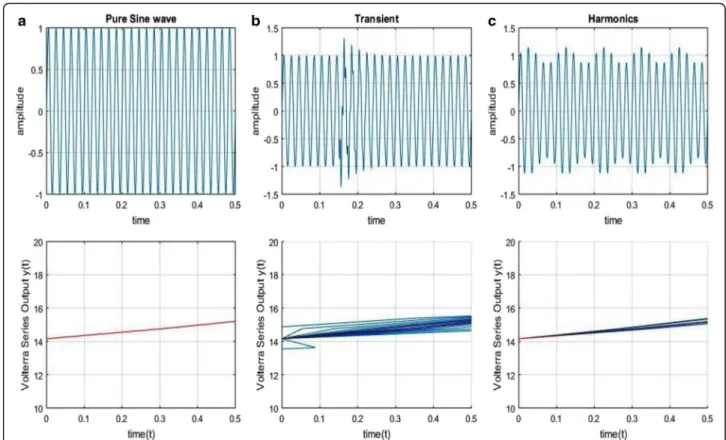
effects of a voltage swell are often more fatal. It may cause destruction of components on the power sup-plies of the equipment, though the effect may be a progressive, cumulative effect. When there is no dis-turbance than series output is approximately linearly vary with time in Fig. 1a, but in case of sag it will be different from that of pure signal, it lies below the pure signal output in Fig. 1b. In case of swell PQ event Volterra series output lie above the pure sine wave output in Fig. 1c, after swell the event sag will be ap-pear so it will come below the pure sine wave Volterra series output after swell is over.
In contrast to no disturbance output in Fig. 2a, when transient event occurs due to switching action in power system then Volterra series output shows irregularity in output due to disturbance shown in Fig. 2b. General solution of transient is to use controlled switches in the system. Another PQ event harmonics which cause voltage waveform distortion, can change the amplitude of signal 0-20% from its nominal value, by applying Volterra method, different curves for different harmonics appear on the plot which shows the number of harmonics present in the disturbed signal in Fig. 2c.
Multiple disturbances can also be detected with the given technique and output can be correlate with no dis-turbance output in Fig. 3a. When sag with harmonics occurs as a disturbance in the system then Volterra series output clearly detect the harmonics with different
Fig. 2Volterra series output foraPure sine wavebTransientcHarmonics
curve for different harmonic in Fig. 3b. In case of swell with harmonics, the event swell and harmonics both de-tected with different curves in the Volterra series output in Fig. 3c. These results are used for feature extraction which helps in classification of PQ events. In this study features extraction phase is different from that inspected in literature, due to the fact that these two features re-quires less computational overhead. The power spectral entropy i.e. frequency domain feature and time domain feature, standard deviation selected to classify events, These specifically extracted features are used for classifi-cation using Interval type-2 fuzzy logic system.
4 Power spectral entropy
Power spectral entropy describes randomness and
complexity in spectrum and also a measure used to characterize signal spectrum flatness. Calculation of PSE requires the spectrum S(wiÞ of PQ events. Now Calcula-tion of the Power Spectral Density (P wð i)) by squaring its amplitude and Normalizing the Power Spectral Density between [0, 1], so that it can be treated as a probability density functionpi. Now PSE can be calculated using the standard formula for entropy.
p wð Þ ¼i
1 Njs wð Þi j
2 ð
7Þ
pi¼ p wi ð Þ
X ip wð Þi
ð8Þ
PSE¼−Xni¼1pilnpi ð9Þ
In this paper PSE used for feature extraction of PQ events for classification purpose. PSE calculated for each and every event. This PSE based data is used as input in
interval type 2 fuzzy logic system for classification of power quality disturbance. In Fig. 4. Power spectral en-tropy values for various PQ events plotted, for each event this value is different.
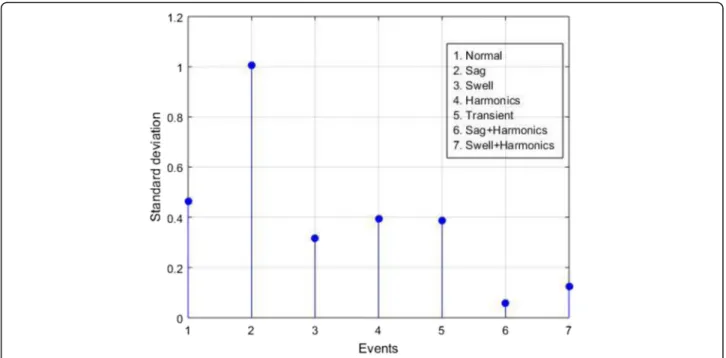
The standard deviation is a measure that is used to evaluate the amount of variation in sample values form its mean value, taking for observation. A low standard deviation reveals that the sample values approaching to-wards the mean value, high standard deviation indicates that the sample values are spread out over a wider range of values. In this paper Standard deviation accounts for feature extraction of PQ events, Volterra series output calculated for each events and then SD of Volterra series output for every events taken as feature for classfier (IT2FLS). In Fig. 5. SD values plotted for every event considered in this paper. In normal case when no dis-turbance then value of SD is 4.2. this value is different for every disturbances in case of sag, this is one.
In Fig. 6 when plotting of PSE Vs SD done then its shows the difference clearly between the various PQ events on the bases of extracted features from Volterra series output, it shows that any disturbance in power can easily be detected by Volterra series with easy com-putations. Volterra series takes very less time to detect disturbances in power quality signal as compare to other method which takes large time, large computing over-head and large memory. Volterra series method can be applied in real time scenario as its computing time is very less and its take less computing overhead to detect disturbances.
5 Interval type-2 fuzzy logic system (IT2FLS) Fuzzy systems play vital role in different scientific and engineering applications, especially in controlling
mechanism. The fuzzy sets firstly used by L.A. Zadeh in 1965 to process data and information affected by un-probabilistic uncertainty. The information that is used to formulate the rules in a fuzzy logic system (FLS) is totally uncertain [7]. Antecedent and Conse-quent uncertainties converted into uncertain ante-cedent and consequent membership functions. In Type-2 FLSs antecedent and consequent membership functions are type-2 fuzzy sets, can easily handle rule uncertainties. The concept of type-2 fuzzy sets was introduced as an extension of the concept of an
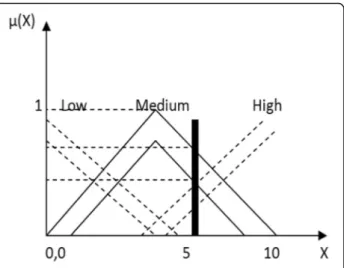
ordinary fuzzy set, i.e., a type-1 fuzzy set. The grades of membership function in type 2 fuzzy are itself fuzzy. A type-2 membership grade can be any subset in (0, 1) and it is called as primary membership [8]. Corresponding to each primary membership, there is a secondary membership (also be in (0, 1)) that de-fines the possibilities for the primary membership. A type 2 fuzzy is a special case of type 1 fuzzy that to-tally represented by membership function as shown in Fig. 7, with triangular membership function. A type-2 FLS includes fuzzifier, rule base, fuzzy inference
Fig. 5Standard deviation of PQ events
engine, and output processor as in type 1 fuzzy [9]. The output processor includes defuzzifier and type-reducer, it generates a type-1 fuzzy set output or a crisp number. Mostly If-then rules are used to characterize type 2 fuzzy logic, but its antecedent or consequent sets are now type-2. If membership function in type 2 logic represented in the form of interval, then type 2 fuzzy logic become“ inter-val type 2 fuzzy logic”.
Interval type-2 fuzzy set,A, can be represented as~
~
A¼ ððx;μÞ;μA~ðx;μÞÞ ∀x∈X;∀μ∈Jx⊆½0;1
ð10Þ
In (10) μA~ðx;uÞ is the IT2FLS membership function, which vary as
0≤μA~ðx;uÞ≤1:
Ã, can be calculated as
~
A¼
Z
x∈X
Z
μ∈JX
μA~ðx;μÞ=ðx;μÞJX⊆½0;1 ð11Þ
In (11)∫∫represents union over all acceptable x and u. Jx is primary membership of x. According to each pri-mary membership value, there is a secondary member-ship value that explains the possibility for primary membership value. Although, the secondary membership functions can take values in the interval of [0,1] showing in Fig. 8. The specification of MFs is one of the major tasks in design of type 2 fuzzy logic system. The selec-tion of type of MF (Gaussian, triangular etc.) and the choice of their certain parameters directly affects the performance [10]. A variety of methods to mitigate this issue have been researched for interval type-2 FLSs. These techniques are generally based on the use of ex-pert knowledge, genetic algorithms, neural networks etc. However, there is still scope in this area to standardize and abridge the selection of particular MFs. Interval Type-2 fuzzy logic techniques are applied in various field
of engineering and science, due to more feasibility in the computations. If the position of membership functions may not be certain accurately, then in such cases, the membership degree cannot be chosen as a particular number in [0, 1], then the use of type-2 fuzzy sets is the better option. If the edges of the triangular function in Fig. 4 are blurred, Fig. 5 can be produced. In Fig. 8, the membership function does not have a unique value for a specific value of X. The values on the intersection of vertical line and the region of membership function do not need all to be weighted same. The three-dimensional membership function of type-2 fuzzy logic that indicates the features of a type-2 fuzzy set is generated if all x∈X have attributed to its own distribution. The union of all primary memberships is said to be the bounded region that express the uncertainty in the incipient member-ships of a type-2 fuzzy set termed as footprint of uncer-tainty (FOU). Both upper membership function and a lower membership function can be taken as two type-1 membership functions that are the constrained for the footprint of uncertainty of a type-2 fuzzy set. In this re-search article IT2FLS used for classification of multiple power quality disturbances. It can handle higher degrees of uncertainty as compare to type-1 fuzzy logic. One extra third dimension in type-2 fuzzy logic systems pro-vide more degrees of freedom for better analysis of un-certainty compared to type-1 fuzzy sets. IT2FLS are beneficial in circumstances where it is difficult to deter-mine the exact membership function for a fuzzy set [11]. Interval type-2 FLS provides the capability of handling a higher level of uncertainty and provides a number of missing components that have held back successful de-ployment of fuzzy systems in human decision making.
6 Proposed methodology for classification
Power quality events generated with MATLAB software and data base is created for detection of power quality
Fig. 7Type-2 membership function
events then Volterra series method is applied for detec-tion and extracdetec-tion of features of power quality events then rule based fuzzification is done to classify power quality events as shown in Fig. 9.
The Proposed state of art uses limiting method to han-dle the lengthy calculations of type-2 FLS. Now type-2 fuzzy converted into type −1. The obtained output of IT2FLS provides more feasible result in comparison of other classification techniques.
7 Results and Discussion
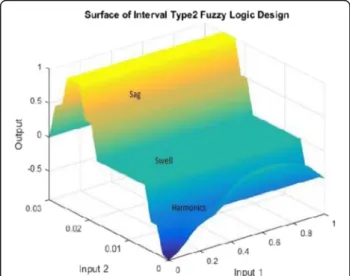
On the basis of rules designed based on analysis done by Volterra series, classification can be done easily for ex-ample in Table 1. If SD is low and PSE is also low then event classified surely be swell, when SD is high and PSE also having higher value in this case event will be sag. If SD is moderate and PSE is low then harmonics will be the cause of disturbance, transient disturbance occurs when SD is moderate and PSE is also moderate. In Fig. 10 classification results for single events shown as surface of interval type 2 fuzzy logic.
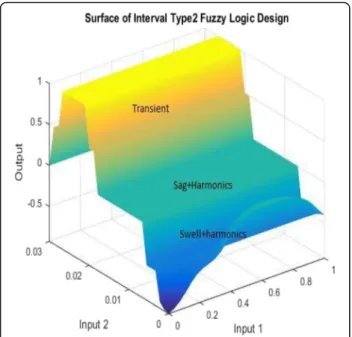
The rules designed for classification of multiple events such as sag plus harmonics and swell plus har-monics show in Table 1, if SD is moderate and PSE is high then multiple events sag plus harmonics occur as disturbance in power quality. In another case when
SD is low and PSE is moderate then disturbance clas-sified will be swell + harmonics.
In Fig. 11 classified multiple events shown as surface of IT2FLS. Type- 2 fuzzy logic can easily classify PQ events on the basis of rule design for the fuzzification, this novel technique can classify multiple events with more than 85% of efficiency. In Table 2. Testing is done for calcula-tion of efficiency based on Volterra series and IT2FLS.
When classification of power quality events done under ideal condition, then no noise in present in the system then IT2FLS system classify sag and swell events with 100% classification efficiency but harmonics and Transient events having classification efficiency 98 and 96% respectively. When multiple events occur such as sag plus harmonics and swell plus harmonics then effi-ciency comes out to be 94%. Overall effieffi-ciency in ideal signal condition is 97% which shows that this technique can classify most of the events with more than 95% effi-ciency respectively as shown in Table 2.
When classification done under certain noise condi-tion with SNR 30 dB in Table 3, then IT2FLS classify sag, swell harmonics with good efficiency (more than 96%) remaining event’s like transient, sag plus harmonics and swell plus harmonics also have efficiency more than 85% as shown in Table 3, overall efficiency in this case is 93% this shows that given classification technique is also applicable for real time scenario. If classification per-formed under SNR 20 dB in Table 4, then IT2FLS
Fig. 9Flowchart
Table 1Rule Editor for IT2FLS
SD\PSE Low Moderate High
Low Swell Swell+Harmonics None
Moderate Harmonics Tansient Sag+Harmonics
High None None Sag
classify sag, swell harmonics with good efficiency (more than 94%) remaining event’s harmonics, transient and remaining multiple events also have efficiency more than 84% as shown in Table 4, and Overall efficiency in this case is 89%. All these classifications performed in MATLAB R2015a 64 bit software.
All these classification results show that in ideal and practical situation this technique performed well for with overall efficiency more than 85%. We can apply this technique in real time monitoring, this novel method definitely perform well in detection and classification of power quality events in real time scenario.
8 Conclusions
This paper proposes a PQ event detection and clas-sification scheme utilizing a Volterra series based
feature extractor and a classifier based on interval type-2 fuzzy logic system. The proposed method can reduce the quantity of extracted features of distorted signal without losing its characteristics and thus, re-quires less memory space and computation time. The performance of classifier is test under three conditions i.e. ideal, SNR 30 dB and SNR 20 for ef-fective classification of PQ events. It is observed that IT2FLS correctly classifies the PQ event with high accuracy and IT2FLS gives the best performance as compared to neural network based classifier and SVM [12]. Therefore, the proposed method can be used as the PQ event classifier in real time system. The overall classification efficiency of IT2FLS is 93% if take average of all three condition mention in this paper. The simulations result show that IT2FLS has higher performance than ANN with feed forward multilayer back propagation (FFML), learning vector
quantization (LVQ), probabilistic neural network
(PNN) [13, 14].
Fig. 11Multiple events classification
Table 2Classification results under ideal signal condition
Events Sag Swell Harmonics Transcient Sag +Har
Swell +Har
Sag 50
Swell 50
Harmonics 49
Transcient 48
Sag+Har 47
Swell+Har 47
Calssification efficiency in %
100 100 98 96 94 94
Classificatione error in %
0 0 2 4 6 6
Overall efficiency 97
Table 3Classification results under SNR 30 db
Events Sag Swell Harmonics Transcient Sag +Har
Swell +Har
Sag 50
Swell 48
Harmonics 48
Transcient 45
Sag+Har 43
Swell+Har 44
Classification efficiency in %
100 96 96 90 86 88
Classification error in %
0 4 4 10 14 12
Overall Efficiency 93
Table 4Classification results under SNR 20 db
Events Sag Swell Harmonic Transcient Sag +Har
Swell +Har
Sag 48
Swell 47
Harmonic 47
Transcient 42
Sag+Har 42
Swell+Har 41
Classification efficiency in %
96 94 94 84 84 82
Classification error in %
6 6 6 16 16 18
Acknowledgment
This work was supported by my mentors Prof. Rajiv Kapoor & Dr. M M Tripathi. I am grateful for their guidance, feedback and advice. I would like to express my deepest thanks to my mentors. They are supportive in their feedback and always motivated me to do work hard.
Authors’contributions
R - Analysis for detection of power quality with volterra series and feature based on volterra series extracted by this author. RK - Interval Type-2 fuzzy logic for classification of power quality is applied for power quality signals by this author. MMT analyzed the results of classification technique and calcu-lated efficiency of classification in different noisy condition and concluded this research article. All authors read and approved the final manuscript.
About the authors
Rahul having B.Tech, M.Tech Degree in electronics & communication and pursuing PhD in electronics & communication department of Delhi technological university, Delhi, India his areas of interest in Power quality, Power line communication, Digital communication and Digital signal processing.
Rajiv Kapoor having BE, ME & PhD degree in electronics & communication and working as a Professor in EC department of Delhi technological university, Delhi India, his areas of interest in Power Quality, Image Processing, Computer Vision, Signal Processing, Cognitive Radio. MM Tripathi having B. Tech and PhD degree in Electrical Engineering and working as Associate Professor in EE Department of Delhi Technological University, Delhi, India and his area of interest are Power quality, Artificial Intelligence (AI) application in power system and Embedded Systems.
Competing interests
The authors declare that they have no competing interests.
Author details
1Department of Electronics & communication Engineering, Delhi
Technological University, Delhi, India.2Department of Electrical Engineering, Delhi Technological University, Delhi, India.
Received: 3 September 2016 Accepted: 28 February 2017
References
1. Kapoor, R., & Saini, M. K. (2012). Classification of power quality events–a review.International Journal of Electrical Power & Energy Systems, 43, 11–19. 2. Kapoor, R., & Saini, M. K. (2007). A new signal processing technique for
power system disturbances detection and classification.Int. J. Electrical Engineering, 88, 9–14.
3. Saini, M. K., Kapoor, R., & Sharma, B. B. (2011). PQ event classification using fuzzy classifier.Advanced Materials Research, 403–408, 3854–3858. 4. Kapoor, R., & Gupta, R. (2011). Statistically matched wavelet-based method
for detection of power quality events.International Journal of Electronics, 98(1), 109–127.
5. Richard, T. (1991). Volterra Series Modeling of Power Conversion Systems.
IEEE Transactions on power electronics,6(4) 712–718.
6. Nam, S-W., Powers E.J., (2003). Volterra Series Representation of Time-Frequency Distributions.IEEE transactions on signal processing,51(6) 1532– 1537.
7. Kapoor, R., & Gupta, R. (2012). Fuzzy lattice based technique for classification of power quality disturbances.International transaction on electrical energy system, 22(8), 1053–1064.
8. Liang Q., Mendel J.M., (2000) Interval Type-2 Fuzzy Logic Systems: Theory and Design.IEEE transactions on fuzzy systems,8(5) 535–550.
9. Mizumoto, M., & Tanaka, K. (1976). Some properties of fuzzy sets of type-2.
Information and Control, 31, 312–340.
10. Mendel J.M., John, Liu F. (2006). Interval Type-2 Fuzzy Logic Systems Made Simple.IEEE transactions on fuzzy systems,14(6) 808–821.
11. Wu H., Mendel J.M. (2002). Uncertainty Bounds and Their Use in the Design of Interval Type-2 Fuzzy Logic Systems.IEEE transactions on fuzzy systems,10(5) 622–639.
12. De Yong D., Bhowmik S., Magnago F. (2015). An effective Power Quality classifier using Wavelet Transform and Support Vector Machines.Expert Systems with Applications,42(15–16) 6075–6081.
13. Biswal B., Biswal M., Mishra S., Jalaja R. (2014). Automatic Classification of Power QualityEvents Using Balanced Neural Tree.IEEE transactions on industrial electronics,61(1).
14. Mishra S., Bhende C. N., Panigrahi B. K. (2008). Detection and Classification of Power Quality Disturbances Using S-Transform and Probabilistic Neural Network.IEEE transactions on power delivery,23(1).
Submit your manuscript to a
journal and benefi t from:
7Convenient online submission
7Rigorous peer review
7Immediate publication on acceptance
7Open access: articles freely available online
7High visibility within the fi eld
7Retaining the copyright to your article