R E S E A R C H A R T I C L E
Open Access
Predicting p
K
a
values from EEM atomic
charges
Radka Svobodov´a Vaˇrekov´a
1, Stanislav Geidl
1, Crina-Maria Ionescu
1, Ondˇrej Skˇrehota
1,
Tom´aˇs Bouchal
1, David Sehnal
1, Ruben Abagyan
2and Jaroslav Koˇca
1*Abstract
The acid dissociation constant pKais a very important molecular property, and there is a strong interest in the
development of reliable and fast methods for pKaprediction. We have evaluated the pKaprediction capabilities of
QSPR models based on empirical atomic charges calculated by the Electronegativity Equalization Method (EEM). Specifically, we collected 18 EEM parameter sets created for 8 different quantum mechanical (QM) charge calculation schemes. Afterwards, we prepared a training set of 74 substituted phenols. Additionally, for each molecule we generated its dissociated form by removing the phenolic hydrogen. For all the molecules in the training set, we then calculated EEM charges using the 18 parameter sets, and the QM charges using the 8 above mentioned charge calculation schemes. For each type of QM and EEM charges, we created one QSPR model employing charges from the non-dissociated molecules (three descriptor QSPR models), and one QSPR model based on charges from both dissociated and non-dissociated molecules (QSPR models with five descriptors). Afterwards, we calculated the quality criteria and evaluated all the QSPR models obtained. We found that QSPR models employing the EEM charges proved as a good approach for the prediction of pKa(63% of these models hadR2>0.9, while the best hadR2= 0.924). As
expected, QM QSPR models provided more accurate pKapredictions than the EEM QSPR models but the differences
were not significant. Furthermore, a big advantage of the EEM QSPR models is that their descriptors (i.e., EEM atomic charges) can be calculated markedly faster than the QM charge descriptors. Moreover, we found that the EEM QSPR models are not so strongly influenced by the selection of the charge calculation approach as the QM QSPR models. The robustness of the EEM QSPR models was subsequently confirmed by cross-validation. The applicability of EEM QSPR models for other chemical classes was illustrated by a case study focused on carboxylic acids. In summary, EEM QSPR models constitute a fast and accurate pKaprediction approach that can be used in virtual screening.
Keywords: Dissociation constant, Quantitative structure-property relationship, QSPR, Partial atomic charges, Electronegativity equalization method, EEM, Quantum mechanics, QM
Background
The acid dissociation constant pKais an important
molec-ular property, and its values are of interest in pharma-ceutical, chemical, biological and environmental research. The pKa values have found application in many areas,
such as the evaluation and optimization of candidate drug molecules [1-3], ADME profiling [4,5], pharmacoki-netics [6], understanding of protein-ligand interactions [7,8], etc.. Moreover, the key physicochemical properties
*Correspondence: [email protected]
1National Centre for Biomolecular Research, Faculty of Science and CEITEC -Central European Institute of Technology, Masaryk University Brno, Kamenice 5, 625 00 Brno-Bohunice, Czech Republic
Full list of author information is available at the end of the article
like lipophilicity, solubility, and permeability are all pKa
dependent. For these reasons, pKa values are important
for virtual screening. Therefore, both the research com-munity and pharmaceutical companies are interested in the development of reliable and above all fast methods for pKaprediction.
Several approaches for pKaprediction have been
devel-oped [8-11], namely LFER (Linear Free Energy Relation-ships) methods [12,13], database methods, decision tree methods [14], ab initio quantum mechanical calculations [15,16], ANN (artificial neural networks) methods [17] or QSPR (quantitative structure-property relationship) mod-elling [18-20]. However, pKa values remain one of the most challenging physicochemical properties to predict.
A promising approach for pKaprediction is to use QSPR models which employ partial atomic charges as descrip-tors [21-24].
The partial atomic charges cannot be determined exper-imentally and they are also not quantum mechanical observables. For this reason, the rules for determining partial atomic charges depend on their application (e.g. molecular mechanics energy, pKaetc.), and many different
methods have been developed for their calculation. The charge calculation methods can be divided into two main groups, namely quantum mechanical (QM) approaches and empirical approaches.
The quantum mechanical approaches first calculate a molecular wave function by a combination of some theory level (e.g., HF, B3LYP, MP2) and basis set (e.g., STO-3G, 6–31G*), and then partition this wave function among the atoms (i.e., the assignment of a specific part of the molecu-lar electron density to each atom). This partitioning can be done using an orbital-based population analysis, such as MPA (Mulliken population analysis) [25,26], L¨owdin pop-ulation analysis [27] or NPA (natural poppop-ulation analysis) [28]. Other partitioning approaches are based on a wave-function-dependent physical observable. Such approaches are, for example, AIM (atoms in molecules) [29], Hirshfeld population analysis [30] and electrostatic potential fitting methods like CHELPG [31] or MK (Merz-Singh-Kollman) [32]. Another partitioning method is the mapping of QM atomic charges to reproduce charge-dependent observ-ables (e.g., CM1, CM2, CM3 and CM4) [33].
Empirical approaches determine partial atomic charges without calculating a quantum mechanical wave func-tion for the given molecule. Therefore they are markedly faster than QM approaches. One of the first empirical approaches developed, CHARGE [34], performs a break-down of the charge transmission by polar atoms into one-bond, two-bond, and three-bond additive contribu-tions. Most of the other empirical approaches have been derived on the basis of the electronegativity equalization principle. One group of these empirical approaches invoke the Laplacian matrix formalism, and result in a redistri-bution of electronegativity. Such methods are PEOE (par-tial equalization of orbital electronegativity) [35], GDAC (geometry-dependent atomic charge) [36], KCM (Kirch-hoff charge model) [37], DENR (dynamic electronega-tivity relaxation) [38] or TSEF (topologically symmetric energy function) [38]. The second group of approaches use full equalization of orbital electronegativity, and such approaches are, for example, EEM (electronegativ-ity equalization method) [39], QEq (charge equilibration) [40] or SQE (split charge equilibration) [41]. The empirical atomic charge calculation approaches can also be divided into ’topological’ and ’geometrical’. Topological charges are calculated using the 2D structure of the molecule, and they are conformationally independent (i.e., CHARGE,
PEOE, KCM, DENR, and TSEF). Geometrical charges are computed from the 3D structure of the molecule and they consider the influence of conformation (i.e., GDAC, EEM, Qeq, and SQE).
The prediction of pKa using QSPR models which
employ QM atomic charges was described in several studies [21-24], which have analyzed the precision of this approach and compared the quality of QSPR mod-els based on different QM charge calculation schemes. All these studies show that QM charges are successful descriptors for pKaprediction, as the QSPR models based
on QM atomic charges are able to calculate pKawith high
accuracy. The weak point of QM charges is that their calculation is very slow, as the computational complexity is at least θ (E4), whereE is the number of electrons in the molecule. Therefore, pKaprediction by QSPR models based on QM charges cannot be applied in virtual screen-ing, as it is not feasible to compute QM atomic charges for hundreds of thousands of compounds in a reasonable time. This issue can be avoided if empirical charges are used instead of QM charges. A few studies were published, which give QSPR models for predicting pKausing
topo-logical empirical charges as descriptors (specifically PEOE charges) [22,42,43]. But these models provided relatively weak predictions.
The geometrical charges seem to be more promissing descriptors, because they are able to take into consid-eration the influence of the molecule’s conformation on the atomic charges. The conformation of the atoms sur-rounding the dissociating hydrogens strongly influences the dissociation process, and also the atomic charges.
The EEM method is a geometrical empirical charge calculation approach which can be useful for pKa
predic-tion by QSPR. This approach calculates charges using the following equation system:
⎛ ⎜ ⎜ ⎜ ⎜ ⎜ ⎜ ⎜ ⎜ ⎜ ⎝
B1 Rκ1,2 . . . R1,κN −1
κ
R2,1 B2 . . .
κ
R2,N −1
..
. ... . .. ... ... κ
RN,1
κ
RN,2 . . . BN −1 1 1 . . . 1 0
⎞ ⎟ ⎟ ⎟ ⎟ ⎟ ⎟ ⎟ ⎟ ⎟ ⎠ ⎛ ⎜ ⎜ ⎜ ⎜ ⎜ ⎜ ⎜ ⎜ ⎜ ⎝ q1 q2 .. . qN χ ⎞ ⎟ ⎟ ⎟ ⎟ ⎟ ⎟ ⎟ ⎟ ⎟ ⎠ = ⎛ ⎜ ⎜ ⎜ ⎜ ⎜ ⎜ ⎜ ⎜ ⎜ ⎝
−A1 −A2 .. . −AN
Q ⎞ ⎟ ⎟ ⎟ ⎟ ⎟ ⎟ ⎟ ⎟ ⎟ ⎠ (1)
whereqiis the charge of atomi;Ri,jis the distance between
atomsiandj;Qis the total charge of the molecule;Nis the number of atoms in the molecule;χis the molecular electronegativity, andAi,Biandκ are empirical
parameterizations [39,44-50] and modifications [47,51,52] of EEM are still under development. Its accuracy is com-parable to the QM charge calculation approach for which it was parameterized. Additionally, EEM is very fast, as its computational complexity is θ (N3), where N is the number of atoms in the molecule.
Therefore, in the present study, we focus on pKa
pre-diction using QSPR models which employ EEM charges. Specifically, we created and evaluated QSPR models based on EEM charges computed using 18 EEM parameter sets. We also compared these QSPR models with correspond-ing QSPR models which employ QM charges computed by the same charge calculation schemes used for EEM parameterization.
Methods
EEM parameter sets
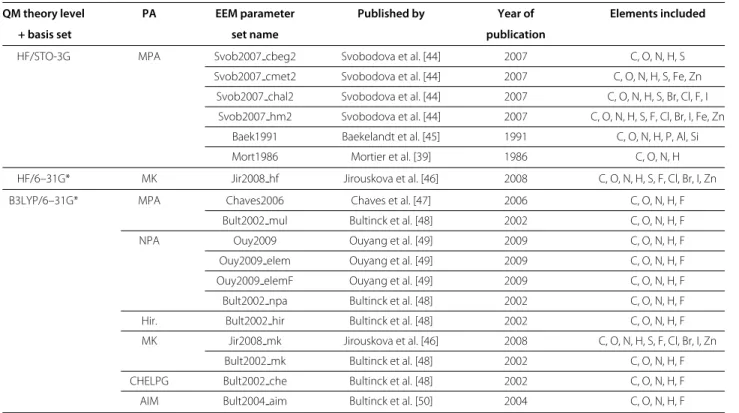
In our study, we used all EEM parameters published till now. Specifically, we found 18 different EEM parame-ters sets, published in 8 different articles [39,44-50]. The parameters cover two QM theory levels (HF and B3LYP), two basis sets (STO-3G and 6–31G*) and six population analyses (MPA, NPA, Hirshfeld, MK, CHELPG, AIM). Unfortunately, only some combinations of QM theory lev-els, basis sets and population analyses are available. On the other hand, more parameter sets were published for some combinations (i.e., 6 parameter sets for HF/STO-3G/MPA). All the parameter sets include parameters for C, O, N and H. Some sets include also parameters for S, P, halogens and metals. Most of the sets do not include parameters for C and N bonded by triple bond. Sum-mary information about all these parameter sets is given in Table 1.
EEM charge calculation
The EEM charges were calculated by the program EEM SOLVER [53] using each of the 18 EEM parameter sets.
QM charge calculation
We calculated QM atomic charges for all the combina-tions of QM theory level, basis set and population anal-ysis for which we have EEM parameters (see Table 1). Specifically, atomic charges were calculated for these eight QM approaches: HF/STO-3G/MPA, HF/6–31G*/MK, and B3LYP/6–31G* with MPA, NPA, Hirshfeld, MK, CHELPG and AIM). The QM charge calculations were carried out using Gaussian09 [54]. In the case of AIM pop-ulation analysis, the output from Gaussian09 was further processed by the software package AIMAll [55].
Data set for phenols
There are two main ways to create a QSPR model for a feature to be predicted. The first is to create as general
a model as possible, with the risk that the accuracy of such a model may not be high. The second approach is to develop more models, each of them being dedi-cated to a certain class of compounds. Here we took the second approach, following a similar methodology as in previous studies [21-24]. Specifically, we focus on substi-tuted phenols, because they are the most common test set molecules employed in the evaluation of novel pKa
predic-tion approaches [21-24,56-58]. Our data set contains the 3D structures of 74 distinct phenol molecules. This data set is of high structural diversity and it covers molecules with pKa values from 0.38 to 11.1. The molecules were
obtained from the NCI Open Database Compounds [59] and their 3D structures were generated by CORINA 2.6 [60], without any further geometry optimization. Our data set is a subset of the phenol data set used in our pre-vious work related to pKa prediction from QM atomic charges [24]. The subset is made up of phenols which contain only C, O, N and H, and none of the molecules contain triple bonds. This limitation is necessary, because the EEM parameters of all 18 studied EEM parameter sets are available only for such molecules (see Table 1). For each phenol molecule from our data set, we also prepared the structure of the dissociated form, where the hydrogen is missing from the phenolic OH group. This dissociated molecule was created by removing the hydrogen from the original structure without subsequent geometry opti-mization. The list of the molecules, including their names, NCS numbers, CAS numbers and experimental pKa val-ues, can be found in the (Additional file 1: Table S1a). The SDF files with the 3D structures of molecules and their dissociated forms are also in the (Additional file 2: Molecules).
Data set for carboxylic acids
An aspect which is very important for the applicability of the pKaprediction approach is its transferability to other
chemical classes. In this work, we provide a case study showing the performance of the approach on carboxylic acids, which are also very common testing molecules for pKaprediction approaches [19-21,43]. The data set
con-tains 71 distinct molecules of carboxylic acids and their dissociated forms. The 3D structures of these molecules were obtained in the same way as for the phenols. The list of the molecules, including their names, NCS numbers, CAS numbers and experimental pKavalues can be found in the (Additional file 3: Table S1b). The SDF files with the 3D structures of the molecules and their dissociated forms are also included in the (Additional file 2: Molecules).
pKavalues
The experimental pKa values were taken from the
Table 1 Summary information about the EEM parameter sets used in the present study
QM theory level PA EEM parameter Published by Year of Elements included
+ basis set set name publication
HF/STO-3G MPA Svob2007 cbeg2 Svobodova et al. [44] 2007 C, O, N, H, S
Svob2007 cmet2 Svobodova et al. [44] 2007 C, O, N, H, S, Fe, Zn
Svob2007 chal2 Svobodova et al. [44] 2007 C, O, N, H, S, Br, Cl, F, I
Svob2007 hm2 Svobodova et al. [44] 2007 C, O, N, H, S, F, Cl, Br, I, Fe, Zn
Baek1991 Baekelandt et al. [45] 1991 C, O, N, H, P, Al, Si
Mort1986 Mortier et al. [39] 1986 C, O, N, H
HF/6–31G* MK Jir2008 hf Jirouskova et al. [46] 2008 C, O, N, H, S, F, Cl, Br, I, Zn
B3LYP/6–31G* MPA Chaves2006 Chaves et al. [47] 2006 C, O, N, H, F
Bult2002 mul Bultinck et al. [48] 2002 C, O, N, H, F
NPA Ouy2009 Ouyang et al. [49] 2009 C, O, N, H, F
Ouy2009 elem Ouyang et al. [49] 2009 C, O, N, H, F
Ouy2009 elemF Ouyang et al. [49] 2009 C, O, N, H, F
Bult2002 npa Bultinck et al. [48] 2002 C, O, N, H, F
Hir. Bult2002 hir Bultinck et al. [48] 2002 C, O, N, H, F
MK Jir2008 mk Jirouskova et al. [46] 2008 C, O, N, H, S, F, Cl, Br, I, Zn
Bult2002 mk Bultinck et al. [48] 2002 C, O, N, H, F
CHELPG Bult2002 che Bultinck et al. [48] 2002 C, O, N, H, F
AIM Bult2004 aim Bultinck et al. [50] 2004 C, O, N, H, F
Descriptors and QSPR models for phenols
Our descriptors were atomic charges. We analyzed two types of QSPR models, namely QSPR models with three descriptors (3d QSPR models) and QSPR models with five descriptors (5d QSPR models).
The 3d QSPR models used those descriptors which proved to be the most relevant for pKaprediction in our
previous study [24]. Therefore these descriptors were the atomic charge of the hydrogen atom from the pheno-lic OH group (qH), the charge on the oxygen atom from
the phenolic OH group (qO), and the charge on the car-bon atom binding the phenolic OH group (qC1). These descriptors were used to establish the QSPR models by the general equation:
pKa=pH·qH+pO·qO+pC1·qC1+p (2)
where pH, pO, pC1 and p are parameters of the QSPR model (i.e., constants derived by multiple linear regres-sion). The 5d QSPR models employ the above men-tioned descriptors qH, qO andqC1 and additionally also the charge on the phenoxide O− from the dissociated molecule (qOD), and the charge on the carbon atom
bind-ing this oxygen (qC1D). Using the charges from the
disso-ciated molecules for pKa prediction was inspired by the
work of Dixon et al. [19]. The equation of the 5d QSPR models is therefore:
pKa=pH·qH+pO·qO+pC1·qC1+pOD·qOD+pC1D·qC1D+p
(3)
wherepH,pO,pC1,pOD,pC1Dandpare parameters of the QSPR model.
Descriptors and QSPR models for carboxylic acids
The descriptors were again atomic charges and, similarly as for phenols, two types of QSPR models were devel-oped and evaluated. Specifically, QSPR models with four descriptors (4d QSPR models) and QSPR models with seven descriptors (7d QSPR models). The 4d QSPR models used similar descriptors as the 3d modmodels for phenols -the atomic charge of -the hydrogen atom from -the COOH group (qH), the charge on the hydrogen bound oxygen atom from the COOH group (qO), and the charge on the carbon atom binding the COOH group (qC1). Addition-ally, also the charge of the second carboxyl oxygen (qO2) is included. These 4d QSPR models are represented by the equation:
pKa=pH·qH+pO·qO+pO2·qO2+pC1·qC1+p (4)
wherepH,pO,pO2,pC1andpare parameters of the QSPR model. The 7d QSPR models employ also charges from the dissociated forms, namely the charge on the carboxyl oxygens (qOD,qO2D) and the charge on the carboxylic
car-bon atom (qC1D). The equation of the 7d QSPR models is
therefore:
pKa=pH·qH +pO·qO+pO2·qO2+pC1·qC1 +pOD·qOD+pO2D·qO2D+pC1D·qC1D+p
where pH, pO, pO2, pC1, pOD, pO2D, pC1D and p are parameters of the QSPR model.
QSPR model parameterization
The parameterization of the QSPR models was done by multiple linear regression (MLR) using the software tool QSPR Designer [62].
Results and discussion
QM and EEM QSPR models for phenols
We prepared one 3d QSPR model and one 5d QSPR model using atomic charges calculated by each of the above men-tioned 18 EEM parameter sets. These models are denoted 3d or 5d EEM QSPR models. Additionally, we created one 3d and one 5d QSPR model using atomic charges calculated by each of the corresponding 8 QM charge calculation approaches (denoted as 3d or 5d QM QSPR models). The data set of 74 phenol molecules was used for the parameterization of the QSPR models, and the obtained models were validated for all molecules in the data set.
The parameterization of the 3d EEM QSPR models showed that several molecules in the data set perform as outliers. For this reason, we created also EEM QSPR models without outliers (i.e., EEM QSPR models for which parameterization was done using a data set that excluded the previously observed outliers). These mod-els are denoted 3d EEM QSPR WO modmod-els. We classified as outliers 10% of the molecules from our data set, which had the highest Cook’s square distance. Therefore the 3d EEM QSPR WO models were parameterized using 67 molecules, and their validation was also done on the data set excluding outliers.
The quality of the QSPR models, i.e. the correlation between experimental pKaand the pKacalculated by each model, was evaluated using the squared Pearson correla-tion coefficient (R2), root mean square error (RMSE), and average absolute pKaerror (), while the statistical
crite-ria were the standard deviation of the estimation (s) and Fisher’s statistics of the regression (F).
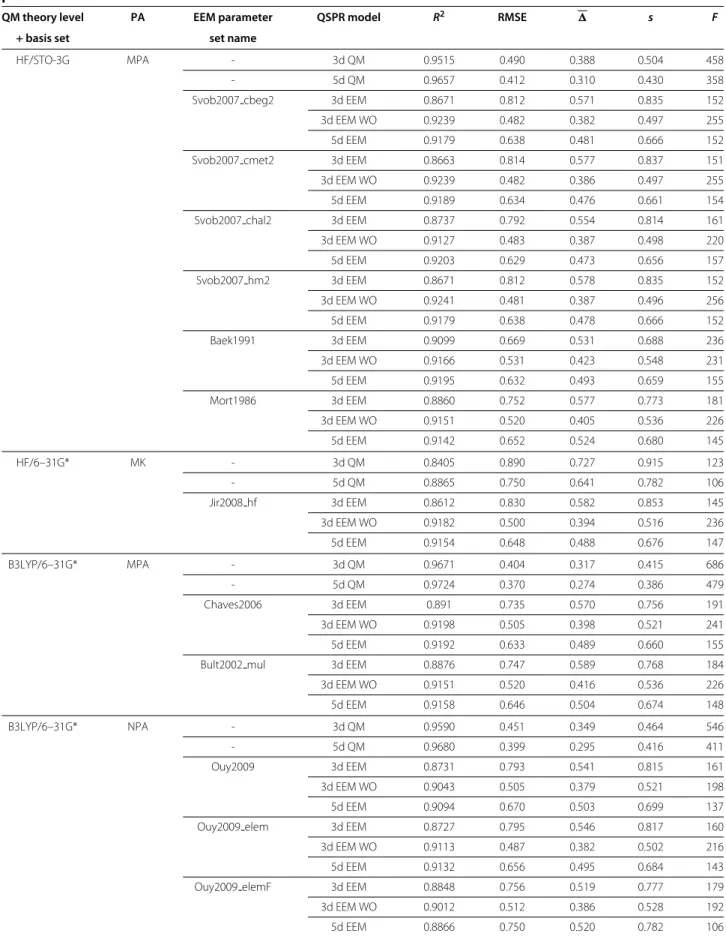
Table 2 contains the quality criteria (R2, RMSE,) and statistical criteria (sandF) for all the QSPR models ana-lyzed. All these models are statistically significant atp=
0.01. Since our data sets contained 74 and 67 molecules, respectively, the appropriateFvalue to consider was that for 60 samples. Thus, the 3d QSPR models are statisti-cally significant (atp= 0.01) whenF >4.126 and the 5d QSPR models whenF > 3.339. Figure 1 summarizes the
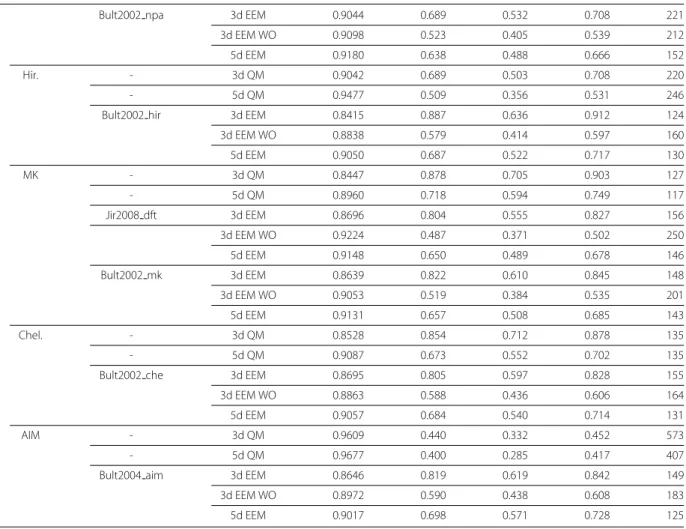
R2of all QSPR models for ease of visual comparison, and Tables 3 and 4 provide a comparison of the models from specific points of view. The parameters of the QSPR mod-els are summarized in the (Additional file 4: Table S2) and all charge descriptors and pKavalues are contained in the
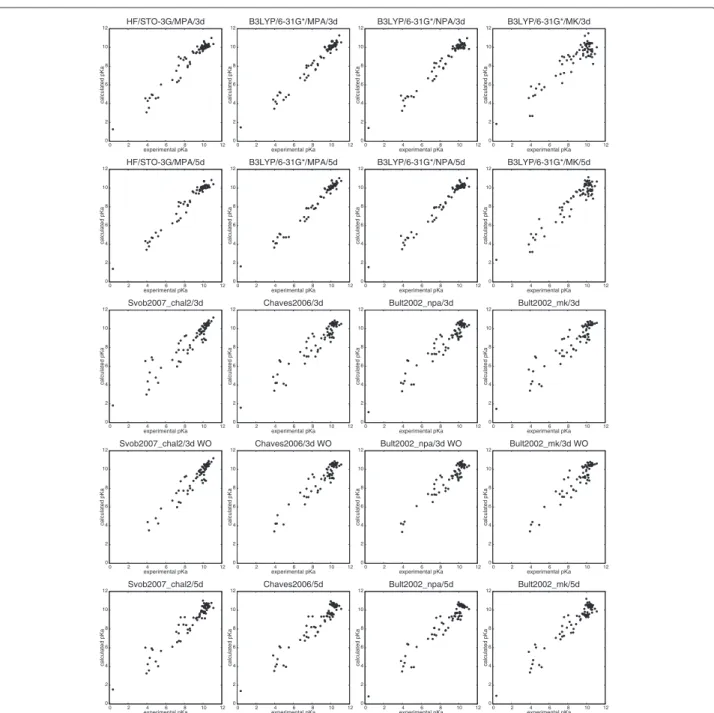
(Additional file 5: Table S6). The most relevant graphs of
correlation between experimental and calculated pKaare visualized in Figure 2.
Prediction of pKausing EEM charges
The key question we wanted to answer in this paper is whether EEM QSPR models are applicable for pKa
prediction. For this purpose we selected a set of phe-nol molecules and generated QSPR models which used EEM atomic charges as descriptors. We then evaluated the accuracy of these models by comparing the predicted pKavalues with the experimental ones. The results (see
Tables 2 and 3, Figure 1) clearly show that QSPR mod-els based on EEM charges are indeed able to predict the pKaof phenols with very good accuracy. Namely, 63% of
the EEM QSPR models evaluated in this study were able to predict pKa withR2 > 0.9. The averageR2for all 54 EEM QSPR models considered was 0.9, while the best EEM QSPR model reachedR2= 0.924. Our findings thus suggest that EEM atomic charges may prove as efficient QSPR descriptors for pKaprediction. The only drawback
of EEM is that EEM parameters are currently not available for some types of atoms. Nevertheless, EEM parameteri-zation is still a topic of research, therefore more general parameter sets are being developed.
Improvement of EEM QSPR models by removing outliers
The quality of 3d EEM QSPR models can be markedly increased by removing the outliers. In this case, the mod-els have averageR2= 0.911 and 83% of them haveR2 > 0.9. The disadvantage of these models is that they are not able to cover the complete data set (i.e., 10% of molecules must be excluded as outliers).
On the other hand, the outliers are similar for all EEM QSPR models. For example, while 16 molecules from our data set are outliers for at least one parameter set, 10 out of these 16 molecules are outliers for five or more parameter sets. From the chemical point of view, most of the outliers contain one or more nitro groups. This may be related to reported lower accuracy of EEM for these groups [48]. In general one limitation of the 3d EEM QSPR models is that they are very sensitive to the quality of EEM charges. Therefore, if the EEM charges are inaccurate for certain compounds or class of compounds, the 3d QSPR models based on these EEM charges will have lower performance for these compounds or class of compounds. In addition, a lower experimental accuracy of these pKavalues may also be a reason for low performance in some cases. A table containing information about outlier molecules is given in the (Additional file 6: Table S3).
Improvement of EEM QSPR models by adding descriptors
Table 2 Quality criteria and statistical criteria for all the QSPR models analyzed in the present study and focused on phenols
QM theory level PA EEM parameter QSPR model R2 RMSE s F
+ basis set set name
HF/STO-3G MPA - 3d QM 0.9515 0.490 0.388 0.504 458
- 5d QM 0.9657 0.412 0.310 0.430 358
Svob2007 cbeg2 3d EEM 0.8671 0.812 0.571 0.835 152
3d EEM WO 0.9239 0.482 0.382 0.497 255
5d EEM 0.9179 0.638 0.481 0.666 152
Svob2007 cmet2 3d EEM 0.8663 0.814 0.577 0.837 151
3d EEM WO 0.9239 0.482 0.386 0.497 255
5d EEM 0.9189 0.634 0.476 0.661 154
Svob2007 chal2 3d EEM 0.8737 0.792 0.554 0.814 161
3d EEM WO 0.9127 0.483 0.387 0.498 220
5d EEM 0.9203 0.629 0.473 0.656 157
Svob2007 hm2 3d EEM 0.8671 0.812 0.578 0.835 152
3d EEM WO 0.9241 0.481 0.387 0.496 256
5d EEM 0.9179 0.638 0.478 0.666 152
Baek1991 3d EEM 0.9099 0.669 0.531 0.688 236
3d EEM WO 0.9166 0.531 0.423 0.548 231
5d EEM 0.9195 0.632 0.493 0.659 155
Mort1986 3d EEM 0.8860 0.752 0.577 0.773 181
3d EEM WO 0.9151 0.520 0.405 0.536 226
5d EEM 0.9142 0.652 0.524 0.680 145
HF/6–31G* MK - 3d QM 0.8405 0.890 0.727 0.915 123
- 5d QM 0.8865 0.750 0.641 0.782 106
Jir2008 hf 3d EEM 0.8612 0.830 0.582 0.853 145
3d EEM WO 0.9182 0.500 0.394 0.516 236
5d EEM 0.9154 0.648 0.488 0.676 147
B3LYP/6–31G* MPA - 3d QM 0.9671 0.404 0.317 0.415 686
- 5d QM 0.9724 0.370 0.274 0.386 479
Chaves2006 3d EEM 0.891 0.735 0.570 0.756 191
3d EEM WO 0.9198 0.505 0.398 0.521 241
5d EEM 0.9192 0.633 0.489 0.660 155
Bult2002 mul 3d EEM 0.8876 0.747 0.589 0.768 184
3d EEM WO 0.9151 0.520 0.416 0.536 226
5d EEM 0.9158 0.646 0.504 0.674 148
B3LYP/6–31G* NPA - 3d QM 0.9590 0.451 0.349 0.464 546
- 5d QM 0.9680 0.399 0.295 0.416 411
Ouy2009 3d EEM 0.8731 0.793 0.541 0.815 161
3d EEM WO 0.9043 0.505 0.379 0.521 198
5d EEM 0.9094 0.670 0.503 0.699 137
Ouy2009 elem 3d EEM 0.8727 0.795 0.546 0.817 160
3d EEM WO 0.9113 0.487 0.382 0.502 216
5d EEM 0.9132 0.656 0.495 0.684 143
Ouy2009 elemF 3d EEM 0.8848 0.756 0.519 0.777 179
3d EEM WO 0.9012 0.512 0.386 0.528 192
Table 2 Quality criteria and statistical criteria for all the QSPR models analyzed in the present study and focused on phenols(continued)
Bult2002 npa 3d EEM 0.9044 0.689 0.532 0.708 221
3d EEM WO 0.9098 0.523 0.405 0.539 212
5d EEM 0.9180 0.638 0.488 0.666 152
Hir. - 3d QM 0.9042 0.689 0.503 0.708 220
- 5d QM 0.9477 0.509 0.356 0.531 246
Bult2002 hir 3d EEM 0.8415 0.887 0.636 0.912 124
3d EEM WO 0.8838 0.579 0.414 0.597 160
5d EEM 0.9050 0.687 0.522 0.717 130
MK - 3d QM 0.8447 0.878 0.705 0.903 127
- 5d QM 0.8960 0.718 0.594 0.749 117
Jir2008 dft 3d EEM 0.8696 0.804 0.555 0.827 156
3d EEM WO 0.9224 0.487 0.371 0.502 250
5d EEM 0.9148 0.650 0.489 0.678 146
Bult2002 mk 3d EEM 0.8639 0.822 0.610 0.845 148
3d EEM WO 0.9053 0.519 0.384 0.535 201
5d EEM 0.9131 0.657 0.508 0.685 143
Chel. - 3d QM 0.8528 0.854 0.712 0.878 135
- 5d QM 0.9087 0.673 0.552 0.702 135
Bult2002 che 3d EEM 0.8695 0.805 0.597 0.828 155
3d EEM WO 0.8863 0.588 0.436 0.606 164
5d EEM 0.9057 0.684 0.540 0.714 131
AIM - 3d QM 0.9609 0.440 0.332 0.452 573
- 5d QM 0.9677 0.400 0.285 0.417 407
Bult2004 aim 3d EEM 0.8646 0.819 0.619 0.842 149
3d EEM WO 0.8972 0.590 0.438 0.608 183
5d EEM 0.9017 0.698 0.571 0.728 125
that using two additional charge descriptors from the dis-sociated molecule can markedly improve the predictive power of the EEM QSPR models. Tables 2 and 3, Figure 1 show that these new 5d EEM QSPR models provide better pKa prediction than their corresponding 3d EEM QSPR models. Specifically, adding the descriptors derived from the dissociated molecules increased the averageR2value for the EEM QSPR models from 0.876 to 0.913.
Comparison of EEM QSPR models and QM QSPR models
Another important question is how accurate the EEM QSPR models are in comparison with QM QSPR mod-els. Table 2 and Figure 1 show that QM QSPR models provide, in most cases, more precise predictions. This is confirmed also by the averageR2values from Table 3. This is not surprising, since EEM is an empirical method which just mimics the QM approach for which it was parame-terized. An interesting fact is that the differences in accu-racy between QM QSPR models and EEM QSPR models are not substantial. For example, 5d EEM QSPR mod-els have averageR2=0.913, while 5d QM QSPR models
have averageR2=0.951. We also note that adding more descriptors to a QM QSPR model brings less improve-ment than adding more descriptors to an EEM QSPR model.
Influence of theory level and basis set
EEM parameters are available only for a relatively small number of theory levels (HF and B3LYP) and basis sets (STO-3G and 6–31G*). Therefore we can not perform such a deep analysis of theory level and basis set influence on pKaprediction capability from EEM atomic charges,
QM theory level PA EEM parameter R2of QSPR model
+ basis set set name 3d EEM 3d EEM WO 5d EEM 3d QM 5d QM HF/STO-3G MPA Svob2007 cbeg2 0.8671 0.9239 0.9179 0.9515 0.9657
Svob2007 cmet2 0.8663 0.9239 0.9189 Svob2007 chal2 0.8737 0.9127 0.9203 Svob2007 hm2 0.8671 0.9241 0.9179 Baek1991 0.9099 0.9166 0.9195 Mort1986 0.8860 0.9151 0.9142
HF/6-31G* MK Jir2008 hf 0.8696 0.9182 0.9154 0.8405 0.8865 B3LY P/6-31G* MPA Chaves 2006 0.8910 0.9198 0.9192 0.9671 0.9724
Bult2002 mul 0.8876 0.9151 0.9158
NPA Ouy2009 0.8731 0.9043 0.9094 0.9590 0.9680
Ouy2009 elem 0.8727 0.9113 0.9132 Ouy2009 elemF 0.8848 0.9012 0.8866 Bult2002 npa 0.9044 0.9098 0.9180
Hir. Bult2002 hir 0.8415 0.8838 0.9050 0.9042 0.9477 MK Jir2008 mk 0.8696 0.9224 0.9148 0.8447 0.8960
Bult2002 mk 0.8639 0.9053 0.9131
Chel. Bult2002 che 0.8695 0.8863 0.9057 0.8528 0.9087 AI M Bult2004 aim 0.8646 0.8972 0.9017 0.9609 0.9677
Legend excellent very good good satisfactory acceptable weak R2 0.95 – 0.97 0.92 – 0.95 0.91 – 0.92 0.9 – 0.91 0.85 – 0.9 0.8 – 0.85
Figure 1R2for the correlation between calculated and experimental pK a.
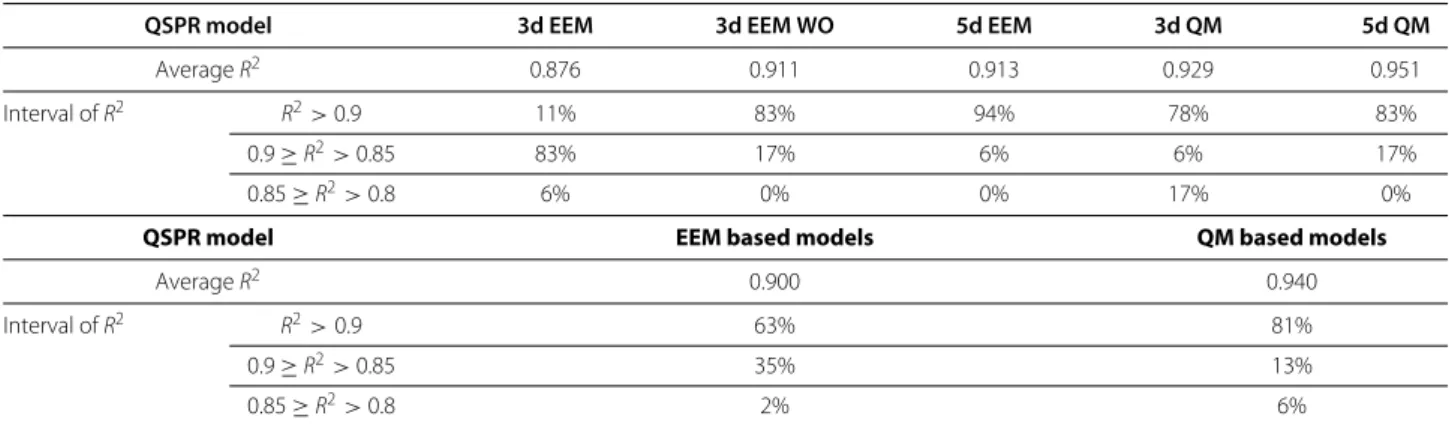
Table 3 AverageR2between experimental and predicted pK
afor all QSPR models of a certain type and percentages of QSPR models whoseR2values are in a certain interval
QSPR model 3d EEM 3d EEM WO 5d EEM 3d QM 5d QM
AverageR2 0.876 0.911 0.913 0.929 0.951
Interval ofR2 R2>0.9 11% 83% 94% 78% 83%
0.9≥R2>0.85 83% 17% 6% 6% 17%
0.85≥R2>0.8 6% 0% 0% 17% 0%
QSPR model EEM based models QM based models
AverageR2 0.900 0.940
Interval ofR2 R2>0.9 63% 81%
0.9≥R2>0.85 35% 13%
0.85≥R2>0.8 2% 6%
Table 4 AverageR2between experimental and predicted pKafor all QSPR models using atomic charges calculated by a specific combination of theory level and basis set, or by a specific population analysis
QSPR model 3d EEM 3d EEM WO 5d EEM 3d QM 5d QM
Theory level HF/STO-3G 0.878 0.919 0.918 0.952 0.966
and basis set * B3LYP/6–31G* 0.889 0.917 0.918 0.967 0.972
Population MPA 0.889 0.917 0.918 0.967 0.972
analysis ** NPA 0.884 0.907 0.907 0.959 0.968
Hirshfeld 0.842 0.884 0.905 0.904 0.948
MK 0.867 0.914 0.914 0.845 0.896
CHELPG 0.870 0.886 0.906 0.853 0.909
AIM 0.865 0.897 0.902 0.961 0.968
0 2 4 6 8 10 12
0 2 4 6 8 10 12
calculated pKa experimental pKa HF/STO-3G/MPA/3d 0 2 4 6 8 10 12
0 2 4 6 8 10 12
calculated pKa experimental pKa B3LYP/6-31G*/MPA/3d 0 2 4 6 8 10 12
0 2 4 6 8 10 12
calculated pKa experimental pKa B3LYP/6-31G*/NPA/3d 0 2 4 6 8 10 12
0 2 4 6 8 10 12
calculated pKa experimental pKa B3LYP/6-31G*/MK/3d 0 2 4 6 8 10 12
0 2 4 6 8 10 12
calculated pKa experimental pKa HF/STO-3G/MPA/5d 0 2 4 6 8 10 12
0 2 4 6 8 10 12
calculated pKa experimental pKa B3LYP/6-31G*/MPA/5d 0 2 4 6 8 10 12
0 2 4 6 8 10 12
calculated pKa experimental pKa B3LYP/6-31G*/NPA/5d 0 2 4 6 8 10 12
0 2 4 6 8 10 12
calculated pKa experimental pKa B3LYP/6-31G*/MK/5d 0 2 4 6 8 10 12
0 2 4 6 8 10 12
calculated pKa experimental pKa Svob2007_chal2/3d 0 2 4 6 8 10 12
0 2 4 6 8 10 12
calculated pKa experimental pKa Chaves2006/3d 0 2 4 6 8 10 12
0 2 4 6 8 10 12
calculated pKa experimental pKa Bult2002_npa/3d 0 2 4 6 8 10 12
0 2 4 6 8 10 12
calculated pKa experimental pKa Bult2002_mk/3d 0 2 4 6 8 10 12
0 2 4 6 8 10 12
calculated pKa experimental pKa Svob2007_chal2/3d WO 0 2 4 6 8 10 12
0 2 4 6 8 10 12
calculated pKa experimental pKa Chaves2006/3d WO 0 2 4 6 8 10 12
0 2 4 6 8 10 12
calculated pKa experimental pKa Bult2002_npa/3d WO 0 2 4 6 8 10 12
0 2 4 6 8 10 12
calculated pKa experimental pKa Bult2002_mk/3d WO 0 2 4 6 8 10 12
0 2 4 6 8 10 12
calculated pKa experimental pKa Svob2007_chal2/5d 0 2 4 6 8 10 12
0 2 4 6 8 10 12
calculated pKa experimental pKa Chaves2006/5d 0 2 4 6 8 10 12
0 2 4 6 8 10 12
calculated pKa experimental pKa Bult2002_npa/5d 0 2 4 6 8 10 12
0 2 4 6 8 10 12
calculated pKa
experimental pKa
Bult2002_mk/5d
Figure 2Correlation graphs.Graphs showing the correlation between experimental and calculated pKafor selected QSPR models.
Table 4). This is in agreement with our previous find-ings [24], and it can be explained by the fact that 6–31G* is a more robust basis set than STO-3G. However, the difference is not marked in the case of EEM QSPR models.
Influence of population analysis
Eleven EEM parameter sets were published for B3LYP/6– 31G* with six different population analyses (see Table 1). Therefore it is straightforward to analyze the influence of the population analysis on the predictive power of the resulting QSPR models (see Table 4). We found that MPA
and NPA provide the best QM models, while MK and CHELPG (PAs based on fitting the atomic charges to the molecular electrostatic potential) provide weak QM mod-els. Our results are in agreement with previous studies [22,24]. QM QSPR models based on AIM predict pKa
Table 5 Comparison between the performance of the QSPR models developed here, and previously developed models
Theory Number of
Method level PA Basis set Descriptors R2 s F molecules Source
QM B3LYP NPA 6–311G** qOH 0.789 1.300 48 15 Kreye and Seybold [23]a
B3LYP NPA 6–311G** qO 0.731 1.500 38 15 Kreye and Seybold [23]a
B3LYP NPA 6–31+G* qOH 0.880 0.970 95 15 Kreye and Seybold [23]b
B3LYP NPA 6–31+G* qO 0.865 1.000 38 15 Kreye and Seybold [23]b
B3LYP NPA 6–311G(d,p) qO− 0.911 0.252 173 19 Gross and Seybold [22]
B3LYP NPA 6–311G(d,p) qH 0.887 0.283 134 19 Gross and Seybold [22]
B3LYP NPA 6–31G* qH,qO,qC1 0.961 0.440 986 124 Svobodova and Geidl [24]
B3LYP NPA 6–311G qH,qO,qC1 0.962 0.435 1013 124 Svobodova and Geidl [24]
B3LYP NPA 6–31G* qH,qO,qC1 0.959 0.464 545 74 This work
B3LYP NPA 6–31G* qH,qO,qC1, 0.968 0.410 705 74 This work
qOD,qC1D
EEM B3LYP NPA 6–31G* qH,qO,qC1, 0.918 0.656 261 74 This workc
qOD,qC1D
QM B3LYP MPA 6–311G(d,p) qH 0.913 0.248 179 19 Gross and Seybold [22]
B3LYP MPA 6–311G(d,p) qO− 0.894 0.274 144 19 Gross and Seybold [22]
B3LYP MPA 6–311G qH,qO,qC1 0.938 0.556 605 124 Svobodova and Geidl [24]
B3LYP MPA 6–31G* qH,qO,qC1 0.959 0.450 936 124 Svobodova and Geidl [24]
B3LYP MPA 6–31G* qH,qO,qC1 0.967 0.415 685 74 This work
B3LYP MPA 6–31G* qH,qO,qC1, 0.972 0.380 822 74 This work
qOD,qC1D
EEM B3LYP MPA 6–31G* qH,qO,qC1, 0.919 0.651 265 74 This workd
qOD,qC1D
QM B3LYP MK 6–311G(d,p) qH 0.344 0.682 9 19 Gross and Seybold [22]
B3LYP MK 6–311G(d,p) qO− 0.692 0.467 38 19 Gross and Seybold [22]
B3LYP MK 6–311G qH,qO,qC1 0.822 0.941 185 124 Svobodova and Geidl [24]
B3LYP MK 6–31G* qH,qO,qC1 0.808 0.978 168 124 Svobodova and Geidl [24]
B3LYP MK 6–31G* qH,qO,qC1 0.845 0.902 126 74 This work
B3LYP MK 6–31G* qH,qO,qC1 0.896 0.739 201 74 This work
qOD,qC1D
EEM B3LYP MK 6–31G* qH,qO,qC1 0.915 0.669 250 74 This worke
qOD,qC1D
aWith solvent model SM5.4. bWith solvent model SM8. cEEM parameter set Bult2002 npa. dEEM parameter set Chaves2006. eEEM parameter set Jir2008 mk.
this drawback of EEM allowed the EEM QSPR models employing MK charges to predict pKa more accurately
than the corresponding QM QSPR models.
Influence of the EEM parameter set
Two or more EEM parameter sets are available in litera-ture for four combinations of theory level, basis set and population analysis (see Table 1). We found that the qual-ity of EEM QSPR models employing the same types of
charges slightly varies when using EEM parameters com-ing from different studies (see Table 2 and Figure 1). Even EEM parameters from the same study, but obtained by different approaches, lead to QSPR models of slightly dif-ferent quality. In any case, these differences are minimal.
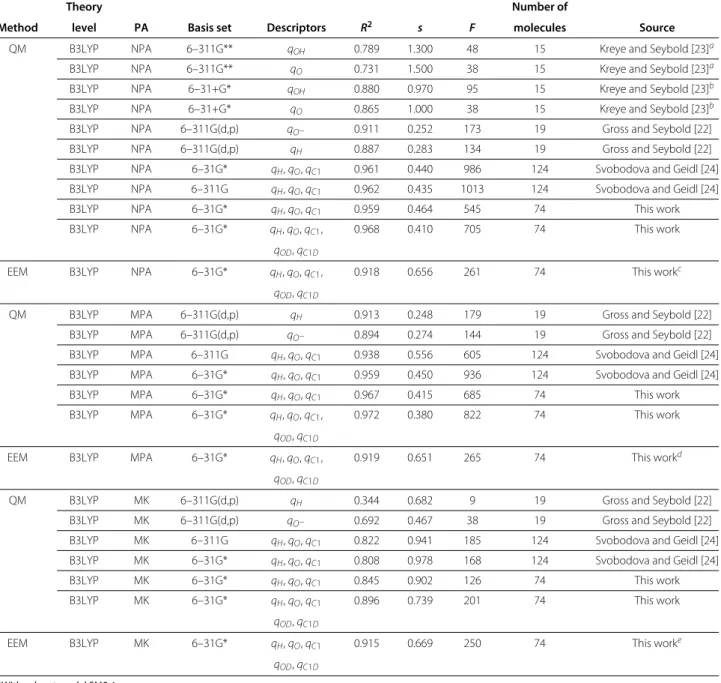
Comparison with previous work
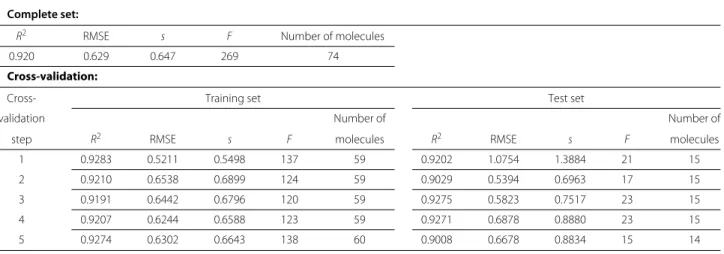
Table 6 Comparison of the quality criteria and statistical criteria for the training set, test set and complete set for some selected charge calculation approaches
5d EEM QSPR model employing Svob2007 chal2 EEM parameters:
Complete set:
R2 RMSE s F Number of molecules
0.920 0.629 0.647 269 74
Cross-validation:
Cross- Training set Test set
validation Number of Number of
step R2 RMSE s F molecules R2 RMSE s F molecules
1 0.9283 0.5211 0.5498 137 59 0.9202 1.0754 1.3884 21 15
2 0.9210 0.6538 0.6899 124 59 0.9029 0.5394 0.6963 17 15
3 0.9191 0.6442 0.6796 120 59 0.9275 0.5823 0.7517 23 15
4 0.9207 0.6244 0.6588 123 59 0.9271 0.6878 0.8880 23 15
5 0.9274 0.6302 0.6643 138 60 0.9008 0.6678 0.8834 15 14
5d EEM QSPR model employing Ouy2009 elemF EEM parameters: Complete set:
R2 RMSE s F Number of molecules
0.8866 0.7501 0.7825 106 74
Cross-validation:
Cross- Training set Test set
validation Number of Number of
step R2 RMSE s F molecules R2 RMSE s F molecules
1 0.8936 0.6349 0.6698 89 59 0.8704 1.2857 1.6598 12 15
2 0.8953 0.7526 0.7940 91 59 0.8018 0.7802 1.0072 7 15
3 0.8908 0.7481 0.7893 86 59 0.8647 0.7983 1.0306 12 15
4 0.8821 0.7614 0.8033 79 59 0.9154 0.7481 0.9658 19 15
5 0.8956 0.7557 0.7966 93 60 0.8089 0.8396 1.1107 7 14
charges) were previously published by Gross and Seybold [22], Kreye and Seybold [23] and Svobodova and Geidl [24]. Table 5 shows a comparison between these mod-els and the modmod-els developed in this study. Our work is the first which presents QSPR models for pKaprediction based on EEM charges. Therefore, we can not provide a comparison between EEM QSPR models, but we can compare against QSPR models based on QM charges only. It is seen therein that our 3d QM QSPR models show markedly higherR2 andF values than the models pub-lished by Gross and Seybold and Kreye and Seybold (even if some of these models employ higher basis sets) and comparableR2andFvalues as models published by Svo-bodova and Geidl. Moreover, our 5d QM QSPR models outperform the models from Svobodova and Geidl. Our best EEM QSPR models (i.e., 5d EEM QSPR models) pro-vide even better results than QM QSPR models from Gross and Seybold and Kreye and Seybold. These EEM QSPR models are not as accurate as the QM QSPR mod-els published by Svobodova and Geidl or those developed
in this work, but the loss of accuracy is not too high (R2
values are still>0.91).
Cross-validation
Our results show that 5d EEM QSPR models provide a fast and accurate approach for pKaprediction. Nonethe-less, the robustness of these models should be proved. Therefore, all the 5d EEM QSPR models (i.e., 18 models) were tested by cross-validation. For comparison, also the cross-validation of all 5d QM QSPR models (i.e., 8 mod-els) was done. Thek-fold cross-validation procedure was used [64,65], wherek = 5. Specifically, the set of phe-nol molecules was divided into five parts (each contained 20% of the molecules). The division was done randomly, and included stratification by pKavalue. Afterwards, five
QM theory level PA EEM parameter R2 of QSPR model
+ basis set set name 7d EEM 7d QM
HF/STO-3G MPA Svob2007 cbeg2 0.8831 0.9327
Svob2007 cmet2 0.8810
Svob2007 chal2 0.8822
Svob2007 hm2 0.8793
Baek1991 0.9211
Mort1986 0.9176
B3LY P/6-31G* MPA Chaves2006 0.9238 0.9059
Bult2002 mul 0.9248
NPA Ouy2009 0.8825 0.9169
Ouy2009 elem 0.8777
Ouy2009 elemF 0.8478
Bult2002 npa 0.9094
Legend very good good satisfactory acceptable weak R2 0.92 – 0.95 0.91 – 0.92 0.9 – 0.91 0.85 – 0.9 0.8 – 0.85
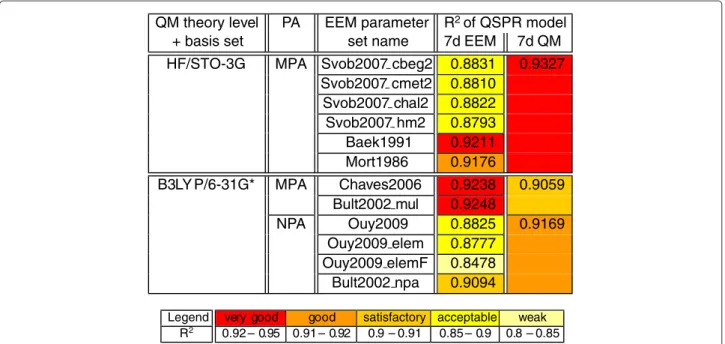
Figure 3Correlation between calculated and experimental pKafor carboxylic acids.
one part as a test set, while the remaining parts served as a training set. For each step, the QSPR model was param-eterized on the training set. Afterwards, the pKa values of the respective test molecules were calculated via this model, and compared with experimental pKavalues. The results are summarized in the (Additional file 7: Table S4), while the cross-validation results for the best and the worst performing 5d EEM QSPR models are shown in Table 6. The cross-validation showed that the models are stable and the values ofR2and RMSE are similar for the test set, the training set and the complete set. The robust-ness of EEM QSPR models and QM QSPR models is comparable.
Case study for carboxylic acids
We have shown that QSPR models based on EEM atomic charges can be used for predicting pKa in phenols. In
order to evaluate the general applicability of this approach for pKa prediction, we tested the performance of such models for carboxylic acids. This case study is done for the charge schemes found to provide the best QM and EEM QSPR models in the case of phenols. Specifically, QM charges calculated by HF/STO-3G/MPA, B3LYP/6– 31G*/MPA and B3LYP/6–31G*/NPA, and EEM charges calculated using the corresponding EEM parameters. Because 5d QSPR models provide the most accurate pre-diction for phenols, the case study is focused on their ana-logue for carboxylic acids, i.e., 7d QSPR models. Squared Pearson correlation coefficients of the analysed QSPR models are summarized in Figure 3, and all the quality and statistical criteria can be found in (Additional file 8:
Table S5). The results show that 7d EEM QSPR models are able to predict the pKaof carboxylic acids with very good
accuracy. Namely, 5 out of 12 analysed 7d EEM QSPR models were able to predict pKawithR2> 0.9, while the best EEM QSPR model reachedR2=0.925. Therefore, we concluded that EEM QSPR models are indeed applicable also for carboxylic acids. Again QM QSPR models per-form better than EEM QSPR models, but the differences are not substantial.
Conclusions
We found that the QSPR models employing EEM charges can be a suitable approach for pKaprediction. From our
54 EEM QSPR models focused on phenols, 63% show a correlation ofR2>0.9 between the experimental and pre-dicted pKa. The most successful type of these EEM QSPR
As expected, the QM QSPR models provided more accurate pKa predictions than the EEM QSPR mod-els. Nevertheless, these differences are not substantial. Furthermore, a big advantage of EEM QSPR models is that one can calculate the EEM charges markedly faster than the QM charges. Moreover, the EEM QSPR models are not so strongly influenced by the charge calcula-tion approach as the QM QSPR models are. Specifi-cally, the QM QSPR models which use atomic charges obtained from calculations with higher basis set per-form better, while the EEM QSPR models do not show such marked differences. Similarly, the quality of QM QSPR models depends a lot on population analysis, but EEM QSPR models are not influenced so much. Namely, QM QSPR models which use atomic charges cal-culated from MPA, NPA and Hirshfeld PA performed very well, while MK provides only weak models. In the case of EEM QSPR models, MPA performs also the best, but all other PAs (including MK) provide accu-rate results as well. The source of the EEM parameters also did not affect the quality of the EEM QSPR models significantly.
The robustness of EEM QSPR models was successfully confirmed by cross-validation. Specifically, the accuracy of pKa prediction for the test, training and complete
set were comparable. The applicability of EEM QSPR models for other chemical classes was tested in a case study focused on carboxylic acids. This case study showed that EEM QSPR models are indeed applicable for pKa prediction also for carboxylic acids. Namely, 5 from 12 of these models were able to predict pKa
withR2>0.9, while the best EEM QSPR model reached
R2=0.925.
Therefore, EEM QSPR models constitute a very promis-ing approach for the prediction of pKa. Their main
advan-tages are that they are accurate, and can predict pKavalues
very quickly, since the atomic charge descriptors used in the QSPR model can be obtained much faster by EEM than by QM. Additionally, the quality of EEM QSPR mod-els is less dependent on the type of atomic charges used (theory level, basis set, population analysis) than in the case of QM QSPR models. Accordingly, EEM QSPR mod-els constitute a pKa prediction approach which is very
suitable for virtual screening.
Additional files
Additional file 1: Table S1a.The list of the phenol molecules, including their names, NCS numbers, CAS numbers and experimental pKavalues. Additional file 2: Molecules.The SDF files with the structures of the molecules and also their dissociated forms.
Additional file 3: Table S1b.The list of the carboxylic acid molecules, including their names, NCS numbers, CAS numbers and experimental pKavalues.
Additional file 4: Table S2.The parameters of all the QSPR models for phenols.
Additional file 5: Table S6.The table containing charge descriptors for all charge calculation approaches and predicted pKavalues for all QSPR models (for phenols).
Additional file 6: Table S3.The information about outlier molecules for phenols.
Additional file 7: Table S4.The table of cross-validation results for phenols.
Additional file 8: Table S5.The quality and statistical criteria of QSPR models for carboxylic acids.
Abbreviations
3d: 3 descriptors; 4d: 4 descriptors; 5d: 5 descriptors; 7d: 7 descriptors; AIM: Atoms in Molecules; ANN: Artificial Neural Networks; B3LYP: Becke, three-parameter, Lee-Yang-Parr; DENR: Dynamic Electronegativity Relaxation; EEM: Electronegativity Equalization Method; GDAC: Geometry-Dependent Atomic Charge; HF: Hartree-Fock; KCM: Kirchhoff Charge Model; LFER: Linear Free Energy Relationships; MK: Merz-Singh-Kollman; MLR: Multiple Linear Regression; MP2: Møller-Plesset Perturbation Theory; MPA: Mulliken Population Analysis; NPA: Natural Population Analysis; PA: Population Analysis; PEOE: Partial Equalization of Orbital Electronegativity; QEq: Charge Equilibration; QM: Quantum Mechanical; QSPR: Quantitative Structure-Property Relationship; RMSE: Root Mean Square Error; SQE: Split Charge Equilibration; TSEF: Topologically Symmetric Energy Function; WO: Without Outliers.
Competing interests
The authors declare that they have no competing interests.
Author’s contributions
The concept of the study originated from JK and was reviewed and extended by RA, while the design was put together by RSV and SG and reviewed by JK and RA. SG and CMI collected and prepared the input data. SG, OS, DS and TB performed the acquisition and post-processing of data. The data were analyzed and interpreted by RSV, SG, CMI and JK. The manuscript was written by RSV and SG in cooperation with JK and CMI, and reviewed by all authors.
Authors’ information
Radka Svobodov´a Vaˇrekov´a and Stanislav Geidl wish it to be known that, in their opinion, the first two authors should be regarded as joint First Authors.
Acknowledgements
This work was supported by the Ministry of Education of the Czech Republic (LH13055), by the European Community’s Seventh Framework Programme (CZ.1.05/1.1.00/02.0068 to J.K. and R.S.V.) from the European Regional Development Fund and by the EU Seventh Framework Programme under the “Capacities” specific programme (Contract No. 286154 to J.K.). C.M.I. and D.S. would like to thank Brno City Municipality for the financial support provided to them through the program Brno Ph.D. Talent. This work was also supported in part by NIH grants R01 GM071872, U01 GM094612, and U54 GM094618 to R.A.. The access to computing and storage facilities owned by parties and projects contributing to the National Grid Infrastructure MetaCentrum, provided under the programme “Projects of Large Infrastructure for Research, Development, and Innovations” (LM2010005) is highly appreciated. Also the access to the CERIT-SC computing facilities provided under the programme Center CERIT Scientific Cloud, part of the Operational Program Research and Development for Innovations, reg. no. CZ. 1.05/3.2.00/08.0144 is acknowledged.
Author details
1National Centre for Biomolecular Research, Faculty of Science and CEITEC
Received: 16 November 2012 Accepted: 27 March 2013 Published: 10 April 2013
References
1. Ishihama Y, Nakamura M, Miwa T, Kajima T, Asakawa N:A rapid method for pKadetermination of drugs using pressure-assisted capillary
electrophoresis with photodiode array detection in drug discovery.
J Pharm Sci2002,91(4):933–942.
2. Babi´c S, Horvat A J, Pavlovi´c D M, Kaˇstelan-Macan M:Determination of pKavalues of active pharmaceutical ingredients.TrAC2007,
26(11):1043–1061.
3. Manallack D:The pKadistribution of drugs: application to drug
discovery.Perspect Med Chem2007,1:25–38.
4. Wan H, Ulander J:High-throughput pKascreening and prediction
amenable for ADME profiling.Expert Opin Drug Metabx Toxicol2006, 2:139–155.
5. Cruciani G, Milletti F, Storchi L, Sforna G, Goracci L:In silico pKa
prediction and ADME profiling.Chem Biodivers2009,6(11): 1812–1821.
6. Comer J, Tam K:Pharmacokinetic Optimization in Drug Research: Biological,
Physicochemical, and Computational Strategies. Switzerland: Wiley-VCH.
Verlag Helvetica Chimica Acta, Postfach, CH-8042 Z ¨urich; 2001. 7. Klebe G:Recent developments in structure-based drug design.
J Mol Med2000,78:269–281.
8. Lee AC, Crippen GM:Predicting pKa.J Chem Inf Model2009,
49:2013–2033.
9. Rupp M, K ¨orner R, Tetko IV:Predicting the pKaof small molecules.
Comb Chem High Throughput Screen2010,14(5):307–327.
10. Fraczkiewicz R:In Silico Prediction of Ionization, Volume 5. Oxford: Elsevier; 2006.
11. Ho J, Coote M:A universal approach for continuum solvent pKa calculations: Are we there yet?Theor Chim Acta2010,125(1–2): 3–21.
12. Clark J, Perrin DD:Prediction of the strengths of organic bases.
Q ReV Chem Soc1964,18:295–320.
13. Perrin DD, Dempsey B, Serjeant EP:pKaPrediction for Organic Acids and
Bases. New York: Chapman and Hall; 1981.
14. Blower PE, Cross KP:Decision tree methods in pharmaceutical research.Curr Top Med Chem2006,6:31–39.
15. Liptak MD, Gross KC, Seybold PG, Feldgus S, Shields G:Absolute pKa
determinations for substituted phenols.J Am Chem Soc2002, 124:6421–6427.
16. Toth AM, Liptak MD, Phillips DL, Shields GC:Accurate relative pKa
calculations for carboxylic acids using complete basis set and Gaussian-n models combined with continuum solvation methods.
J Chem Phys2001,114:4595–4606.
17. Hagan MT, Demuth HB, Beale M:In Neural, Network Design. Boston: PWS, MA; 1996.
18. Jelfs S, Ertl P, Selzer P:Estimation of pKafor druglike compounds
using semiempirical and information-based descriptors.J Chem Inf
Model2007,47:450–459.
19. Dixon SL, Jurs PC:Estimation of pKafor organic oxyacids using
calculated atomic charges.J Comput Chem1993,14:1460–1467. 20. Zhang J, Klein ¨oder T, Gasteiger J:Prediction of pKavalues for aliphatic
carboxylic acids and alcohols with empirical atomic charge descriptors.J Chem Inf Model2006,46:2256–2266.
21. Citra MJ:Estimating the pKaof phenols, carboxylic acids and
alcohols from semi-empirical quantum chemical methods.
Chemosphere1999,1:191–206.
22. Gross KC, Seybold PG, Hadad CM:Comparison of different atomic charge schemes for predicting pKavariations in substituted
anilines and phenols.Int J Quantum Chem2002,90:445–458. 23. Kreye WC, Seybold PG:Correlations between quantum chemical
indices and the pKas of a diverse set of organic phenols.Int J
Quantum Chem2009,109:3679–3684.
24. Svobodov´a Vaˇrekov´a R, Geidl S, Ionescu CM, Skˇrehota O, Kudera M, Sehnal D, Bouchal T, Abagyan R, Huber HJ, Koˇca J:Predicting pKavalues
of substituted phenols from atomic charges: Comparison of different quantum mechanical methods and charge distribution schemes.J Chem Inf Model2011,51(8):1795–1806.
25. Mulliken RS:Electronic structures of molecules XI. Electroaffinity, molecular orbitals and dipole moments.J Chem Phys1935, 3(9):573–585.
26. Mulliken RS:Criteria for construction of good self-consistent-field molecular orbital wave functions, and significance of LCAO-MO population analysis.J Chem Phys1962,36(12):3428–3439.
27. Lowdin PO:On the non-orthogonality problem connected with the use of atomic wave functions in the theory of molecules and crystals.J Chem Phys1950,18(3):365–375.
28. Reed AE, Weinstock RB, Weinhold F:Natural-population analysis.
J Chem Phys1985,83(2):735–746.
29. Bader RFW, Larouche A, Gatti C, Carroll MT, Macdougall PJ, Wiberg KB: Properties of atoms in molecules - dipole-moments and transferability of properties.J Chem Phys1987,87(2):1142–1152. 30. Hirshfeld FL:Bonded-atom fragments for describing molecular
charge-densities.Theor Chim Acta1977,44(2):129–138.
31. Breneman CM, Wiberg KB:Determining atom-centered monopoles from molecular electrostatic potentials - the need for high sampling density in formamide conformational-analysis.J Comput Chem1990, 11(3):361–373.
32. Besler BH, Merz KM, Kollman PA:Atomic charges derived from semiempirical methods.J Comput Chem1990,11(4):431–439. 33. Kelly CP, Cramer CJ, Truhlar DG:Accurate partial atomic charges for
high-energy molecules using class IV charge models with the MIDI! basis set.Theor Chem Acc2005,113(3):133–151.
34. Abraham RJ, Griffiths L, Loftus P:Approaches to charge calculations in molecular mechanics.J Comput Chem1982,3(3):407–416.
35. Gasteiger J, Marsili M:Iterative partial equalization of orbital electronegativity - a rapid access to atomic charges.Tetrahedron
1980,36(22):3219–3228.
36. Cho KH, Kang YK, No KT, Scheraga HA:A fast method for calculating geometry-dependent net atomic charges for polypeptides.J Phys
Chem B2001,105(17):3624–3634.
37. Oliferenko AA, Pisarev SA, Palyulin VA, Zefirov NS:Atomic charges via electronegativity equalization: Generalizations and perspectives.
Adv Quantum Chem2006,51:139–156.
38. Shulga DA, Oliferenko AA, Pisarev SA, Palyulin VA, Zefirov NS: Parameterization of empirical schemes of partial atomic charge calculation for reproducing the molecular electrostatic potential.
Dokl Chem2008,419:57–61.
39. Mortier WJ, Ghosh SK, Shankar S:Electronegativity equalization method for the calculation of atomic charges in molecules.J Am
Chem Soc1986,108:4315–4320.
40. Rappe AK, Goddard WA:Charge equilibration for molecular-dynamics simulations.J Phys Chem1991,95(8):3358–3363.
41. Nistor RA, Polihronov JG, Muser MH, Mosey NJ:A generalization of the charge equilibration method for nonmetallic materials.J Chem Phys
2006,125(9):094108–094118.
42. Czodrowski P, Dramburg I, Sotriffer CA, Klebe G:Development, validation, and application of adapted PEOE charges to estimate pKavalues of functional groups in protein–ligand complexes.
Proteins Struct Funct Bioinf2006,65:424–437.
43. Gieleciak R, Polanski J:Modeling robust QSAR. 2. Iterative variable elimination schemes for CoMSA: Application for modeling benzoic acid pKavalues.J Chem Inf Model2007,47:547–556.
44. Svobodov´a Vaˇrekov´a R, Jirouˇskov´a Z, Vanˇek J, Suchomel S, Koˇca J: Electronegativity equalization method: Parameterization and validation for large sets of organic, organohalogene and organometal molecule.Int J Mol Sci2007,8:572–582.
45. Baekelandt BG, Mortier WJ, Lievens JL, Schoonheydt RA:Probing the reactivity of different sites within a molecule or solid by direct computation of molecular sensitivities via an extension of the electronegativity equalization method.J Am Chem Soc1991, 113(18):6730–6734.
46. Jirouˇskov´a Z, Svobodov´a Vaˇrekov´a R, Vanˇek J, Koˇca J:Electronegativity equalization method: Parameterization and validation for organic molecules using the Merz–Kollman–Singh charge distribution scheme.J Comput Chem2009,30:1174–1178.
48. Bultinck P, Langenaeker W, Lahorte P, De Proft, F, Geerlings P, Waroquier M, Tollenaere J:The electronegativity equalization method I: Parametrization and validation for atomic charge calculations.
J Phys Chem A2002,106(34):7887–7894.
49. Ouyang Y, Ye F, Liang Y:A modified electronegativity equalization method for fast and accurate calculation of atomic charges in large biological molecules.Phys Chem2009,11:6082–6089.
50. Bultinck P, Vanholme R, Popelier PLA, De Proft, F, Geerlings P:High-speed calculation of AIM charges through the electronegativity
equalization method.J Phys Chem A2004,108(46):10359–10366. 51. Yang ZZ, Wang CS:Atom-bond electronegativity equalization
method. 1. Calculation of the charge distribution in large molecules.
J Phys Chem A1997,101:6315–6321.
52. Menegon G, Loos M, Chaimovich H:Parameterization of the electronegativity equalization method based on the charge model
1.J Phys Chem A2002,106:9078–9084.
53. Svobodov´a Vaˇrekov´a R, Koˇca J:Optimized and parallelized implementation of the electronegativity equalization method and the atom-bond electronegativity equalization method.J Comput Chem2006,3:396–405.
54. Frisch MJ, Trucks GW, Schlegel HB, Scuseria GE, Robb MA, Cheeseman JR, Montgomery JAJr, Vreven T, Kudin KN, Burant JC, Millam JM, Iyengar SS, Tomasi J, Barone V, Mennucci B, Cossi M, Scalmani G, Rega N, Petersson GA, Nakatsuji H, Hada M, Ehara M, Toyota K, Fukuda R, Hasegawa J, Ishida M, Nakajima T, Honda Y, Kitao O, Nakai H, et al.:Gaussian 09, Revision E.01. Wallingford: Gaussian, Inc.; 2004.
55. Keith TA:AIMAll, Version 11.12.19. USA: TK Gristmill Software, Overland Park KS; 2011. [aim.tkgristmill.com].
56. Habibi-Yangjeh A, Danandeh-Jenagharad M, Nooshyar M:Application of artificial neural networks for predicting the aqueous acidity of various phenols using QSAR.J Mol Model2006,12:338–347. 57. Hanai T, Koizumi K, Kinoshita T, Arora R, Ahmed F:Prediction of pKa
values of phenolic and nitrogen-containing compounds by computational chemical analysis compared to those measured by liquid chromatography.J Chromatogr A1997,762:55–61.
58. Tehan BG, Lloyd EJ, Wong MG, Pitt WR, Montana JG, Manallack DT, Gancia E:Estimation of pKaUsing semiempirical molecular orbital
methods. Part 1: Application to phenols and carboxylic acids.Quant
Struct-Act Relat2002,21:457–472.
59. NCI Open Database Compounds.Retrieved from [http://cactus.nci.nih. gov/] on August 10, 2010.
60. Sadowski J, Gasteiger J:From atoms and bonds to three-dimensional atomic coordinates: Automatic model builders.Chem ReV1993, 93:2567–2581.
61. Howard P, Meylan W:Physical/Chemical Property Database (PHYSPROP). North Syracuse NY: Syracuse Research Corporation, Environmental Science Center; 1999.
62. Skˇrehota O, Svobodov´a Vaˇrekov´a R, Geidl S, Kudera M, Sehnal D, Ionescu CM, Koˇca J:QSPR designer – a program to design and evaluate QSPR models. Case study on pKaprediction.J Cheminf2011,3(Suppl 1):P16. 63. Bultinck P, Langenaeker W, Lahorte P, De Proft, F, Geerlings P, Van
Alsenoy, C, Tollenaere JP:The electronegativity equalization method II: Applicability of different atomic charge schemes.J Phys Chem A
2002,106(34):7895–7901.
64. Lemm S, Blankertz B, Dickhaus T, M ¨uller KR:Introduction to machine learning for brain imaging.NeuroImage2011,56(2):387–399. 65. Organisation for Economic Co-operation and Development:Guidance
Document on the Validation of (Quantitative)Structure-Activity Relationships
[(Q)SAR] Models. Paris: OECD; 2007. [http://search.oecd.org/
officialdocuments/displaydocumentpdf/?cote=env/jm/ mono(2007)2&doclanguage=en] (accessed April 6,2013).
doi:10.1186/1758-2946-5-18
Cite this article as:Svobodov´a Vaˇrekov´aet al.:Predicting pKavalues from
EEM atomic charges.Journal of Cheminformatics20135:18.
Open access provides opportunities to our colleagues in other parts of the globe, by allowing
anyone to view the content free of charge.
Publish with
Chemistry
Central and every
scientist can read your work free of charge
W. Jeffery Hurst, The Hershey Company. available free of charge to the entire scientific community peer reviewed and published immediately upon acceptance cited in PubMed and archived on PubMed Central yours you keep the copyright
Submit your manuscript here: