A texture feature extraction of crop field images using GLCM approach
SushilaShidnal
Assistant Professor SMVIT, Bangalore
Abstract
To capture visual content of images for retrieval, feature extraction is one of the method. In this paper feature extraction is done using GLCM (Gray Level Co-occurrence Matrix). In this work 6 varieties of crop images are considered namely paddy, maize, cotton, groundnut, sugarcane and sunflower. There are many second order statistical texture features extracted using GLCM namely autocorrelation, entropy, cluster prominence etc. The four features namely autocorrelation, sum of squares of variance, sum of variance and sum of average are found to be predominant features for the present study. Considering texture as a feature, the average accuracy of 63.75% is obtained. The results show that these texture features are efficient and can be used for real time pattern recognition.
Keywords: Field images, GLCM, Features, Pattern recognition
Introduction Image acquisition
The field image of paddy, cotton, maize, groundnut, sugarcane, sunflower are captured using sony digital camera .The images are captured with fixed focal length and under standard illumination.A total of 60 images of 6 varieties are considered for experimental study.
Some of the sample images are as shown in fig 1.
Fig.1. Images of paddy and maize
Preprocessing
The field images captured are basically 3500*4500 pixels. Certain preprocessing activities like resizing is done to all the 60 images and are resized to 512*512
pixels .The images are then filtered using median filter.
Feature extraction
From the study and literature survey, we found that feature extraction technique used are texture, color, shape and many more. In the proposed work feature extraction is done considering texture features. Gray level Co-occurrence Matrix (GLCM)
Visual system of human beings use second order distribution of gray levels as discriminator in identifying textures. Some of the characteristics of texture are autocorrelation, cluster prominence, entropy, contrast and others. GLCM is very useful to obtain valuable information about the relative position of the neighboring pixels in an image. The occurrence matrix GLCM (i,j) counts the co-occurrence of pixels with gray value i and j at given distance d.The matrix element P(i,j) is separated from its neighborhood by a pixel distance (∆ , ∆ ), one with intensity I and the other with intensity j. Number of gray levels is denoted by G. is the mean value of P.μ andμ are the means and standard deviations of Px and Py. The direction of neighboring pixels to represents the distance can be selected, for example 135o, 90o, 45o, or 0o, as illustrated in Figure 2.
Fig 2 Directions in calculating GLCM
Results and discussion
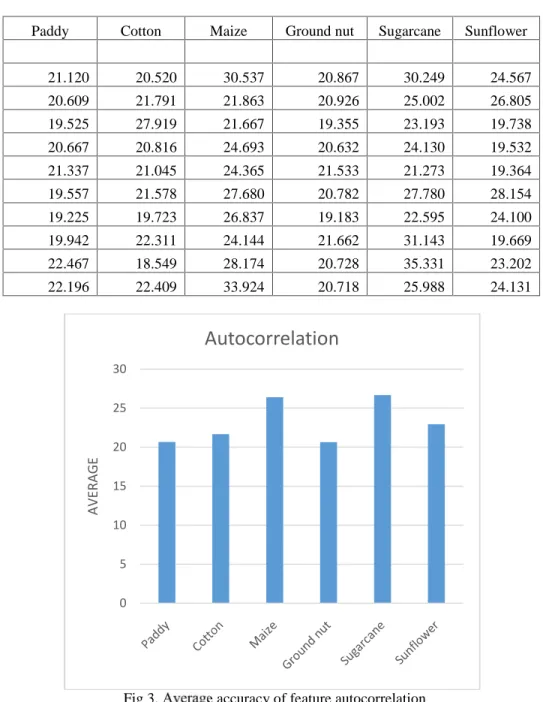
squares of variance, sum of variance and sum of average. Repeating patterns like presence of periodic signal obscured by noise is called as autocorrelation and is given by equation (1).The autocorrelation values for the different varieties of field images are
given in Table 1.Considering the tabular values the average accuracy of the extracted feature autocorrelation is as shown in the Fig.3.
Autocorrelation=∑ ∑ ( ). ( , ) … (1)
Table1Autocorrelation feature values for different field images
Paddy Cotton Maize Ground nut Sugarcane Sunflower
21.120 20.520 30.537 20.867 30.249 24.567
20.609 21.791 21.863 20.926 25.002 26.805
19.525 27.919 21.667 19.355 23.193 19.738
20.667 20.816 24.693 20.632 24.130 19.532
21.337 21.045 24.365 21.533 21.273 19.364
19.557 21.578 27.680 20.782 27.780 28.154
19.225 19.723 26.837 19.183 22.595 24.100
19.942 22.311 24.144 21.662 31.143 19.669
22.467 18.549 28.174 20.728 35.331 23.202
22.196 22.409 33.924 20.718 25.988 24.131
Fig 3. Average accuracy of feature autocorrelation
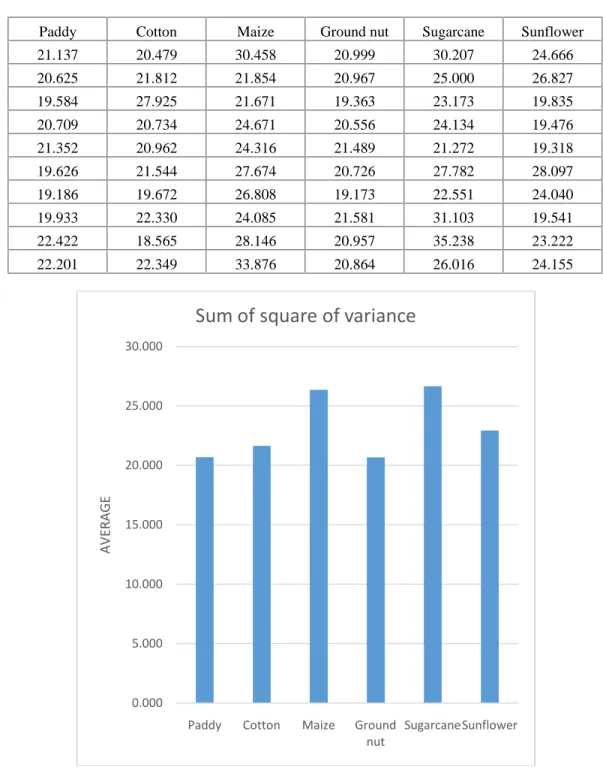
Sum of squares of variance is the sum of squared differences from the mean and is given by equation (2). Sumofsquares of variance =∑ ∑ ( − ) .P(i,j) …(2)
The values of the sum of squares of variances (sosvh) are given in Table 2.The classification accuracy for sum of squares of variance feature is as shown in the Fig4.
Table2Sum of squares of varience feature values for different field images 0
5 10 15 20 25 30
AV
ERAG
E
Paddy Cotton Maize Ground nut Sugarcane Sunflower
21.137 20.479 30.458 20.999 30.207 24.666
20.625 21.812 21.854 20.967 25.000 26.827
19.584 27.925 21.671 19.363 23.173 19.835
20.709 20.734 24.671 20.556 24.134 19.476
21.352 20.962 24.316 21.489 21.272 19.318
19.626 21.544 27.674 20.726 27.782 28.097
19.186 19.672 26.808 19.173 22.551 24.040
19.933 22.330 24.085 21.581 31.103 19.541
22.422 18.565 28.146 20.957 35.238 23.222
22.201 22.349 33.876 20.864 26.016 24.155
Fig 4. Average accuracy of feature Sum of square of varience
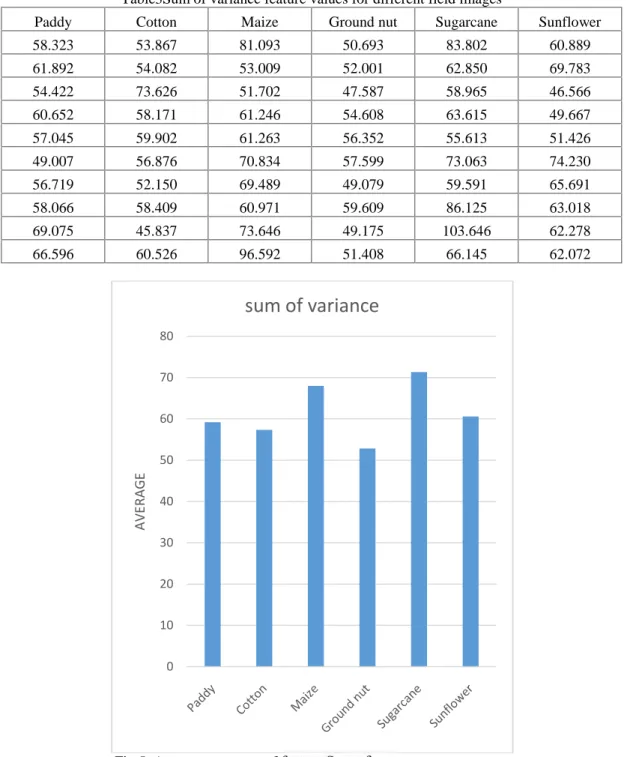
Variance is a measure of the dispersion of the values around the mean and combinations of reference and neighbor pixels. The extracted feature Sum of variance is given by equation (3).
Sum of variance=∑ (1 − ) . P(i,j) … (3)
The values of sum of variance feature (svarh) are given in Table 3. The average accuracy for sum of variance feature is given in Fig.5.
0.000 5.000 10.000 15.000 20.000 25.000 30.000
Paddy Cotton Maize Ground
nut SugarcaneSunflower
AV
ERAG
E
Table3Sum of variance feature values for different field images
Paddy Cotton Maize Ground nut Sugarcane Sunflower
58.323 53.867 81.093 50.693 83.802 60.889
61.892 54.082 53.009 52.001 62.850 69.783
54.422 73.626 51.702 47.587 58.965 46.566
60.652 58.171 61.246 54.608 63.615 49.667
57.045 59.902 61.263 56.352 55.613 51.426
49.007 56.876 70.834 57.599 73.063 74.230
56.719 52.150 69.489 49.079 59.591 65.691
58.066 58.409 60.971 59.609 86.125 63.018
69.075 45.837 73.646 49.175 103.646 62.278
66.596 60.526 96.592 51.408 66.145 62.072
Fig 5. Average accuracy of feature Sum of average
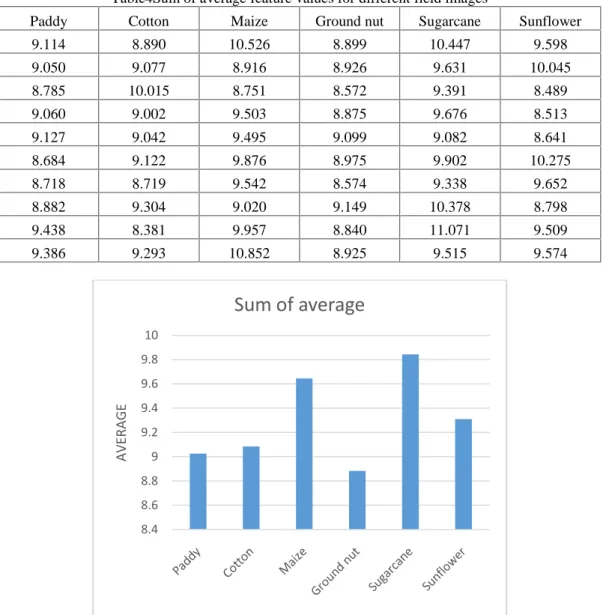
Sum of average is the sum of all values and divided by the total number of values and is given by the equation (4). Sum of average (Mean)=∑ ∑ ( , ) … (4)
The texture features extracted out of the above mentioned feature is given in Table 4. The average accuracy for the sum of average feature is given Fig.6.
0 10 20 30 40 50 60 70 80
AV
ERAG
E
Table4Sum of average feature values for different field images
Paddy Cotton Maize Ground nut Sugarcane Sunflower
9.114 8.890 10.526 8.899 10.447 9.598
9.050 9.077 8.916 8.926 9.631 10.045
8.785 10.015 8.751 8.572 9.391 8.489
9.060 9.002 9.503 8.875 9.676 8.513
9.127 9.042 9.495 9.099 9.082 8.641
8.684 9.122 9.876 8.975 9.902 10.275
8.718 8.719 9.542 8.574 9.338 9.652
8.882 9.304 9.020 9.149 10.378 8.798
9.438 8.381 9.957 8.840 11.071 9.509
9.386 9.293 10.852 8.925 9.515 9.574
Fig 6. Average accuracy of Sum of average Conclusion:
The work has reported an average accuracy of 63.75% with field images of 6 different types of crops. The texture features are deployed using GLCM algorithm. As an enhancement of the present work texture features can be combined with other features like color or vein and the average accuracy can be increased.This work finds its application in technology deployment in agriculture.
References:
1. Jie-Sheng Wang Xiu-Dong Ren”GLCM Based Extraction of Flame Image Texture Features and KPCA-GLVQ Recognition Method for Rotary Kiln Combustion
Working Conditions” International Journal of Automation and Computing 11(1), February 2014, 72-77
2. Hermawan Syahputra, Agus Harjoko, Retantyo Wardoyo and Reza Pulungan
“Plant recognition using sterio leaf image
using gray level co occurrence matrix”,
Journal of Computer Science 10 (4): 697-704, 2014.
3. AndrikRampun, Harry Strange, ReyerZwiggelaar “Texture Segmentation Using Different Orientations ofGLCM Features “2013 ACM 978-1-4503-2023-8/13/06
4. P. Mohanaiah, P. Satyanarayana, L.Gurukumar “Image texture feature
8.4 8.6 8.8 9 9.2 9.4 9.6 9.8 10
AV
ERAG
E
extraction using GLCM approach.” IJSRP,
Volume 3, Issue 5, may 2013
5. M. Madhu, R. Amutha ” Face Recognition
using Gray level Co-occurrence Matrix and Snap Shot Method of the Eigen
Face”International Journal of Engineering and Innovative Technology (IJEIT) Volume 2, Issue 6, December 2012 48 2
6. Ahmed Naser Hussein, SyamsiahMashohor,
M. Iqbal Saripan “A Texture-Based Approach for Content Based Image
Retrieval System for Plant Leaves Images”
2011 IEEE 7th International Colloquium on Signal Processing and its Applications. 7. Abdul Kadir, Lukito Edi Nugroho, Adhi
Susanto, Paulus Insap Santosa, “Leaf
Classification Using Shape, Color, and
Texture Features”, International Journal of
Computer Trends and Technology- July to Aug Issue 2011, page 225-230.
8. Haipeng Yu, Jun Cao, Wei Luo and Yixing
Liu,” Image Retrieval of Wood Species by Color, Texture, and Spatial”, IEEE,
International Conference on Information and Automation, June 22 -25, 2009.
9. R. Pydipati, T.F. Burks ∗, W.S. Lee
“Identification of citrus disease using color
texture features and discriminant analysis”