PREFERENTIAL TRADE AGREEMENTS AND FIRMS’ MARKET ENTRY MODE
DECISIONS
Kai A. Stern
A thesis submitted to the faculty of the University of North Carolina at Chapel Hill in partial
fulfillment for the degree of Master of Arts in the Department of Political Science, Concentration
in International Relations.
Chapel Hill
2018
Approved by:
Layna Mosley
©2018
Kai A. Stern
ABSTRACT
KAI A. STERN: Preferential Trade Agreements and Firms’ Market-Entry Mode Decisions
(Under the direction of Layna Mosley.)
TABLE OF CONTENTS
LIST OF TABLES . . . .
v
LIST OF FIGURES . . . vii
INTRODUCTION . . . .
1
Firms’ Entries into Foreign Markets . . . .
2
Preferential Trade Agreements as Risk Mitigators . . . .
5
Sectoral Patterns in Market-Entry Modes . . . .
7
Hypotheses . . . .
8
Data . . . 10
Method and Model . . . 13
Results . . . 14
Implications and Limitations . . . 36
Conclusion . . . 38
APPENDIX . . . 40
LIST OF TABLES
Table
1 Market-Entry Modes by SIC Division . . . 15
2 Market-Entry Modes by Major Manufacturing Group . . . 16
3 Market-Entry Modes by Major Services Group . . . 17
4 Top 20 Countries, by Total Transactions . . . 18
5 Aggregate Estimates (Random Intercepts by Country, 1-Year Lags) . . . . 20
6 Aggregate Estimates (Random Intercepts by Country, 3-Year Lags) . . . . 21
7 Aggregate Estimates (Random Intercepts by Country and Industry) . . . . 22
8 Effects of Sanitary and Phytosanitary Chapters . . . 25
9 Effects of Sanitary and Phytosanitary Chapters . . . 26
10 Effects of Services Chapters . . . 27
11 Effects of Services Chapters . . . 28
12 Effects of Services Chapters’ Depth . . . 30
13 Effects of Services Chapters’ Depth . . . 31
14 Countries in Sample . . . 40
15 Summary Statistics, Based on No Lags . . . 42
16 Correlation Matrix of Independent Variables, Based on No Lags . . . 43
17 Aggregate Estimates (Random Intercepts by Country, 5-Year Lags) . . . . 48
18 Aggregate Estimates (Random Intercepts by Country, Excluding China) . . 49
19 Effects of Additional Variables . . . 50
20 Aggregate Estimates (Random Intercepts by Country, Year Dummies) . . . 51
21 Effects of Services Chapters and Depth (Year Dummies) . . . 52
22 Effects of Alternate Sanitary and Phytosanitary Measure . . . 53
23 Effects of Alternate Sanitary and Phytosanitary Measure . . . 54
LIST OF FIGURES
Figure
1 Transactions Over Time . . . 18
2 Marginal Effects Plots . . . 32
3 Transactions in Sectors Over Time . . . 44
4 Transactions in Sectors Over Time . . . 45
5 Transactions in Sectors Over Time . . . 46
6 Simple Model (Country Fixed Effects, 1-Year Lags) . . . 47
7 Full Model (Country Fixed Effects, 1-Year Lags) . . . 47
8 Simple Model (Country Fixed Effects, 3-Year Lags) . . . 51
9 Full Model (Country Fixed Effects, 3-Year Lags) . . . 51
10 Simple Model (Country Fixed Effects, 5-Year Lags) . . . 57
INTRODUCTION
How do international institutions affect cross-border economic exchanges?
Interna-tional institutions’ economic impact, in particular on trade (e.g. Goldstein, Rivers and Tomz
2007) and foreign direct investment (FDI) (e.g. B¨uthe and Milner 2008; Medvedev 2012),
has been the subject of numerous analyses. While most work has focused on identifying the
effects of membership in the WTO (e.g. Goldstein, Rivers and Tomz 2007) or in other
re-gional trade agreements (e.g. Baier and Bergstrand 2007; Carr`ere 2006) on trade flows, the
latter’s impact on FDI has also come under scrutiny (see Baltagi, Egger and Pfaffermayr
2008; Berger et al. 2013; B¨uthe and Milner 2008; B¨uthe and Milner 2014). In general,
scholars have concluded that these trade agreements – hereafter referred to as preferential
trade agreements (PTAs) – appear to increase FDI flows.
modes (i.e. greenfield investments
1or mergers and acquisitions) versus low-control modes
(i.e. joint ventures or licensing agreements) suggest PTAs could have a substantial impact
on entry mode decisions (Anderson and Gatignon 1986; Shimizu et al. 2004).
2One might
therefore expect PTAs to have heterogeneous effects on firms’ market-entry modes.
This paper attempts to fill a gap in the literature by asking the following questions: What
are the effects of PTAs on firms’ market-entry modes, and are sector-specific PTA chapters
associated with sector-level heterogeneity in these market-entry modes? I hypothesize that
PTAs signal governments’ commitments to certain policies, thereby lowering host country
risk and enabling costlier market-entry modes. When governments ratify PTAs with
sector-specific clauses, firms that seek to enter foreign markets in those sectors should take note
of those additional sector-specific commitments and utilize costlier market-entry modes. I
use firm-level transactions data on international joint ventures/cross-border alliances and
mergers and acquisitions from Thomson Reuters’ SDC Platinum to test my hypotheses on
a panel of up to 146 non-OECD countries from 1990-2017. Multilevel logistic regressions
with country random intercepts indicate that although there is a strong association between
PTAs and the likelihood of choosing costlier entry modes (i.e. mergers and acquisitions)
over lower cost entry modes (i.e. joint ventures), sector-specific PTA chapters have only a
limited sector-specific effect. More specifically, services chapters have a somewhat stronger
impact on services transactions as compared to non-services transactions, but this
relation-ship is very weak for sanitary and phytosanitary chapters and agriculture transactions.
Firms’ Entries into Foreign Markets
Firms that seek to internationalize their businesses face a set of potential strategies.
These strategies — or entry modes — can be placed on a continuum from exports to
green-field investments or seen as a set of discrete choices that nonetheless involve increasing
1Greenfield investments refers to when firms establish their foreign operations from the ground up.
levels of control, commitment, and risk (Anderson and Gatignon 1986; Pan and Tse 2000;
Raf, Ryan and St¨ahler 2012; Shimizu et al. 2004). In general, greenfield investments and
mergers and acquisitions are seen as costlier and riskier than joint ventures or alliances,
which are in turn costlier and riskier than contractual arrangements or exports (Pan and Tse
2000). Analyzing firms’ decision to invest abroad with aggregate FDI flows obscures
con-siderable variation in market-entry modes, a distinction that has been typically overlooked
in political science (but see Bauerle Danzman (2016) and Kerner and Lawrence (2014) on
bilateral investment treaties). This is a significant omission, as different types of investment
could have divergent causes and consequences (Kerner 2014; Newburry and Zeira 1997).
An analysis of the effects of PTAs on FDI can thus be fruitfully reframed as a study of
whether PTAs affect firms’ market-entry modes.
Market-entry modes reflect a variety of both firm-specific and environmental
uncer-tainties (Williamson 1985). External or environmental uncertainty refers primarily to
vari-ables in the host country environment. All else equal, as host country risks increase, firms
ought to choose relatively less costly market-entry modes (Pan and Tse 2000; Shimizu
et al. 2004).
3Market-entry modes that do not involve sunk costs, like exporting or
licens-ing agreements, are thus more likely in high-risk environments than modes that necessitate
full control and high levels of equity, like greenfield investments and mergers and
acquisi-tions (Pan and Tse 2000; Shimizu et al. 2004). As host country risk increases, firms tend
to choose market-entry modes with fewer liabilities (Anderson and Gatignon 1986; Pan
and Tse 2000; Shimizu et al. 2004). In other words, firms are more likely to enter
high-risk countries via exports or contractual arrangements than greenfield investments. Here,
I adopt the perspective that as country risk decreases, firms will be more likely to select
costlier entry modes, along the full continuum of entry mode types.
markets rather than entry modes. Entry mode research tends not to focus on this question,
although the implication is that firms have already chosen the markets they wish to enter
(Ekeledo and Sivakumar 1998; Heinsz 2000; Sakarya, Eckman and Hyllegard 2006). Those
scholars that have integrated location and entry mode work suggest the two are interrelated
processes (e.g. Strange et al. 2009). Anecdotally, in 2017 the two largest domestic South
Korean convenience store chains, BGH Retail and GS Retail, decided to internationalize to
Iran and Vietnam, respectively (World Franchise Associates 2017
a
; World Franchise
Asso-ciates 2017
b
). While they both cited growth potential in their location decisions, the former
chose to use a franchise agreement while the latter relied on a joint venture (World
Fran-chise Associates 2017
a
; World Franchise Associates 2017
b
). BGF recognizes franchising’s
risk-minimization characteristics, as they stated that, “master franchising is a method to
stably receive loyalty while minimizing risk in foreign markets” (quoted in Song 2017).
4Although intra-firm characteristics could explain entry mode choice, both companies are
from the same home country and are similarly sized. This suggests that location decisions
may not be conditional on entry mode preference.
5It is therefore reasonable to model
firms’ entry mode choice as occurring after their location decisions.
Mergers and acquisitions represent a costlier means of entering foreign markets, relative
to joint ventures and alliances, and should therefore be more common in less risky
environ-ments. Mergers and acquisitions enable “the acquiring firm to obtain its resources, such as
its knowledge base, technology, and human resources, and gain access to markets and to
key constituencies at the local level,” while maintaining control of assets, which makes it
a potentially attractive means of entering a new market when external uncertainty is
rela-tively low (Shimizu et al. 2004, 311). In contrast, when markets are characterized by a high
degree of external uncertainty, firms tend to prefer joint ventures over mergers and
acqui-sitions (Shimizu et al. 2004, 322). Indeed, in a meta-analysis of transaction cost analysis
articles, Zhao, Luo and Suh (2004) find that various measures of country risk are
associ-4South Korea has a PTA with Vietnam, but not with Iran. Vietnam also has more PTAs than Iran.
ated with increasing likelihood of selecting joint ventures. Firms should be more likely
to choose mergers and acquisitions over joint ventures in instances where external
uncer-tainty is lower (Hyun and Kim 2010; Meyer et al. 2009). As a result, institutions that lower
external uncertainty should increase mergers and acquisitions relative to joint ventures.
Firms face asymmetric information about government characteristics when they attempt
to assess policy risk, one component of exernal uncertainty.
6Firms do not know ex-ante
what governments’ behavior will be once they make their market-entry decision.
7To
alle-viate this information asymmetry, firms may rely on proxies from the host country’s
insti-tutional environment (Meyer et al. 2009). Domestically, democracy (Jensen 2003) and
ex-ecutive constraints (Jensen 2008) have been shown to increase FDI, arguably because they
mitigate policy uncertainty. Scholars who work on sovereign debt have shown that
mem-bership in certain categories may also decrease investor perceptions of policy risk (Brooks,
Cunha and Mosley 2015; Gray 2009). This could be in the form of investment
catego-rizations (Brooks, Cunha and Mosley 2015) or international organizations’ classifications
(Gray 2009). Among international causes, bilateral investment treaties (BITs) may increase
FDI via a signal of policy commitment, although the empirical evidence is mixed (Bauerle
Danzman 2016; Berger et al. 2011; Haftel 2010; Kerner and Lawrence 2014). Institutions
that increase policy stability, in other words, those that entail greater credible commitments,
should influence firms to choose mergers and acquisitions over joint ventures.
Preferential Trade Agreements as Risk Mitigators
PTAs are one type of institution that may decrease policy uncertainty. PTAs are
in-ternational agreements that seek to preferentially liberalize trade in goods and/or services
between two or more countries (see D¨ur, Baccini and Elsig 2014, 356). Since 1945,
tries have signed more than 733 PTAs, with an explosion in activity starting in the 1990s
(D¨ur, Baccini and Elsig 2014). While the majority of PTAs are “agreements that liberalize
tariffs on a majority of goods,” they contain wide variation in the breadth and depth of their
contents (D¨ur, Baccini and Elsig 2014, 357; Lechner 2016). PTAs’ contents range from
traditional market access and trade liberalization measures to dispute settlement clauses,
regulatory policies like competition and sanitary and phytosanitary measures, and non-trade
issues like human rights and environmental policy (D¨ur, Baccini and Elsig 2014; Lechner
2016). Further, some PTAs’ provisions imply greater policy change, for example partial or
full liberalization of services trade. Given that PTAs could have important economic
con-sequences (Carr`ere 2006; B¨uthe and Milner 2008; but see Alfaro et al. 2004; Vamvakidis
1999), and that they display wide variation in their contents, it is important to discover
whether this variation generates heterogeneous effects on entry modes (B¨uthe and Milner
2014).
PTAs may act as a signal of credible commitment by enshrining governments’
resolu-tion to open markets and liberal economic policies (see B¨uthe and Milner 2008; B¨uthe and
Milner 2014), thereby decreasing policy risk and facilitating costlier entry modes. Indeed,
extant work has tended to find a positive relationship between PTAs and FDI, especially
for deeper PTAs (Berger et al. 2013; B¨uthe and Milner 2008; B¨uthe and Milner 2014;
Medvedev 2012; but see Peinhardt and Allee 2012).
8They provide information about
gov-ernment policies via ratification processes and third-party monitoring, and establish
compli-ance mechanisms, which raise the costs of reneging on policies enshrined in PTAs. Policy
change is one of the most important risks faced by foreign investors, especially given the
decline of direct expropriation since the 1970s (Jensen 2003). Consequently, increased
membership of PTAs should be associated with costlier entry modes because of credible
commitments and reduced information asymmetries.
One core difference among studies of PTAs is whether their provisions should operate
only between member countries or affect trade and investment more generally. If PTAs’
effects are member-specific, then one might expect that they affect market-entry modes
only between member states and have no impact on third-country firms through a signalling
mechanism (Berger et al. 2013).
9One might therefore anticipate that firms will primarily
take dyadic protections and policy liberalization into account (Kim, Lee and Tay 2018). By
contrast, if they represent a broader signal of policy commitment, then PTAs may reduce
perceptions of policy risk for all firms, regardless of country of origin (B¨uthe and Milner
2008; B¨uthe and Milner 2014).
10Firms can also move their capital and headquarters
to more favorable environments or through other countries (Kerner 2014), such that firms
whose home countries were previously non-signatories to PTAs could still take advantage
of PTA provisions.
11These mechanisms are not mutually exclusive: PTAs could affect
FDI through both their member-specific provisions and via a broad signal of commitment.
12Here, I model PTAs’ effects monadically.
Sectoral Patterns in Market-Entry Modes
Whether firms’ market-entry modes and their responses to policy uncertainty differ
along sectoral lines is an open question. Analyses that disaggregate firms by sector tend to
examine the differences between or amongst manufacturing and services firms and do not
address entry modes among agriculture firms (Brouthers and Brouthers 2003; Moschett,
Schramm-Klein and Swoboda 2010).
13Most analyses of sectors’ relative sensitivity to
policy risk have not found strong relationships (e.g. Brouthers and Brouthers 2003). In
the-9For example, Wellhausen (2015) contends that firms only respond to expropriation threats against fellow nationals, which intimates a bilateral-specific signalling mechanism.
10Although see Gray and Kucik (2017), who argue that ideological turnovers in leadership are associated with policy changes, despite the presence of PTAs.
11Although corporate restructuring to take advantage of investor protections in BITs when a dispute is fore-seeable has been deemed illegitimate, merely restructuring to benefit from such protection is legal (Siqueira de Oliveira 2016).
ory, increased host country risk should push all types of firms towards lower control entry
modes (i.e. joint ventures as opposed to mergers and acquisitions) (Ekeledo and Sivakumar
1998). Yet Erramilli and Rao (1993) only find a weak relationship between country risk
and entry mode choice among services firms, based on a systematic survey sample. It is
therefore unclear as to whether firms’ entry mode preferences and their response to changes
in policy uncertainty will differ between agriculture, manufacturing, and services firms.
While sectors may respond similarly to changes in host country policy risk, they may
react differently to variation in risk mitigating institutions.
14In particular, certain PTA
provisions, like sanitary and phytosanitary and services chapters, may matter more to
sec-tors affected by those provisions, as compared to secsec-tors that are uninfluenced by them.
This may be because these chapters enhance integration and market access for these
sec-tors in particular, although in this case the effects could be more dyadic (Kim, Lee and Tay
2018). Sector-specific chapters could also send a stronger signal of credible commitment to
sectors directly impacted by them. These provisions also embody commitments to
liberal-ized markets, but in contrast to most investor-state dispute settlement or dispute settlement
mechanisms they are necessarily limited in scope to specific sectors of the economy.
Con-sequently, one may expect that these types of chapters are only useful signals of credible
commitment for firms that operate in the sectors they address. Here, I model PTAs and their
sector-specific chapters as a signal of liberalizing policies and consider their broad effects
on firms’ market-entry modes.
Hypotheses
Firms’ market-entry modes depend partially on host country risk, one component of
which is policy uncertainty. PTAs, as a signal of governments’ commitments to liberalizing
policies, ought to decrease policy risk. I thus begin with the basic presumption that PTAs
should decrease investor perceptions of host country policy uncertainty, regardless of sector,
although this will mask internal variation. Increasing host country risk, including risk of
policy change, is theorized and shown to be associated with market-entry modes that involve
lower control and risk (i.e. joint ventures as opposed to mergers and acquisitions).
H1 is thus:
The more PTAs a country ratifies, the greater the probability that
firms will choose mergers and acquisitions over joint ventures as a
market-entry mode.
Once we begin to disaggregate the key independent variable, PTAs, we should expect
to see responses vary along sectoral lines. However, this relationship will be dependent on
whether the provisions in question are sector-specific. For instance, there is no theoretical
reason that PTA chapters which delineate state-state dispute settlement mechanisms should
have sector-specific consequences. By contrast, PTAs with deeper services provisions ought
to have a stronger effect on firms in the services sector. I focus on sanitary and
phytosan-itary
15and services provisions for several reasons. Cross-border investment in services
has become a significant component of FDI, which makes analyzing its determinants all
the more important.
16In addition, previous work on the determinants of entry modes has
focused on the differences between manufacturing and services industries. The inclusion of
sanitary and phytosanitary provisions can enhance my results’ external validity and
demon-strate whether my results may carry to other chapters.
17Finally, data availability reasons
constrain my choice of chapters.
H2 is thus:
The more PTAs a country ratifies with sanitary and
phytosani-tary provisions, the greater the probability that firms in agriculture sectors will
choose mergers and acquisitions over joint ventures as a market-entry mode.
15Sanitary and phytosanitary provisions refer to food safety and animal and plant health measures (see World Trade Organization 2018). These should particularly affect firms in the agriculture sector.
H3 is thus:
The more PTAs a country ratifies with services provisions, the
greater the probability that firms in services sectors will choose mergers and
acquisitions over joint ventures as a market-entry mode.
Data
Firms’ Market-Entry Modes
The applicability of FDI’s usual definition as a valid proxy for the concepts political
scientists wish to study is contested (see Kerner 2014). Most analyses of the effect of
inter-national institutions on FDI have utilized aggregate FDI flows data (B¨uthe and Milner 2008;
B¨uthe and Milner 2014; Kerner 2014). FDI flows are the net value of financial transactions
between foreign investors and local affiliates in which they have a minimum of a 10% stake
(Kerner 2014). This definition aggregates “across intercompany debt, equity, and reinvested
earnings” (Kerner 2014, 807). It also “excludes locally financed capital” and fails to
distin-guish between liquid and illiquid capital (Kerner 2014, 807). Aggregate FDI flows obscure
considerable variation in the type of cross-border transaction and may be inadequate
indi-cators of investors’ responses to country risk. As a result, there are good conceptual reasons
for analyzing a different but overlapping type of cross-border investment: The market-entry
decision.
To measure firms’ market-entry decisions, I jettison traditional FDI data in favor of
firm-level measures of activity. More specifically, I utilize firm-level transactions data from
Thomson Reuters’ SDC Platinum database. SDC Platinum is a standard source of data for
analyses of mergers and acquisitions (Pandya and Leblang 2017; Xie, Reddy and Liang
2017) and joint ventures (Moskalev and Swensen 2007). This allows me to model the
choice between mergers and acquisitions and joint ventures/cross-border alliances
18, which
should be sensitive to changes in policy risk (e.g. Zhao, Luo and Suh 2004).
19SDC
18In this analysis I collapse joint ventures and cross-border alliances.
Platinum claims to report the near-universe of mergers and acquisitions and joint ventures
from the mid-1980s to the present. While SDC Platinum may be more prone to errors on
smaller acquirers for mergers and acquisitions, coverage is “fairly complete” from 1984
onwards, and coverage continues to improve with time (Barnes, Harp and Oler 2014). Deal
values are only recorded for a small subset of mergers and acquisitions, and these data are
likely not missing at random (Herger and McCorriston 2014). I therefore rely on the count
of mergers and acquisitions and joint ventures as opposed to deal value. In many ways,
this ought to be a better measure of firm activity, as cross-border mergers and acquisitions
or joint ventures between massive conglomerates could result in significant year-to-year
variation that is unrelated to underlying policy risk (Pandya and Leblang 2017). While not
as costly as greenfield investments, mergers and acquisitions are still risky in comparison
to joint ventures as well as other non-equity market-entry modes, and therefore ought to be
relatively more sensitive to political risk (Pan and Tse 2000; Shimizu et al. 2004).
20The impact of PTAs and other international institutions should be smaller for advanced
industrialized countries, which already possess strong institutions and are low risk
environ-ments.
21Further, transactions data are heavily weighted towards developed countries. I
therefore eliminate observations from the OECD and a handful of other advanced countries
(e.g. Singapore and Switzerland). I also eliminate observations from countries that are tax
havens or locations for investment vehicles (e.g. the Cayman Islands and Mauritius)
be-cause transactions involving these countries should tend to reflect favorable tax incentives
rather than underlying policy risk. This left 146 countries, a full list of which is available in
the appendix, on which I could run my analyses.
2220Mergers and acquisitions are also of substantive interest relative to greenfield investments, as they domi-nate capital inflows for developing countries (Chan and Zheng 2017).
21This could be because investors consider a wider range of government policies and outcomes in develop-ing countries (see Mosley 2003).
Preferential Trade Agreements
Data on PTAs come from the DESTA dataset, which is the most comprehensive
publi-cally available data source for disaggregating PTAs (D¨ur, Baccini and Elsig 2014). DESTA
codes for several types of provisions in 573 PTAs. These PTAs range from fully-fledged
trade agreements to partial trade agreements, customs unions, and services agreements,
and encompass both plurinational and bilateral agreements. Currently, data are available
for dispute settlement, market access, public procurement, sanitary and phytosanitary
mea-sures, services, and technical barriers to trade. There are also two more general measure
of depth, constructed via an additive index and latent trait analysis (D¨ur, Baccini and Elsig
2014). I rely on DESTA’s coding of sanitary and phytosanitary and services chapters, as
they are the provisions with the clearest sector-specific consequences. DESTA codes for
the existence of chapters as well as some additional provisions, like the degree of policy
harmonization. I utilize their coding of chapters’ existence and a measure of the strength of
services’ liberalization to construct my key independent variables.
Controls
Analyses of firms’ market-entry decisions point to a number of theoretically relevant
control variables.
23With regard to political variables, PTAs are not the only international
institutions that may affect the investment risk environment. Most prominently, BITs are
meant to attract FDI, although they have an empirically spotty record (Bauerle Danzman
2016; Berger et al. 2011; Desbordes and Vicard 2009; Haftel 2010). The count of BITs by
country are obtained from UNCTAD’s Investment Policy Hub, which contains raw data on
BITs (UNCTAD n.d.). I follow B¨uthe and Milner (2008) and use the count of BITs as a
control variable. In terms of domestic institutions, constraints on the ability of governments
to either expropriate investments or implement policies that degrade investment value ought
to matter to FDI (Jensen 2003). As a result, I control for constraints on the executive with
the EXCONST variable from Polity IV (Marshall, Gurr and Jaggers 2017). I also include
the normalized Chinn-Ito index as an indicator of capital account openness, which may be
positively associated with firms’ willingness to utilize high-risk entry modes because of an
increased ability to repatriate investments (Chinn and Ito 2006). This can also be seen as
a next best measure of national restrictions on foreign investment. Although expropriation
risk has declined over time (Li 2009), property rights should still matter for firms.
Con-sequently, I include a measure of property rights from the Varieties of Democracy Project
(Coppedge et al. 2017). Although this indicator is determined by the property rights of
natural persons, it should still be a decent proxy for firms’ property rights.
In addition to political variables, certain economic indicators are critical for attracting
cross-border investment. Market size is an important determinant of FDI (Bevan and Estrin
2004). To approximate for market size, I will utilize a measure of GDP from the World
Bank’s World Development Indicators (WDI) (World Bank 2018). Expectations of further
market growth may also be correlated with increased FDI, as market actors would like to
invest in growing markets. I will therefore also include a measure of GDP growth from
the WDI. Finally, countries’ levels of development could be correlated with market-entry
modes, so I will control for GDP per capita from the WDI (Xie, Reddy and Liang 2017).
Method and Model
P r
(
y
ij= 1) =
logit
1(
↵
j[i]+
✏
ij)
, f ori
= 1
, ..., n
↵
j=
00+
01 j+
u0
j, f orj
= 1
, ..., n
The first regression equation predicts the dependent variable, here the probability that
firm
i
in country
j
chooses a merger or acquisition as opposed to a joint venture/cross-border
alliance. As the use of firm-level covariates, such as net assets, would eliminate over 85%
of my observations, I refrain from adding individual-level predictors to my model.
↵
jis a
random intercept, such that the second regression equation predicts the average probability
in country
j
with a vector of country-level controls
j. This includes my primary
indepen-dent variables, PTAs and the presence of certain PTA chapters, as well as the economic and
political controls discussed above.
✏
ijand
u0
jare error terms for the individual-level and
group-level, respectively, and are assumed to be 0 and independent of one another.
Results
Descriptives
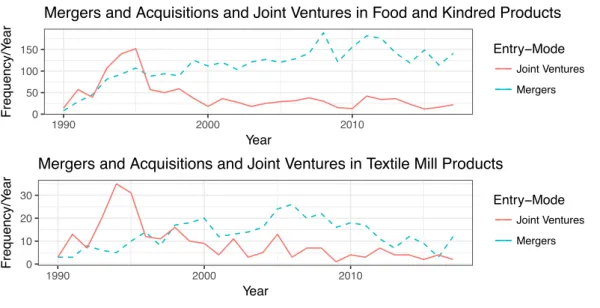
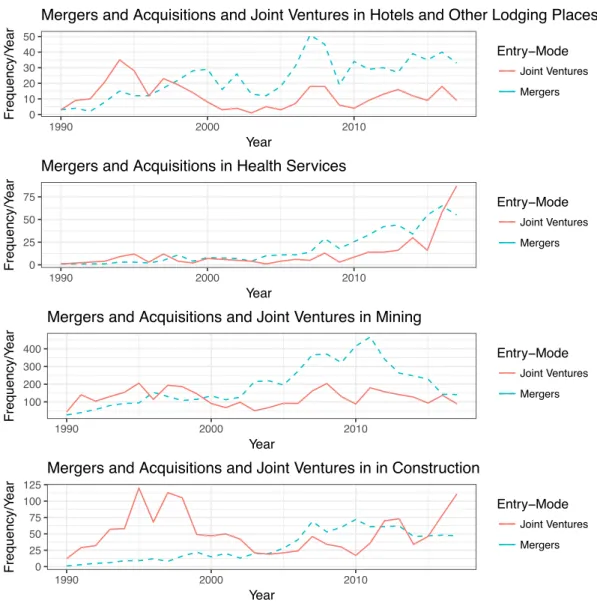
Figure 1 displays the count of joint ventures/cross-border alliances and mergers and
acquisitions by year along with the number of countries in the sample. The number of
countries is somewhat smaller in 1990-3 than in later years, but by 1994 tends to be stable
across the sample. Joint ventures tended to be more popular than mergers and acquisitions
during the early and mid 1990s, but since then mergers and acquisitions have tended to
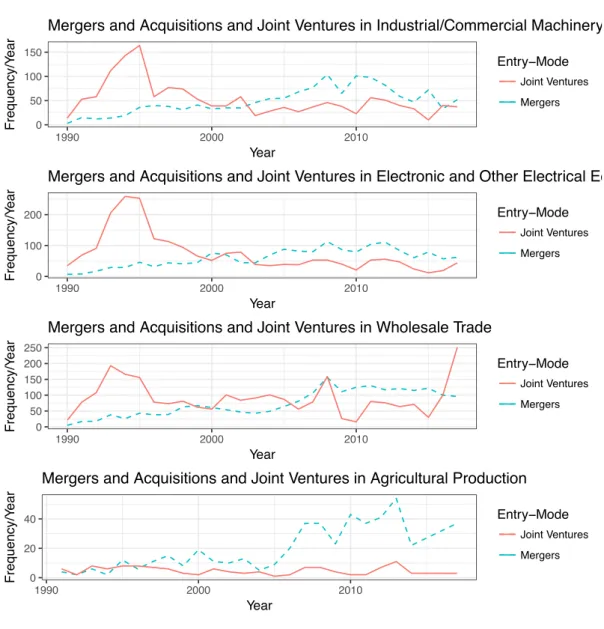
be more popular. When transactions are broken down into select industries based on the
Standard Industrial Classification (SIC), this general pattern appears to hold, although the
ratios differ across sectors.
24This variance in entry mode between and within sectoral groups is shown numerically
in Tables 1-3. Table 1 shows the ratio of mergers and acquisitions to total transactions for
each of the major SIC divisions. The lowest proportion of mergers and acquisitions — .34
Table
1:
Mark
et-Entry
Modes
by
SIC
Di
vision
Di
vision
Ratio
of
Mer
gers
to
Joi
nt
V
entures
Total
Transactions
Public
Administration
0.34
223
Construction
0.38
2317
Wholesale
Trade
0.45
4597
Manuf
acturing
0.54
31110
Services
0.57
15093
Transportation,
Communications,
Electric,
Gas,
and
Sanitary
Services
0.57
11249
Mining
0.61
8952
Retail
Trade
0.64
2616
Finance,
Insurance,
and
Real
Estate
0.68
13748
Agriculture,
Forestry
,and
Fishing
0.74
1176
Total
0.57
0 1000 2000 3000
0 100 200 300
1990 2000 2010
Year
Frequency/Y
ear
Countr
ies/Y
ear
Entry−Mode Joint Venture
Merger
# of Countries Countries Figure 1: Mergers and Acquistions and Joint Ventures
Fig. 1:Transactions Over Time
Table 4:Top 20 Countries, by Total Transactions
Country
Total Joint Venture M&A
China
20045
12515
7530
India
9245
4512
4733
Russian Federation
7173
2015
5158
Brazil
5597
1018
4579
Malaysia
3542
1652
1890
Indonesia
3296
1376
1920
Thailand
2753
1342
1411
South Africa
2429
660
1769
Argentina
2320
331
1989
Viet Nam
1978
1184
794
Taiwan, Province of China
1883
974
909
Philippines
1785
948
837
Ukraine
1737
203
1534
United Arab Emirates
1401
804
597
Romania
1277
197
1080
Colombia
1043
177
866
Peru
1041
170
871
Saudi Arabia
1016
771
245
Chile
978
252
726
Israel
909
268
641
— occurs in the Public Administration sector (SIC division J), while the highest proportion
of mergers and acquisitions — .74 — occurs in the Agriculture, Forestry, and Fishing
sec-tor (SIC division A). Taking into consideration counts of transactions, divisions appear to
be somewhat normally distributed around the total proportion of mergers and acquisitions
of .57. Tables 2 and 3 further dissect sectoral variation in entry modes, comparing the
ra-tio of mergers and acquisira-tions to total transacra-tions for each of the major manufacturing
and services SIC groups, respectively. The upper and lower bounds of the proportion of
mergers and acquisitions are fairly similar between manufacturing groups, services groups,
and sectoral divisions. However, counts of transactions are not clustered around the mean,
but appear to be more bi-modally or uniformly distributed across the range of ratios. In
aggregate, there are clearly some differences in firms’ market-entry modes both within and
between sectors.
Transactions tend to be concentrated in large middle-income countries, and there is
geographic variation in transaction type. Table 4 shows the 20 countries in my sample
with the most transactions. China contributes the most observations, followed distantly by
India, Russia, and Brazil. Thereafter, other large middle-income economies like Malaysia,
Indonesia, and South Africa contribute the most to my sample. However, there is wide
variation in the type of market-entry mode across countries.
25Mergers and acquisitions
are much more popular than joint ventures in Russia and Brazil. By contrast, joint ventures
are more common than mergers and acquisitions in China and Vietnam, while transactions
in India tend to involve equal numbers of joint ventures and mergers and acquisitions.
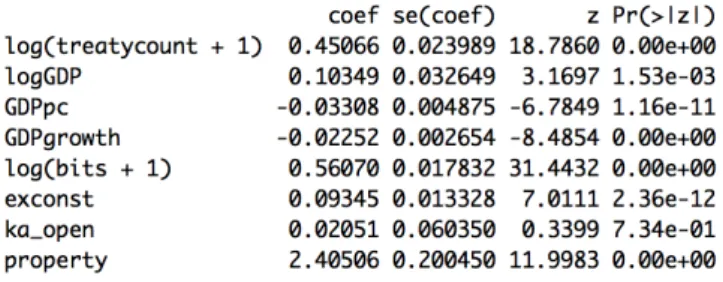
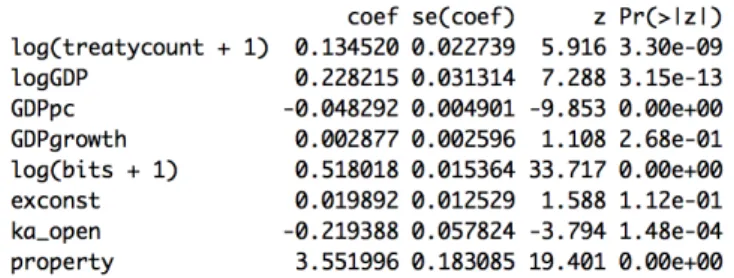
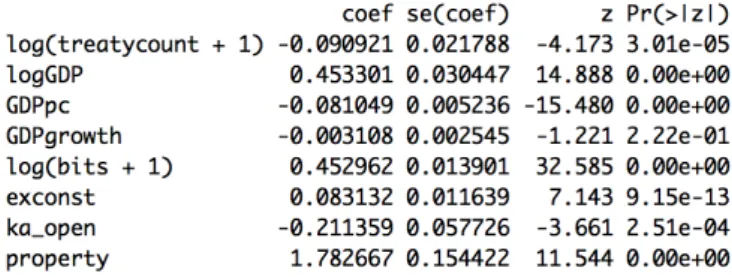
Aggregate-Data Model Estimates
Initial regressions on the aggregate data indicate that PTAs are positively and
signifi-cantly associated with market-entry mode choice. Tables 5 and 6 display the results from
multilevel logistic regressions with random intercepts by country estimated on the
gate data.
26Table 5 lags the independent variables by one year, while Table 6 lags the
independent variables by three years. Otherwise, both Table 5 and Table 6 are identical. In
Model 1 I start by simply estimating the effect of the log count of PTAs on entry mode. In
Model 2 I add the previously discussed economic controls to the baseline model. In Model
3 I add the previously discussed political variables to the baseline model. I then combine all
the independent variables in Model 4. As expected, my main independent variable, the log
count of PTAs, is positively and significantly associated with the probability of selecting
mergers and acquisitions as an entry mode. Among the economic variables, the log of GDP
(in millions of current US dollars) tends to be positively associated with the probability of
selecting mergers and acquisitions, but is not significant across all models. GDP growth
has no stable relationship with the likelihood of selecting mergers and acquisitions. GDP
per capita (in thousands of current US dollars) appears to be negatively associated with the
probability of selecting mergers and acquisitions. This may be a result of the inclusion of
oil-rich countries in the analysis. The log count of BITs, constraints on the executive
(EX-CONST), and property rights are positively and significantly associated with the probability
of selecting mergers and acquisitions. This accords with the prediction that BITs, executive
constraints, and stronger property rights may decrease perceptions of country risk — either
policy or expropriation risk — and should therefore be associated with costlier entry modes.
Capital account openness does not appear to be systematically associated with entry mode.
Transactions are nested within industries as well as countries, which could affect
param-eter estimates. Table 7 shows the results of regressions in which I added an additional set
of random intercepts at the highest level of industrial disaggregation available: The 4-digit
SIC. The addition of industry random intercepts does not substantially change the estimated
effect of the log count of PTAs. With regard to the economic and political variables, results
are also quite similar. Taking into account unobserved dependence within industries does
not appear to change the effects of PTAs.
Sector-Data Model Estimates
In the next set of analyses, I divide the data into agriculture, services, non-agriculture,
and non-services based on the SIC of the joint venture or the target company for
merg-ers and acquisitions. For agriculture, I select the groups Agricultural Production Crops
and Agriculture Production Livestock and Animal Specialties. For services, I select all the
groups in the services division (Division I). I run the same models as above – multilevel
logistic regressions with country random intercepts
27– on each of these subsets of data,
using a ratio measure to account for the presence of sector-specific PTA clauses. I compute
the proportion of a country’s PTAs that contain a sanitary and phytosanitary or services
chapter by dividing the number of sanitary and phytosanitary or services chapters by the
number of PTAs (adding .01 in order to include those countries with 0 PTAs). These
vari-ables are thus bounded between 0 and just below 1. These analyses offer mixed support for
my hypotheses that sector-specific chapters should have sector-specific effects.
Tables 8 and 9 display the results of the models using the proportion of a country’s
PTAs with a sanitary and phytosanitary chapter on agriculture and non-agriculture
transac-tions. This measure is positive and significant in all the models except the fully saturated
non-agriculture model, as one would suspect if sanitary and phytosanitary chapters
primar-ily affect agriculture firms. The proportion measure’s coefficient is rather larger for
agri-culture transactions, as compared with non-agriagri-culture transactions, although the standard
errors are also much more sizable. Other variables do not change qualitatively between the
non-agriculture models and the aggregate data models. In the agriculture models only the
proportion of PTAs with a sanitary and phytosanitary chapter is statistically significant —
all other variables are non-significant. It should be noted that I only have a small sample
of transactions based in agricultural production sectors (ranging from 516 to 640), which
likely contributes somewhat to these estimates.
Tables 10 and 11 contain estimates from the models run on services and non-services
data, using the proportion of a country’s PTAs with services chapters. This indicator is
positive and significant across the models. Like the agriculture models, it also appears to be
larger for services transactions than for non-services transactions, although in this instance
the standard errors are more comparable. Other estimates do not change qualitatively
be-tween the sets of models.
DESTA codes for no, partial, and full harmonization of sanitary and phytosanitary
measures and no, mentioned, and substantive liberalization of services trade. Thus far, I
have treated the sanitary and phytosanitary and services provisions as binary by
collaps-ing any provisions into one indicator. However, my theory would predict that stronger
sector-specific provisions should matter more than weaker ones. I therefore construct a new
measure to take into account the strength of a country’s services provisions.
28I consider
services chapters that discuss liberalization as an objective to be equal to .5 and services
chapters that make substantive provisions liberalizing trade in services to be equal to 1. For
each country-year, I sum the two and divide by the total number of PTAs (adding .01 in
order to include those countries with 0 PTAs). This creates a proportion similar to that used
above, which varies between 0 and 1. I then rerun all models on services and non-services
transactions using this alternative measure. The results of these models are displayed in
Tables 12 and 13. The coefficient for the intensity of services chapters is consistently larger
for services transactions, as compared with the coefficient for services provisions in the
previous models. However, for non-services transactions the coefficient is not consistently
larger or smaller when compared with the previous models. The remaining variables remain
as in previous models: Log GDP, the log count of BITs, executive constraints, and property
rights are all positive and significant, while GDP growth is negative and significant, and
GDP per capita and the Chinn-Ito index are inconsistent. These results suggest that the
relative depth of a country’s services chapters may matter slightly more for services firms
as compared to non-services firms.
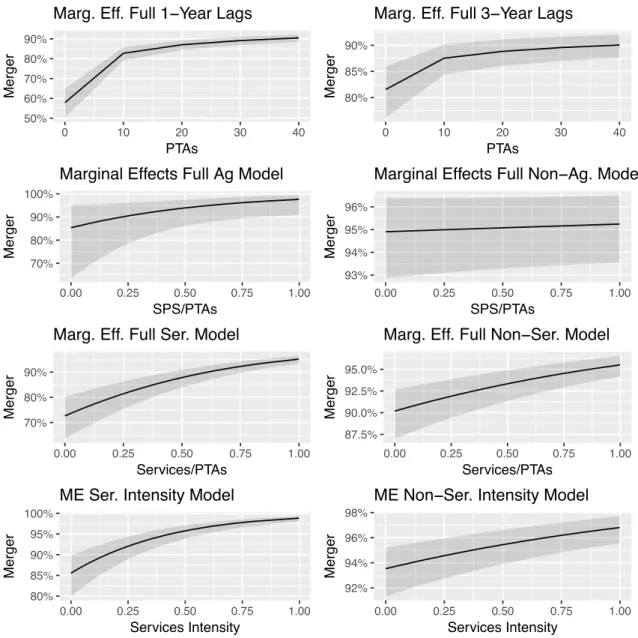
In order to more easily analyze the models’ estimates, I plot the marginal effects of the
50% 60% 70% 80% 90%
0 10 20 30 40
PTAs
Merger
Marg. Eff. Full 1−Year Lags
80% 85% 90%
0 10 20 30 40
PTAs
Merger
Marg. Eff. Full 3−Year Lags
70% 80% 90% 100%
0.00 0.25 0.50 0.75 1.00
SPS/PTAs
Merger
Marginal Effects Full Ag Model
93% 94% 95% 96%
0.00 0.25 0.50 0.75 1.00
SPS/PTAs
Merger
Marginal Effects Full Non−Ag. Model
70% 80% 90%
0.00 0.25 0.50 0.75 1.00
Services/PTAs
Merger
Marg. Eff. Full Ser. Model
87.5% 90.0% 92.5% 95.0%
0.00 0.25 0.50 0.75 1.00
Services/PTAs
Merger
Marg. Eff. Full Non−Ser. Model
80% 85% 90% 95% 100%
0.00 0.25 0.50 0.75 1.00
Services Intensity
Merger
ME Ser. Intensity Model
92% 94% 96% 98%
0.00 0.25 0.50 0.75 1.00
Services Intensity
Merger
ME Non−Ser. Intensity Model
PTA indicators – the log count of PTAs and the count of sanitary and phytosanitary and
services chapters divided by the count of PTAs – on the probability of selecting a merger or
acquisition.
29These figures use the full models, holding all other variables at their mean.
The plots from the models run on the aggregate data reinforce the conclusion that increased
numbers of PTAs are associated with an increased probability of selecting mergers or
acqui-sitions as an entry mode. The plots of the effects of sanitary and phytosanitary provisions
demonstrate that there is a slight positive relationship between sanitary and phytosanitary
provisions and agriculture firms as compared to no relationship between sanitary and
phy-tosanitary provisions and non-agriculture transactions. However, the confidence intervals
of the two estimates overlap, which suggests the effects are indistinguishable. The plots
from the models estimated on the services and non-services data indicate the probability
of choosing a merger or acquisition is much lower among services firms than non-services
firms when there are no services chapters. The confidence intervals around the estimated
probability of selecting a merger or acquisition do not intersect with one another until there
is more than one services chapter for every two PTAs. This effect is weaker when comparing
the models that used the variation in depth measure. However, these models again indicate
that the relationship between services chapters and entry modes is more substantial for
ser-vices transactions. There is thus strong support for a positive association between PTAs and
the probability of a merger or acquisition, moderate support for the sector-specific effects of
services chapters, and weak support for the sector-specific effects of sanitary and
phytosani-tary chapters. Again, this may be due to the small sample size. It is worth reiterating that the
sanitary and phytosanitary measure is not significant in the fully saturated non-agriculture
model, in contrast to the fully saturated agriculture model, consistent with my theory that
sanitary and phytosanitary measures should primarily affect agriculture transactions.
Robustness Checks
I perform a number of alternative model specifications as initial robustness checks,
al-most all of which reaffirm my initial results.
30First, I reestimate the aggregate data models
using five year lags, as one and three year lags may be insufficient. While the log count
of PTAs remains positive and significant for the simple, economic, and political models, it
becomes negative and significant at
p <
0
.
1
in the fully saturated model.
Second, I exclude China and reestimate my simple and full aggregate data models with
one, three, and five year lags. China contributes the most observations to my sample —
21.9% of the total — so it may be driving my results. When I exclude China the log count
of PTAs is positive and significant in all models, including the fully saturated five year lag
model. This is likely because of tighter restrictions in China on cross-border mergers and
acquisitions in the 1990s (Zou and Simpson 2008).
Third, I add several different variables to the full aggregate data model with 1 year lags.
I substitute countries’ log GDP with log population from the World Bank as an alternative
indicator of market size (World Bank 2018). I also include a measure of governments’
trans-parency from Hollyer, Rosendorff and Vreeland (2014), as foreign firms may care about the
transparency of governments’ data.
31Karcher and Steinberg (2013) suggest that Chinn-Ito
suffers from systematic measurement error. I therefore replace Chinn-Ito with their
modifi-cation.
32The executive party’s ideological or policy positions may also matter for foreign
investors, although the empirical effects are not necessarily strong (see Mosley 2000).
33I
therefore include a three-category measure of executive party orientation with respect to
economic policy from the Database of Political Institutions (Cruz, Keefer and Scartascini
2016). Including these variables does not affect the direction or qualitative significance of
30Tables of these estimates can be found in the appendix.
31I do not include this in the main models because their data end in 2010, which would eliminate seven of 28 years in my panel.
32Note that their data also end in 2010.
the log count of PTAs, and has no impact on the interpretation of the economic or political
controls.
Fourth, I reestimate the fully saturated models for the aggregate and services data with
year dummies.
34Across the models, the log count of PTAs remains strongly associated
with an increased propensity to select mergers and acquisitions. In the services ratio model,
there do not appear to be differences between services and non-services firms. In contrast, in
the services intensity model the relationship between services chapters and the probability
of choosing a merger and acquisition is stronger for services as compared to non-services
transactions. In general, the other variables do not change the economic or political
con-trols: Executive constraints and property rights remain positive and significant, and GDP
per capita remains negative and significant. However, the log count of BITs is no longer
significant. My results therefore seem to be robust to time.
Fifth, I rerun the sector-data models with an alternative indicator for the presence of
sector-specific chapters: The log count of sanitary and phytosanitary or services provisions
alongside the log count of PTAs. The interpretation of these models is somewhat unclear, as
the PTA variable should interact with the sector-specific chapters variable because a country
cannot have more sector-specific chapters than PTAs. However, they appear to corroborate
the models that use the proportion of PTAs with sector-specific chapters. Agriculture
trans-actions are comparatively more sensitive to sanitary and phytosanitary provisions, but this
variable is negative and non-significant. Among services transactions, the log count of
services chapters is positively and significantly associated with the likelihood of selecting
mergers and acquisitions. By contrast, among non-services transactions, the log count of
services chapters is negatively and significantly associated with the probability of selecting
mergers and acquisitions. For services chapters there is a moderate sector-specific
rela-tionship, while for sanitary and phytosanitary relationship there is a weak sector-specific
relationship.
year lags using logistic regressions with country fixed effects.
35Unlike the previous
multi-level model estimates, this accounts for time invariant aspects of countries. The coefficients
of the log count of PTAs remain consistent with the random effects models’ estimates. My
baseline results are thus robust to these initial checks.
Implications and Limitations
My results conform with and add to extant research. I demonstrate that PTAs are
as-sociated with an increased propensity to select higher control and risk entry modes. This
relationship holds when controlling for country-level market characteristics and domestic
and international political variables. Political scientists argue that PTAs reduce investor
perceptions of policy risk (e.g. B¨uthe and Milner 2008), while international business
schol-ars demonstrate that firms select high control and risk entry modes when country risk is
lower (e.g. Zhao, Luo and Suh 2004). My base finding thus accords with the predictions of
mainstream work in both fields. Unlike extant analyses, I also consider the potential
sector-specific effects of sector-sector-specific PTA chapters. My findings indicate that the relationship
between sanitary and phytosanitary chapters and entry mode choice only differs slightly
between agriculture and non-agriculture transactions. By contrast, services chapters are
more strongly correlated with an increased propensity to select mergers and acquisitions
among services firms than among non-services firms. This accords with the theoretical
pre-dictions of some international business models (e.g. Ekeledo and Sivakumar 1998), which
has nevertheless failed to find a systematic relationship between country risk and services’
market-entry modes. My findings thus confirm most analyses of the effects of PTAs and the
determinants of firms’ market-entry modes, while adding to extant work by incorporating
variation in PTAs and sectoral market-entry mode patterns.
My results face several threats to inference. First, firms’ attributes are heterogeneous
and there should be wide firm-level variation in their market-entry decisions. Since Melitz
(2003), scholars have increasingly pointed out that firm-level productivity, which is
geneous, is an important determinant of the decision to enter foreign markets (e.g. Chen and
Moore 2010). Kim (2017) notes that, since the establishment of the WTO, most of the
vari-ation in tariffs is not at the sector-level but at the firm-level. Building on this insight, Kim
et al. (2017) demonstrate with a conjoint experiment that there is considerably more
varia-tion in firms’ preferences towards trade policy at the firm-level than at the sector-level. Kim,
Lee and Tay (2018) add to this literature by testing the effects of PTA investment provisions
on firm-level production networks. They find that stronger provisions are associated with
an increased number of multinational corporations’ affiliates. Other variables, like firms’
prior international experience, could also increase their propensity to engage in relatively
riskier foreign investments (Xie, Reddy and Liang 2017). However, Baccini, Osgood and
Weymouth (2018) contend that firm-level lobbying differences are strongest in
manufac-turing, and are relatively weaker amongst service industries, where inter-sectoral variation
does matter. Friel et al. (2016) also find that most food industry lobbying for the
Trans-Pacific Partnership took place through industry or business associations. Thus, firm-level
productivity and experience may increase the expected benefits of foreign investments and
reduce their perceived risk, especially for manufacturing sectors. Since potential firm-level
covariates that could control for this heterogeneity (i.e. labor productivity) are extremely
limited in scope and are likely not missing at random, I cannot empirically address this
concern.
Conclusion
APPENDIX
Table 14:Countries in Sample
Afghanistan
Latvia
Albania
Lebanon
Algeria
Lesotho
Angola
Liberia
Argentina
Libya
Armenia
Lithuania
Azerbaijan
Madagascar
Bahrain
Malawi
Bangladesh
Malaysia
Belarus
Maldives
Belize
Mali
Benin
Malta
Bhutan
Martinique
Bolivia (Plurinational State of)
Mauritania
Bosnia and Herzegovina
Mexico
Botswana
Mongolia
Brazil
Morocco
Brunei Darussalam
Mozambique
Bulgaria
Myanmar
Burkina Faso
Namibia
Burundi
Nepal
Cabo Verde
Nicaragua
Cambodia
Niger
Cameroon
Nigeria
Central African Republic
Oman
Chad
Pakistan
China
Papua New Guinea
Colombia
Paraguay
Congo
Peru
Costa Rica
Philippines
Cte D’Ivoire
Poland
Croatia
Qatar
Cuba
Republic of Korea
Cyprus
Republic of Moldova
Czech Republic
Romania
Czechoslovakia
Russian Federation
Democratic People’s Republic of Korea Rwanda
Democratic Republic of the Congo
Sao Tome and Principe
Djibouti
Saudi Arabia
Dominican Republic
Senegal
East Timor
Seychelles
Ecuador
Sierra Leone
Egypt
Slovakia
El Salvador
Slovenia
Equatorial Guinea
Solomon Islands
Eritrea
Somalia
Estonia
South Africa
Ethiopia
Sri Lanka
Fiji
Sudan
Gabon
Suriname
Gambia
Syrian Arab Republic
Georgia
Taiwan, Province of China
Guyana
Togo
Haiti
Tonga
Honduras
Tunisia
Hungary
Turkmenistan
India
Uganda
Indonesia
Ukraine
Iran (Islamic Republic of)
United Arab Emirates
Iraq
United Republic of Tanzania
Israel
Uruguay
Jamaica
Uzbekistan
Jordan
Vanuatu
Kazakhstan
Venezuela, Bolivarian Republic of
Kenya
Viet Nam
Kiribati
Yemen
Kuwait
Yugoslavia
Kyrgyzstan
Zambia
Lao People’s Democratic Republic
Zimbabwe
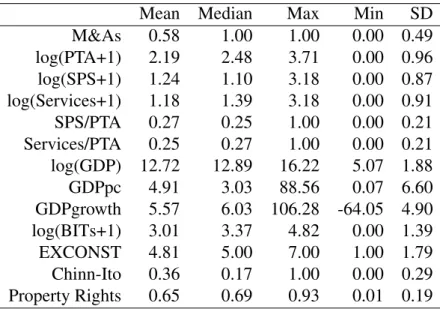
Table 15:Summary Statistics, Based on No Lags
Mean Median
Max
Min
SD
M&As
0.58
1.00
1.00
0.00 0.49
log(PTA+1)
2.19
2.48
3.71
0.00 0.96
log(SPS+1)
1.24
1.10
3.18
0.00 0.87
log(Services+1)
1.18
1.39
3.18
0.00 0.91
SPS/PTA
0.27
0.25
1.00
0.00 0.21
Services/PTA
0.25
0.27
1.00
0.00 0.21
log(GDP) 12.72
12.89
16.22
5.07 1.88
GDPpc
4.91
3.03
88.56
0.07 6.60
GDPgrowth
5.57
6.03 106.28 -64.05 4.90
log(BITs+1)
3.01
3.37
4.82
0.00 1.39
EXCONST
4.81
5.00
7.00
1.00 1.79
Chinn-Ito
0.36
0.17
1.00
0.00 0.29
0 50 100 150
1990 2000 2010
Year
Frequency/Y
ear
Entry−Mode
Joint Ventures
Mergers Mergers and Acquisitions and Joint Ventures in Food and Kindred Products
0 10 20 30
1990 2000 2010
Year
Frequency/Y
ear
Entry−Mode
Joint Ventures
Mergers Mergers and Acquisitions and Joint Ventures in Textile Mill Products
100 200 300
1990 2000 2010
Year
Frequency/Y
ear
Entry−Mode
Joint Ventures
Mergers Mergers and Acquisitions and Joint Ventures in Chemicals and Allied Products
0 50 100
1990 2000 2010
Year
Frequency/Y
ear
Entry−Mode
Joint Ventures
Mergers Mergers and Acquisitions and Joint Ventures in Retail Trade
0 10 20 30 40 50
1990 2000 2010
Year
Frequency/Y
ear
Entry−Mode Joint Ventures
Mergers
Mergers and Acquisitions and Joint Ventures in Hotels and Other Lodging Places
0 25 50 75
1990 2000 2010
Year
Frequency/Y
ear
Entry−Mode
Joint Ventures
Mergers
Mergers and Acquisitions in Health Services
100 200 300 400
1990 2000 2010
Year
Frequency/Y
ear
Entry−Mode
Joint Ventures
Mergers
Mergers and Acquisitions and Joint Ventures in Mining
0 25 50 75 100 125
1990 2000 2010
Year
Frequency/Y
ear
Entry−Mode Joint Ventures
Mergers
Mergers and Acquisitions and Joint Ventures in in Construction
0 50 100 150
1990 2000 2010
Year
Frequency/Y
ear
Entry−Mode
Joint Ventures
Mergers
Mergers and Acquisitions and Joint Ventures in Industrial/Commercial Machinery
0 100 200
1990 2000 2010
Year
Frequency/Y
ear
Entry−Mode
Joint Ventures
Mergers
Mergers and Acquisitions and Joint Ventures in Electronic and Other Electrical Equipment
0 50 100 150 200 250
1990 2000 2010
Year
Frequency/Y
ear
Entry−Mode
Joint Ventures
Mergers
Mergers and Acquisitions and Joint Ventures in Wholesale Trade
0 20 40
1990 2000 2010
Year
Frequency/Y
ear
Entry−Mode
Joint Ventures
Mergers
Mergers and Acquisitions and Joint Ventures in Agricultural Production
Fig. 6:Simple Model (Country Fixed Effects, 1-Year Lags)
Table 20:Aggregate Estimates (Random Intercepts by Country, Year Dummies)
Dependent variable:
merger
1-Year Full
3-Year Full
(1)
(2)
log(PTAs + 1)
0.312
⇤⇤⇤(0.024)
0.128
⇤⇤⇤(0.024)
log(GDP)
0.042 (0.033)
0.161
⇤⇤⇤(0.038)
GDP per capita
0.015
⇤⇤⇤(0.004)
0.012
⇤⇤⇤(0.005)
GDP growth
0.014
⇤⇤⇤(0.003)
0.010
⇤⇤⇤(0.003)
log(BITs + 1)
0.001 (0.024)
0.002 (0.022)
EXCONST
0.072
⇤⇤⇤(0.013)
0.032
⇤⇤(0.013)
Chinn-Ito Index
0.276
⇤⇤⇤(0.063)
0.040 (0.061)
Property rights
1.375
⇤⇤⇤(0.188)
1.173
⇤⇤⇤(0.175)
Constant
1.738
⇤⇤⇤(0.308)
2.673
⇤⇤⇤(0.339)
Observations
72,387
74,986
Log Likelihood
39,085.510
40,693.930
Akaike Inf. Crit.
78,243.020
81,461.860
Bayesian Inf. Crit.
78,573.850
81,803.180
Note:
⇤p
<
0.1;
⇤⇤p
<
0.05;
⇤⇤⇤p
<
0.01
Fig. 8:Simple Model (Country Fixed Effects, 3-Year Lags)
Fig. 10:Simple Model (Country Fixed Effects, 5-Year Lags)