rspb.royalsocietypublishing.org
Research
Cite this article:
Evangelista DJ, Ray DD, Raja
SK, Hedrick TL. 2017 Three-dimensional
tra-jectories and network analyses of group
behaviour within chimney swift flocks during
approaches to the roost.
Proc. R. Soc. B
284
:
20162602.
http://dx.doi.org/10.1098/rspb.2016.2602
Received: 23 November 2016
Accepted: 16 January 2017
Subject Category:
Morphology and biomechanics
Subject Areas:
behaviour, biomechanics, biophysics
Keywords:
chimney swift, flocking, aggregation,
swarming, network, flight biomechanics
Author for correspondence:
Dennis J. Evangelista
e-mail: [email protected]
Electronic supplementary material is available
online at
https://dx.doi.org/10.6084/m9.fig-share.c.3677836.
Three-dimensional trajectories and
network analyses of group behaviour
within chimney swift flocks during
approaches to the roost
Dennis J. Evangelista
1,2, Dylan D. Ray
1, Sathish K. Raja
1and Tyson L. Hedrick
11Biology Department, University of North Carolina at Chapel Hill, NC 27510, USA
2Department of Weapons and Systems Engineering, United States Naval Academy, Annapolis, MD 21402, USA
DJE, 0000-0002-6565-8300; TLH, 0000-0002-6573-9602
Chimney swifts (Chaetura pelagica) are highly manoeuvrable birds notable for roosting overnight in chimneys, in groups of hundreds or thousands of birds, before and during their autumn migration. At dusk, birds gather in large num-bers from surrounding areas near a roost site. The whole flock then employs an orderly, but dynamic, circling approach pattern before rapidly entering a small apertureen masse. We recorded the three-dimensional trajectories of1 800 indi-vidual birds during a 30 min period encompassing flock formation, circling, and landing, and used these trajectories to test several hypotheses relating to flock or group behaviour. Specifically, we investigated whether the swifts use local inter-action rules based on topological distance (e.g. the n nearest neighbours, regardless of their distance) rather than physical distance (e.g. neighbours withinxm, regardless of number) to guide interactions, whether the chimney entry zone is more or less cooperative than the surrounding flock, and whether the characteristic subgroup size is constant or varies with flock density. We found that the swift flock is structured around local rules based on physical distance, that subgroup size increases with density, and that there exist regions of the flock that are less cooperative than others, in particular the chimney entry zone.
1. Introduction
The movement of groups of animals, especially the coordinated behaviour of birds in flocks, has excited observers and researchers for many years leading to studies from a variety of biological and mathematical perspectives. This work has focused on identifying the implications of simple, local rules on the formation or disintegration of flocks [1,2] along with the implications of such rules for infor-mation transfer among members [3] in the presence of uncertainty [4] about what others nearby are doing. As the pairwise interactions, between any two birds in the flock, that underpin flock behaviour become more clear, interest is also shift-ing towards understandshift-ing the utility of flocks for purposes rangshift-ing from predator avoidance, navigation, and locomotor efficiency [5–8] and the effect of social dominance on interactions within the flock [9]. Some of the behaviou-ral details of these underlying tasks may in turn affect how pairwise and higher-order local rules may govern flocking behaviour.
Many generalized flocking models include the presence of local, spatially based interaction rules which explain the capacity for synchronization or con-sensus in the absence of leaders or other means of communication [2,10,11]. In some species of flocking birds, evidence for the existence of such rules has been demonstrated [9,12]. Here we use long duration (30 min), high temporal resolution (30 frames s21) three-dimensional tracks reconstructed from video recordings of a flock of1 800 chimney swifts (Chaetura pelagica) circling and landing in a chimney at dusk, to probe underlying local interaction rules and vari-ation in flock interactions and structure spatially and with time. We hypothesized
that, like European starlings (Sturnus vulgaris) [13], but unlike many other group behaviour models [1,2], chimney swift interaction rules are based on topological distance (e.g. then
nearest neighbours regardless of their distance) rather than physical distance (e.g. neighbours withinxm, regardless of number). We attempt to show this by computing conditional means of our bird interaction metric (similarity in three-dimensional heading) with respect to pairwise topological and physical distances. If the birds follow topological rules, this interaction metric should be mostly constant with respect to topological neighbour and independent of neighbour phys-ical distance, whereas the opposite would be true if the birds use physical distance rules. While this is a simpler approach than some maximum entropy models for flocking rules pro-posed [14], it is less computationally expensive (an important consideration given the size of our dataset), less sensitive to local variations which we hypothesize exist here owing to the chimney target, and takes advantage of the changes in flock density that occur during the continuous 30 min recording.
While local interaction rules are hypothesized to exist in the general case, we also expect that birds are subject to spatially and temporally variable cooperative and competitive press-ures, constantly balancing desired individual actions with those of the group [15]. The flock itself is, in essence, coopera-tive, in that the birds broadly share the same heading when at the same location and the overall circular flight pattern allows the birds to pass close to the chimney without experiencing the same degree of collision risk as would be the case if all birds converged directly on it. However, the limited opening diam-eter of the chimney results in a narrow navigational channel of limited capacity, suggesting that birds must compete to actu-ally enter it before sunset and achieve a favourable position within the roost. Thus, we hypothesize the existence of subsec-tions of the flock, especially approaching the chimney during landing, which are less cooperative than others. Alternatively, although we expect entry to the chimney to be competitive, chimney entry also appears to be the most challenging flight task within the flock, and could instead be a plausible location for highly cooperative direct leader–follower relationships, where one bird might follow another into the chimney. We test these hypotheses by spatially mapping the local similarity of heading and network metrics indicative of subgroups within the flock, to reveal regions of relatively greater or lesser cooperation, and by comparing the trajectories of birds enter-ing the chimney at the same time with those of birds passenter-ing through a nearby control volume.
2. Methods and materials
(a) Animals and video recording
We recorded freely behaving, wild chimney swifts (C. pelagica) in the
field as they entered an overnight roost in Raleigh, NC (127 West
Hargett Street, N358; 460; 41.368800, W788; 380; 29.934000) from a
van-tage point on the top of a nearby parking garage on 1 September 2014. Permission was secured to work at all private sites.
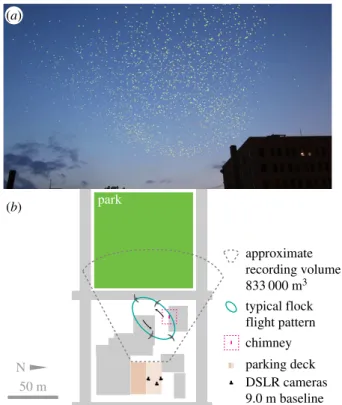
Recording generally followed previously published methods [16–18]. We filmed birds from a distance of 80–150 m using three Canon EOS 6D digital SLR cameras equipped with 35 mm f/1.2 lenses placed along a 9 m transect and staggered in height. These
cameras continuously recorded 1 9201 080 pixel video at 29.97
frames s21 through the evening. See figure 1 for an example
movie frame and schematic scene layout, and electronic supplemen-tary material, movie S1. The audio track of the recordings was used
to provide a time synchronization signal [18] distributed via a set of two-way portable radios (Motorola MH230R). Weather conditions
during the flock formation and entry were 26.78C, 82% relative
humidity, and wind speed less than 1.5 m s21. The cameras were
calibrated to allow reconstruction of three-dimensional position from the two-dimensional images. The bird trajectories were extracted using automated bird detection and track assignment rou-tines based on [19], see the electronic supplementary material, Methods for details. Also, electronic supplementary material, movies S2 and S3 show animations of the reconstructed flock from the camera and overhead views. Chimney entries were recorded whenever a bird track terminated within 1.25 m of the centre of the chimney top. The chimney opening was rectangular,
1.21.0 m and elevated 2.6 m above the top of the building.
(b) Individual bird and flock metrics
We computed several quantities which depended only on individual bird trajectories or on the flock considered as an unstructured group. These included the ground speed of the birds, their elevation above the chimney, the average radius of curvature of their flight path, the angular momentum of the whole flock, and the average distance to the nearest neighbour bird. Whole-flock angular momentum was computed by treating each bird as a 21.33 g point mass revolving around the flock cen-troid. The resulting quantity provides a combined measure of the number of birds present and the degree to which they are circling unidirectionally around the chimney. Nearest neighbour distance is the physical distance to the next closest bird; its average value quantifies flock density, while its distribution may be relevant to
local behavioural rules. Pairwise distances growO(n2) for each
frame analysed, thus the plotted distributions (figure 3) are for samples drawn from time slices used in network computations (§2d) or from the full dataset.
parking deck DSLR cameras 9.0 m baseline N
50 m
approximate recording volume 833 000 m3
typical flock flight pattern chimney
park
(a)
(b)
Figure 1.
(
a
) Example video frame shows the chimney, protruding from the
building in the lower right, and chimney swifts. The image was processed
with background subtraction to highlight the birds in yellow. See also
elec-tronic supplementary material, movie S1. (
b
) A schematic of the field set-up
shows the cameras on the parking deck, approximate imaging volume in two
dimensions, the chimney, and a typical late-evening flock pattern.
rspb.r
oy
alsocietypublishing.org
Pr
oc.
R.
Soc.
B
284
:
20162602
(c) Network construction and analysis
To characterize the behaviour of the flock as a set of individuals moving together we first computed the similarity in three-dimen-sional heading over the prior 45 video frames (i.e. 1.5 s of flight) for every possible pair of birds in each video frame subjected to
network analysis. Results were stored in matrixW, in whichWij
is the similarity of heading between theith andjth bird where 1.0
represents parallel and 0.0 anti-parallel headings. Thus,Was a
whole describes the flock interaction network at a single instant
in time, withWijspecifying the edge weight between theith and
jth birds in a time-varying social network. The network defined
byWin this manner has every bird connected to every other;
thresholding was used to keep edges with greater than 95% simi-larity in heading for downstream computations because these would otherwise be swamped by a huge number of weak connections. We investigated the effect of distance, both physical
and topological, on Wij by computing its average value for a
neighbourj at a given physical or topological distance from a
focal birdi. We also quantified the local similarity in heading
(trajectory alignment) as the summed thresholded weight,
or the sum of allWij.0.95, i.e. pairs with .95% similarity in
heading, for the reasons above.
In further network-based analysis, we trimmedWat the
high-est weight (i.e. greathigh-est similarity in heading) that left all birds connected in each time step. We then applied Suykens’
synchroni-zation-based algorithm [20] to W to construct a dendrogram
representing hierarchical clustering of the birds in each time step, for which we computed Newman’s weighted measure of
modular-ityQw[21] to identify the strength of association within the flock at
different group sizes. This measure,Qw, quantifies the difference in
summed edge weight between the observed grouping and a random grouping of the same size; the max-modularity group size is then a measure of the group size (i.e. number of individuals) that captures the largest share of organization. For analysis of spatially binned data (see below), we extended this concept to
define spatial modularity (Qs) by normalizing the max-modularity
group size to the number of birds present, thereby accommodating
flock regions with different bird densities. Larger values ofQwand
Qsindicate more, smaller groups than expected for the number of
birds present and smaller values indicate fewer, larger groups. Suykens’ algorithm [20] provides an estimate of branch length in addition to the dendrogram structure; this can be used to
compute the probability of observing a given group sizeaat the
merger of two branches, estimated within a time slice (§2d).a
quan-tifies the probability of reaching a certain group size at a given level in the dendrogram, and shows whether dendrogram structure is weighted to large groups near the tips or large groups closer to
the root. The dendrogram and the characteristic subgroup sizea
were used to investigate the impact of changes in flock density on flock structure. A full listing of equations to implement this analysis is provided in the electronic supplementary material, Methods.
(d) Temporal and spatial binning
We computed the individual bird and flock metrics for the entire dataset, but selected three 750-frame and one 500-frame (duration 25 and 17 s, respectively) time slices for the computationally expens-ive network construction and analysis. We analysed slices in which a large number of birds were present in the recording volume, and the flock used a single elliptical approach pattern throughout, rather than during transient events such as a reversal in direction around the chimney, a split into two separate approach patterns, or merging of two patterns into one. In each of these time slices, we quantified how the average bird metrics and the properties of the network varied spatially to address our hypothesis that the flock would become more competitive (i.e. less cooperative) near the chimney roost. This was accomplished by binning the birds by their angle
ufrom the mean centre of the flock ellipse in thex2yplane relative
to the chimney. We used bin sizes ofu¼2.58, aggregating the entire
time slice of flock activity and network metrics in each bin. For the network dendrogram analyses, we used 65 frames sampled from within each time slice owing to the even greater computational expense of this analysis. Several other computationally intensive analyses were conducted over a smaller sample of frames; details are presented with individual results.
(e) Leader – follower pairs at landing
In order to investigate our hypothesis that the final landing flights were composed of a leader and one or more followers, we identified landing events as bird tracks that terminated within a 1.25 m radius of the chimney. We compared results for these birds to an alternate set, birds that entered into a 1.25 m radius sphere placed 6 m above the actual chimney location. From each of these sets, we identified putative leader –follower pairs as birds that either landed or passed through the control volume within 10 frames (0.3 s) of one another. We also exam-ined the distribution of entry times at the chimney and control volume to see if chimney entries were clumped or distributed in time compared to elsewhere in the flock.
3. Results
(a) Individual-based results and the overall time course
of events
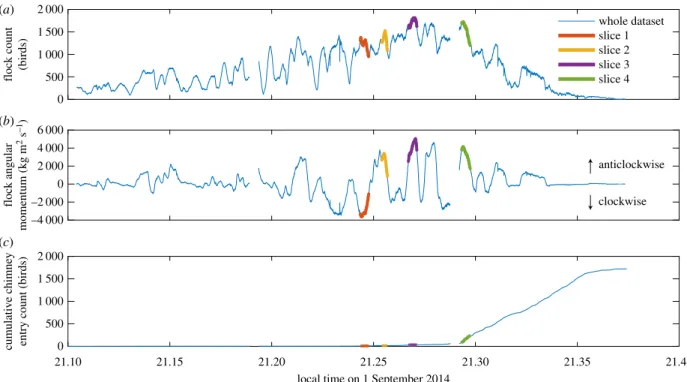
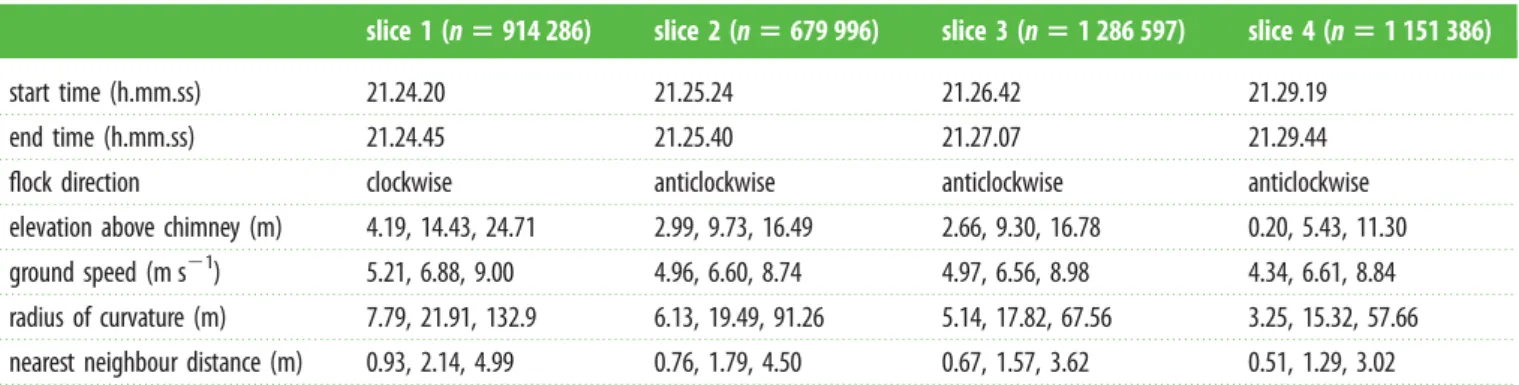
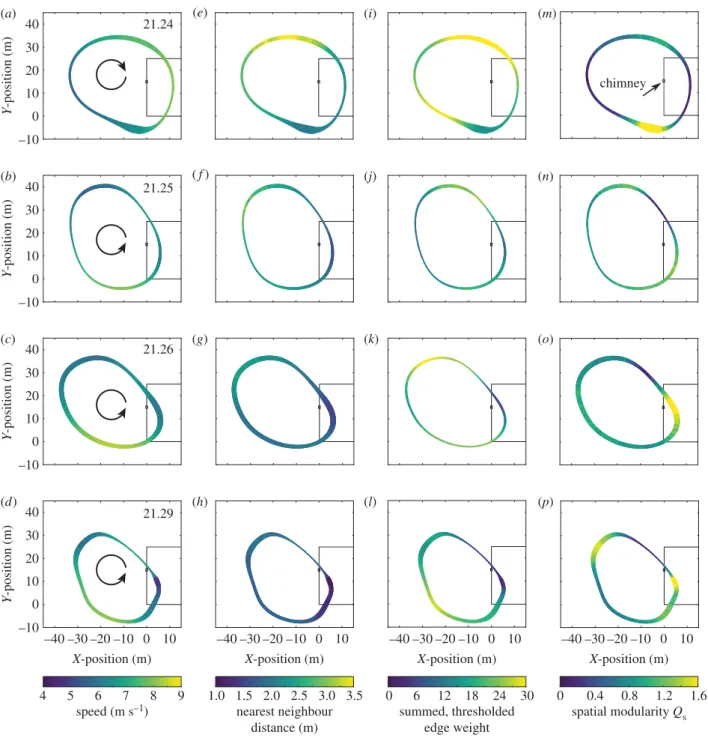
Figure 2 shows results from 1 September 2014. Swifts began gathering at the roost site at approximately 21.10, ordered cir-cling of the roost site began at 21.14, and the birds completed (or abandoned) chimney entry by 21.36, after a total of 1 720 were observed to enter the chimney. The size of the flock within the camera recording volume peaked at 1 817 birds at 21.27. The flock generally circled in a single elliptical loop with a long edge in the direction of the setting sun passing over the chimney roost. Birds on the far side of the loop from the chimney were usually approaching towards the cameras, whereas those on approach to the chimney were usually moving away from the camera (figure 1), though rotation reversed direction several times for unknown reasons. Table 1 provides the 5th, 50th, and 95th percentiles for elevation, flight speed, radius of curvature, and nearest neighbour dis-tance at the four time slices highlighted in figure 2. Flight speeds in the flock were approximately 6 m s21, substantially less than the approximately 12 m s21 reported for chimney swifts engaged in foraging [22]. Median nearest neighbour distance decreased with time but remained greater than 2 wingspan throughout.
(b) Evidence for local interaction rules and global
scaling
Figure 3 shows how physical and topological distance in the flock affectWij, the similarity in heading. In the case of physical
distance, the strength of the relationship varied with time but typically decreased for distances less than 1 m and was maxi-mal at a distance of 1.4 m (figure 3a); the distribution of maxima was normal and did not vary with nearest neighbour distance (figure 3b) or time. However, we found that the mean
Wijof the 1st, 5th, and 10th nearest neighbour decreased as the
physical distance to that neighbour increased (figure 3c). To reveal scaling of group size with flock density, we used the trimmed, weighted networks described above to obtain hierarchical information about the flock using Suykens’ algorithm [20] (see electronic supplementary
rspb.r
oy
alsocietypublishing.org
Pr
oc.
R.
Soc.
B
284
:
20162602
material, figure S4). Figure 4a shows the distribution of summed transition probabilities in reaching group size a, whereas figure 4b gives a versus the nearest neighbour distance for the 90% transect (dotted line in figure 4a) as a measure of the scaling between group size and nearest neighbour distance. Group size increased as the evening progressed (figure 4a dark on left, lighter on right) and as nearest neighbour distance decreased (figure 4b).
(c) Spatial and temporal variation in flock network
properties
As expected, virtually all properties of the flock from speed and nearest neighbour distance to summed network weight
and max-modularity group size vary spatially and temporally (figure 5). Speeds tend to be highest as the birds approach the building but then, aside from the earliest time slices, decrease once overflying it and approaching the chimney. Speed also remains largely constant through the different time slices (table 1), such that spatial variation in speed is larger than temporal variation. Some variation in speed may be due to local weather conditions; although reported as negligible, even a 1 m s21wind of consistent direction would produce a
detectable 2 m s21fluctuation in ground speed as birds circle
the landing site, assuming they maintain a constant airspeed. However, a comparison of clockwise and anticlockwise results (figure 5) suggests that this effect cannot explain all the observed variation.
pairwise physical distance (m)
weight (metric
ij
)
maximum weight distance (m)
weight (metric
ij
)
0 1 2 3 4 5
1.8
nearest neighbour distance (m) nearest neighbour distance (m)
nearest neighbour 5th n.n. 10th n.n.
1 2 3 4 1.0 1.5 2.0 2.5 3.0 3.5 4.0
0 0.2 0.4 0.6 0.8 1.0 1.2 1.4 1.6
0.70
2.5
1.5
0.5 0.75
0.80 0.85 0.90
0.95 0.95
0.65 0.70 0.75 0.80 0.85 0.90
(a) (b) (c)
Figure 3.
(
a
) Blue lines correspond to the left axis and are the smoothed average relationship between pairwise physical distance and heading similarity for all birds
in 62 frames pulled randomly from the four time slices. Smoothing was by spline with a local standard deviation tolerance. The right axis shows the probability
density scale for the histogram of maximum weight distances and its fitted normal distribution (m
¼
1.435183,
s
¼
0.354939)
5
wingspan; normality was
confirmed with an Anderson – Darling test (test statistic 0.313587,
p
.
0.15, null hypothesis of normality). The shaded region is the 95% CI for the mean. (
b
) The
maximum weight pairwise distance did not vary with mean nearest neighbour distance (
R
2¼
0.002315,
p
¼
0.710362). However, as shown by the trend lines in
(
c
), the average weight of the
n
th neighbour decreased with increases in nearest neighbour distance, (
R
¼
2
0.353969,
2
0.378956,
2
0.394210 for the nearest,
5th nearest, and 10th nearest neighbours, respectively;
p
¼
0.000112, 3.21440
10
25, and 1.42674
10
25). As expected, average weight also declined with
neighbour index. Data in (
c
) were computed from 114 samples of 100 consecutive frames across the full dataset.
local time on 1 September 2014
21.10 21.15 21.20 21.25 21.30 21.35 21.40
flock count
(birds)
flock angular
momentum (kg m
2 s
–1
)
cumulative chimney entry count (birds)
whole dataset 2 000
0 500
6 000 4 000 2 000
–4 000
2 000
0 –2 000 0 1 000 1 500
500 1 000 1 500
slice 1 slice 2 slice 3 slice 4
anticlockwise
clockwise
(a)
(b)
(c)
Figure 2.
Flock count (
a
), the number of individual birds in the recording volume at a particular time, (
b
) flock angular momentum, and (
c
) the cumulative entry of
birds into the chimney. Flips in the angular momentum sign denote reversals in the circling direction. The four highlighted slices were used in the network analysis
and related metrics given in table 1. Gaps in the data occurred when the cameras closed one movie file and began another during recording.
rspb.r
oy
alsocietypublishing.org
Pr
oc.
R.
Soc.
B
284
:
20162602
Nearest neighbour distance tends to be greatest at points furthest from the chimney and least near the chimney, especially in the later time slices as the flock height decreases and the birds get closer to the landing site (figure 5e–h). Nearest neighbour distance for the whole flock decreases with time, and the magnitudes of the spatial and temporal differences are approximately similar. For the four time slices considered as a whole, speed and nearest neighbour distance are unrelated to one another except at the smallest distances where they are positively correlated (electronic supplementary material, figure S5).
Local similarity in heading, computed as the summed thres-holded weight for edges with weights .0.95, is typically least near the chimney (dark, thin sections at approaches to chim-ney, bottom right corners of panels figure 5i–l) and highest opposite it (light bands past the chimney and in the return path). This broadly coincides with patterns in flight speed and nearest neighbour distance; high thresholded edge weight is positively correlated with speed (electronic supplementary material, figure S6) and nearest neighbour distance (electronic supplementary material, figure S7). Speed and nearest neigh-bour distance themselves are uncorrelated in these data (electronic supplementary material, figure S5), thus effects on local similarity in heading (i.e. summed thresholded weight) are additive.
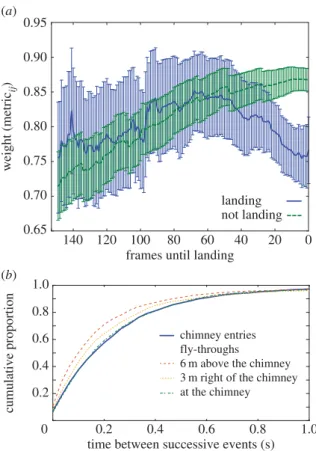
(d) Leader – follower pairs at landing
Figure 6ashows the average network weight and its 95% CI for pairs of birds that either enter the chimney or pass through a control volume at nearly the same time. Non-landing pairs exhibited a monotonically increasing heading similarity as they approached the control volume while landing pairs exhib-ited a peak similarity approximately 70 frames before entry which then declined as they approached the chimney. The dis-tribution of time between successive landing events was also similar to the distribution between fly-through events at several other locations near the chimney (figure 6b).
4. Discussion
We found that, contrary to our initial hypothesis, the chimney swift local interaction rules are more consistent with physical distance metrics (e.g. align to all birds between 1.5 and 3.0 m distant) rather than topological metrics (e.g. align to the closest seven birds). As discussed below, this may allow the swifts to better accommodate the fluctuations in density that occur as the birds approach the chimney roost. We also found substantial spatial variation in several flock network metrics (figure 5), including local similarity in heading (quan-tified as summed thresholded edge weight) and spatially 1.0
fraction
0.4 0.5 0.6 0.7 0.8 0.9 21.24
21.30 21.29
local time (hh.mm)
0 20 40 60 80 100 1.0 1.5 2.0 2.5 3.0
21.28 21.27 21.26 21.25
80
75
a
(count)
a(count) nearest neighbour distance (m) 45
50 55 60 65 70
(a) (b)
Figure 4.
Scaling of group sizes within the flock dendrogram. Panel (
a
) shows the summed transition probabilities reaching group size
a
computed for 24 different
temporally close samples of dendrograms gathered from regions of 65 consecutive frames in all four time slices. Panel (
b
) shows a linear fit to the highest integer
a
such that the summed transition probabilities are
,
0.9,
R
¼
2
0.540670,
p
¼
0.006375; the fit produced residuals with an estimated mean
m
¼
1.421085
10
214and an Anderson – Darling test for normality was performed which yielded a statistic of 0.268692,
p
0
:
15 (null hypothesis of normality).
Table 1.
Simple whole-flock quantities.
slice 1 (
n
5
914 286)
slice 2 (
n
5
679 996)
slice 3 (
n
5
1 286 597)
slice 4 (
n
5
1 151 386)
start time (h.mm.ss)
21.24.20
21.25.24
21.26.42
21.29.19
end time (h.mm.ss)
21.24.45
21.25.40
21.27.07
21.29.44
flock direction
clockwise
anticlockwise
anticlockwise
anticlockwise
elevation above chimney (m)
4.19, 14.43, 24.71
2.99, 9.73, 16.49
2.66, 9.30, 16.78
0.20, 5.43, 11.30
ground speed (m s
21)
5.21, 6.88, 9.00
4.96, 6.60, 8.74
4.97, 6.56, 8.98
4.34, 6.61, 8.84
radius of curvature (m)
7.79, 21.91, 132.9
6.13, 19.49, 91.26
5.14, 17.82, 67.56
3.25, 15.32, 57.66
nearest neighbour distance (m)
0.93, 2.14, 4.99
0.76, 1.79, 4.50
0.67, 1.57, 3.62
0.51, 1.29, 3.02
Flock direction is specified as in an overhead view (figure 1
b
). Triplet results are the 5th, 50th, and 95th percentiles, compiled directly from the entire set
of data points in the slice rather than from individual bird means.
rspb.r
oy
alsocietypublishing.org
Pr
oc.
R.
Soc.
B
284
:
20162602
localized group size and number (quantified as spatial modu-larity,Qs). For both these metrics, cooperation declined as the
birds approached the chimney and increased immediately after a chimney flyby. We found no support for leader– follower pairs entering the chimney. Indeed, the opposite was true and birds that enter the chimney at similar times do so with significantly less well-aligned flight headings than birds that enter into (and fly through) a nearby control volume.
(a) Groups and flock behavioural characteristics
We found that the physical distance at which two birds had, on average, maximal heading similarity did not vary with flock density as expressed by nearest neighbour distance (figure 3). This was the case even though the average nearestneighbour distance itself was both larger and smaller than the distance of maximal heading similarity at different times during the recording period (figure 3a,b, drawn from 62 frames subsampled from the four time slices analysed using network methods). Given this result, it must also be the case that the average weight of the nth nearest neighbour should vary with physical distance. This was verified to be true in a non-overlapping set of data that were used for the physical distance result (figure 3c, drawn from 114 100-frame samples from the full dataset). Thus, our analysis supports the presence of physical distance based interaction rules that are the basis of many generalized flock-ing models [1,2]. To the best of our knowledge, there has been no investigation as to how observable groups derived from an alignment metric change with the density of agents.
4 5 6 7 8 9 1.0 1.5 2.0 2.5 3.0 3.5
speed (m s–1) nearest neighbour
distance (m)
summed, thresholded edge weight
spatial modularity Qs
–40 –30 –20 –10 0 10
–40 –30 –20 –10 0 10
–40 –30 –20 –10 0 10 –40 –30 –20 –10 0 10
X-position (m) X-position (m) X-position (m) X-position (m)
40
30
20
10
0
–10
40
30
20
10
0
–10
40
30
20
10
0
–10
40
30
20
10
0
–10
Y
-position (m)
Y
-position (m)
Y
-position (m)
Y
-position (m)
0 6 12 18 24 30 0 0.4 0.8 1.2 1.6
21.24
21.25
21.26
21.29
chimney (a)
(b) (j) (n)
(i) (m)
(c) (k) (o)
(d) (h) (l) (p)
(e)
(g) (f)
Figure 5.
The flock properties change over time and space. Each panel shows the local average per-bird value of a flock property during a time slice, shown along
the average flock path for that slice. Time slice varies by row, ranging from flock marshalling (top) to chimney entry (bottom figure 2). Columns 1 – 4 show, from left
to right: speed, nearest neighbour distance, summed thresholded edge weight, and spatial modularity. Flock circling direction is shown in column 1. The chimney
building is shown in outline on the right side of the plots and the chimney itself is marked by a small open square. The width of the ribbon indicates the number of
observations in each spatial bin.
rspb.r
oy
alsocietypublishing.org
Pr
oc.
R.
Soc.
B
284
:
20162602
However, we expect the scaling of observable groups with agent density, as we have observed, would also be consistent with these models. Chimney swifts appear to form relatively larger subgroups at high density, and smaller subgroups at low density (figure 4), i.e. the interaction rules allow for stable flock structures as bird density changes. This might be paramount in a species such as swifts where flock density varies widely in space and time owing to the presence of a focal point at the chimney and arrival of new birds at the roosting site.
Our results do not support any fixed sized topological interaction rules, and support for this hypothesis in other bird species [13] could indicate varying degrees of adaptation for flocking among bird species. The swifts as a whole are well-aligned with their nearest neighbour and higher-index neighbours. However, the degree of alignment to the ith neighbour varies with distance to that neighbour as expected under physical distance behavioural rules (figures 3cand 4b), so that even if swifts limit their interaction to a finiten neigh-bours, the strength of the interaction is weighted by physical distance. For this reason, topological and physical distance metrics are difficult to differentiate without large datasets of varying animal density, possibly explaining support for topological rules recently noted in studies with much smaller groups (15– 86) [23].
(b) There are regions where the flock is more/less
cooperative
As shown in figure 5i–l, summed thresholded edge weight (an indication of local similarity in heading) exhibits striking spatial variation, the range of which increases with time. The lowest weight region, especially pronounced in the third and fourth time slices after birds begin landing, is just ahead of the chimney and also after it along the typical anticlockwise flock path. This is consistent with our hypothesis that the birds compete for landing trajectories; individually idiosyn-cratic landing trajectories will not have similar headings, producing low weights and leaving few edges above the threshold (thin dark lines in figure 5i–l) and the average weight between pairs of birds that enter the chimney at simi-lar times is less than that of birds passing through a nearby but non-landing region at similar times (figure 6).
Summed thresholded edge weight tends to be higher when the birds are far from the chimney and when they are flying faster (thick, lighter lines in figure 5i–l). Flight speed itself might promote cooperative behaviour, quantified here as greater similarity in heading and thus greater edge weight, because speed varies more widely than nearest neighbour distance, so faster flying swifts in the flock may need to behave more consistently with respect to their neighbours to reduce the likelihood of collisions. Speed was spatially inde-pendent of nearest neighbour distance for distances above approximately 1.7 m, but average nearest neighbour distance was positively spatially correlated with summed thresholded edge weight, possibly because larger distances between birds reduce the need for avoidance manoeuvres that reduce flight heading similarity and thus edge weight.
A similar pattern of more/less cooperative spatial regions is indicated by network spatial modularity (Qs), which reveals
high modularity (i.e. a tendency towards many, small groups) in two spots: directly before the chimney and directly opposite it (figure 5m–p). These regions are surrounded by low modu-larity regions (directly after the chimney and its opposite). Whereas the consensus towards a circular shape of the flock allows for multiple passes in the case of failure to land as well as solidifying a common approach trajectory, the consen-sus towards a cyclical pattern of modularity minimizes global coordination at two decision points–landing and turning back towards the landing site—while maximizing it during the transport sides of the circle, either away from or towards the chimney.
(c) Future work
Here we examined properties of the swift landing flock when the birds were engaged in constant direction circles as part of a simple, toroidal flock. We also observed the flock reversing direction and shifting from a circular to figure-eight pattern. We do not know why these qualitative shifts in whole-flock behaviour occurred or how they are coordinated, but believe they represent one of many potentially fruitful avenues for further investigation.
Ethics.All work was approved by the Animal Care and Use Commit-tee of the University of North Carolina ( protocol no. 12-186.0). Data accessibility.Supporting data can be accessed from the Dryad Digi-tal Repository: http://doi.org/10.5061/dryad.p68f8 [24]. Data are provided as the smoothed tracks and their velocities in an HDF5 file and include the following:time;tid;x;y;z;x_;y_;z_. The Python pro-grams used to preprocess and generate networks are available at
frames until landing 0.95
0.90
0.85
0.80
0.75
0.70
0.65
0 20 40 60 80 100 120 140
0.2 0.4 0.6 0.8 1.0
weight (metric
ij
)
time between successive events (s) 0
0.2 0.4 0.6 0.8 1.0
cumulative proportion
chimney entries fly-throughs
6 m above the chimney 3 m right of the chimney at the chimney
landing not landing (a)
(b)
Figure 6.
Properties of birds at landing. (
a
) Compares the network weights
of pairs
W
ijof landing and non-landing birds through time. Pairs either land
or, for non-landing birds, enter a control volume 6 m above the chimney
within 10 video frames of one another. Lines show the mean and 95%
CIs;
n
¼
65 pairs for landing and 171 for non-landing. Panel (
b
) shows
the cumulative distribution of time intervals between successive landing
events or birds flying through three different control regions. In this case,
the volume of the control region target was adjusted to give equal
number of individuals in all landing and non-landing cases. All results are
from the last time slice, which contains the majority of landing events
observed (figure 2).
rspb.r
oy
alsocietypublishing.org
Pr
oc.
R.
Soc.
B
284
:
20162602
http://bitbucket.org/devangel77b/mswarm5; codes for network analyses are at http://bitbucket.org/devangel77b/mnetwork; both are intended to be run in parallel on a cluster.
Author’s contributions.D.E. and T.H. conceived and designed the study, developed the field methods and tracking, and collected field data. D.E. and D.R. developed the network analysis codes and basic analyses methods with assistance from T.H. and S.R. D.R. developed detailed network analyses with discussion from T.H., D.E., and S.R. D.E., D.R., S.R., and T.H. helped draft, review, and revise the manuscript and gave final approval for publication.
Funding. This work was supported by IOS 1253276 (to T.H.) and ONR N0001410109452 (to T.H. and eight others), and ONR N0001417WX00158 (to D.E.). Views in this article do not necessarily
represent the views of the Office of Naval Research, US Naval Academy, or US Government.
Acknowledgements.We thank the Raleigh News and Observer; J. Connors, J. Gerwin and the Wake Audubon Society; and Hunter and Associates, Raleigh, NC. We thank the following for their support and assistance: B. Jackson, P. Khandelwal, J. Rader, R. Shelton, N. Deluga, N. Roach, E. Bluhm, K. Sholtis, J. Martinez-Blat, A. Omerspahic and A. Lohmann. We also thank M. Betke, D. Theriault, N. Fuller, K. Morgansen, J. Ballieul, Z. Wu, S. Kane, I. Yeaton, and Y. Munk for discussion of preliminary results and K. Morgansen, J. Usherwood, and B. Taylor for reading early versions of the manuscript. We also thank D. Costa, J Hutchinson, and two anonymous reviewers for comments which were incorporated into the manuscript.
References
1. Cucker F, Smale S. 2007 Emergent behavior in flocks.IEEE Trans. Autom. Control52, 852 – 862. (doi:10.1109/TAC.2007.895842)
2. Vicsek T, Cziro´k A, Ben-Jacob E, Cohen I, Shochet O. 1995 Novel type of phase transition in a system of self-driven particles.Phys. Rev. Lett.75, 1226. (doi:10.1103/PhysRevLett.75.1226)
3. Bialek W, Cavagna A, Giardina I, Mora T, Silvestri E, Viale M, Walczak AM. 2012 Statistical mechanics for natural flocks of birds.Proc. Natl Acad. Sci. USA109, 4786 – 4791. (doi:10.1073/pnas.1118633109) 4. Young GF, Scardovi L, Cavagna A, Giardina I,
Leonard NE. 2013 Starling flock networks manage uncertainty in consensus at low cost.PLoS Comput. Biol.9, e1002894. (doi:10.1371/journal.pcbi. 1002894)
5. Codling E, Pitchford J, Simpson S. 2007 Group navigation and the ‘many-wrongs principle’ in models of animal movement.Ecology88, 1864 – 1870. (doi:10.1890/06-0854.1) 6. Usherwood JR, Stavrou M, Lowe JC, Roskilly K,
Wilson AM. 2011 Flying in a flock comes at a cost in pigeons.Nature474, 494 – 497. (doi:10.1038/ nature10164)
7. Portugal SJ, Hubel TY, Fritz J, Heese S, Trobe D, Voelkl B, Hailes S, Wilson AM, Usherwood JR. 2014 Upwash exploitation and downwash avoidance by flap phasing in ibis formation flight.Nature505, 399 – 402. (doi:10.1038/nature12939)
8. Procaccini Aet al. 2011 Propagating waves in starling,Sturnus vulgaris, flocks under predation. Anim. Behav.82, 759 – 765. (doi:10.1016/j.anbehav. 2011.07.006)
9. Nagy M, A´kos Z, Biro D, Vicsek T. 2010 Hierarchical group dynamics in pigeon flocks.Nature464, 890 – 893. (doi:10.1038/nature08891) 10. Reynolds CW. 1987 Flocks, herds and schools:
a distributed behavioral model.ACM SIGGRAPH
Comp. Graph.21, 25 – 34. (doi:10.1145/37402. 37406)
11. Ha SY, Jeong E, Kang MJ. 2010 Emergent behaviour of a generalized Viscek flocking model.Nonlinearity
23, 3139. (doi:10.1088/0951-7715/23/12/008) 12. Hemelrijk CK, Hildenbrandt H. 2015 Diffusion and
topological neighbours in flocks of starlings: relating a model to empirical data.PLoS ONE10, e0126913. (doi:10.1371/journal.pone.0126913)
13. Ballerini Met al. 2008 Interaction ruling animal collective behavior depends on topological rather than metric distance: evidence from a field study. Proc. Natl Acad. Sci. USA105, 1232 – 1237. (doi:10. 1073/pnas.0711437105)
14. Giardina A, Giardina I, Ginelli I, Mora F, Piovani T, Tavarone D, Walczak R, Cavagna AM. 2014 Dynamical maximum entropy approach to flocking.Phys. Rev. E
89, 042707. (doi:10.1103/PhysRevE.89.042707) 15. King AJ, Cowlishaw G. 2009 Leaders, followers, and
group decision-making.Commun. Integr. Biol.2, 147 – 150. (doi:10.4161/cib.7562)
16. Hedrick TL. 2008 Software techniques for two-and three-dimensional kinematic measurements of biological and biomimetic systems.Bioinspir. Biomim.
3, 034001. (doi:10.1088/1748-3182/3/3/034001) 17. Theriault DH, Fuller NW, Jackson BE, Bluhm E, Evangelista D, Wu Z, Betka M, Bluhm E. 2014 A protocol and calibration method for accurate multi-camera field videography.J. Exp. Biol.217, 1843 – 1848. (doi:10.1242/jeb.100529)
18. Jackson BE, Evangelista DJ, Ray DD, Hedrick TL. 2014 3D for the people: multi-camera motion capture in the field with consumer-grade cameras and open source software.Biol. Open5, 1334 – 1342. (doi:10.1242/bio.018713) 19. Wu Z, Hristov NI, Hedrick TL, Kunz TH, Betke M.
2009 Tracking a large number of objects from multiple views. InComputer Vision, 2009 IEEE 12th
Int. Conf. on. IEEE;2009, Kyoto, Japan, 27 September – 4 October, p. 1546 – 1553. 20. Lou X, Suykens JA. 2011 Finding communities in
weighted networks through synchronization.Chaos
21, 043116. (doi:10.1063/1.3655371)
21. Newman ME. 2004 Analysis of weighted networks. Phys. Rev. E70, 056131. (doi:10.1103/PhysRevE. 70.056131)
22. Schnell GD, Hellack JJ. 1978 Flight speeds of brown pelicans, chimney swifts, and other birds. Bird-banding49, 108 – 112. (doi:10.2307/4512338) 23. Brace NL, Hedrick TL, Theriault DH, Fuller NW, Wu Z,
Betke M, Parrish JK, Gru¨nbaum D, Morgansen KA. 2016 Using collision cones to assess biological deconfliction methods.J. R. Soc. Interface13, 20160502. (doi:10.1098/rsif.2016.0502) 24. Evangelista D, Ray D, Raja S, Hedrick TL. 2016
Three-dimensional trajectories and network analyses of group behaviour within chimney swift flocks during approaches to the roost. Dryad Digital Repository. See http://doi.org/10.5061/dryad.p68f8. 25. Bradski Get al. 2000 The OpenCV library.Doctor
Dobbs J.25, 120 – 126.
26. Lourakis MI, Argyros AA. 2009 SBA: A software package for generic sparse bundle adjustment.ACM Trans. Math. Softw.36, 2. (doi:10.1145/1486525.1486527) 27. Kuhn HW. 1955 The Hungarian method for the
assignment problem.Naval Res. Logist. Q.2, 83 – 97. (doi:10.1002/nav.3800020109) 28. Dalcin L, Paz R, Storti M. 2005 MPI for Python.
Journal of Parallel and Distrib. Comput.65, 1108 – 1115. (doi:10.1016/j.jpdc.2005.03.010) 29. Hagberg AA, Schult DA, Swart PJ 2008 Exploring
network structure, dynamics, and function using NetworkX. InProc. the 7th Python in Science Conf. (SciPy2008).Pasadena, CA USA;2008. pp. 11 – 15. 30. Collette A. 2013Python and HDF5. Sebastopol, CA:
O’Reilly.