-
LATENT PROFILE ANALYSIS AND CONVERSION TO PSYCHOSIS: CHARACTERIZING SUBGROUPS TO ENHANCE RISK PREDICTION
Kristin M. Healey
A dissertation submitted to the faculty at the University of North Carolina at Chapel Hill in partial fulfillment of the requirements for the degree of Doctor of Philosophy in the Department
of Psychology and Neuroscience (Clinical Psychology).
Chapel Hill 2016
Approved by: David Penn
ABSTRACT
Kristin M. Healey: Latent profile analysis and conversion to psychosis: Characterizing subgroups to enhance risk prediction
(Under the direction of David L. Penn)
Background: Groups at clinical high risk (CHR) of developing psychosis are
heterogeneous, composed of individuals presenting with several different clusters of diagnostic symptoms (e.g., affective symptoms, anxiety symptoms, subpsychotic symptoms). It is likely that there are subgroups within those at CHR, each associated with different constellations of symptoms and associated probabilities of conversion.
Method: Latent Profile Analysis (LPA) has shown promise in identifying subgroups with clinically useful profiles of risk indicators among CHR individuals. The current study used a LPA model to ascertain subgroups in a combined sample of CHR (n = 171) and help-seeking controls (HSC; n = 100). Indicators in the LPA model included baseline Scale of Prodromal Symptoms (SOPS), total depressive symptoms (CDSS), and neurocognitive performance. Subgroups were further characterized using covariates measuring demographic and clinical features. General linear mixed models for repeated measures were used to examine within group change over time and longitudinal subgroup comparisons on a measure of social functioning.
Results: LPA resulted in three classes: class 1 (mild) had the lowest transition risk (5.6%), the lowest scores across SOPS symptoms and depression scores, and intact
symptoms, neurocognitive impairment, and social cognitive impairment. Classes 2 and 3 evidenced similarly poor social functioning.
Conclusions: Results support a subgroup approach to the research, assessment, and treatment of help seeking individuals. Three classes emerged with good separation on a majority of indicator variables, including a class that may be an early manifestation of the deficit subtype. Development of efficacious treatments for early neurocognitive deficits and negative symptoms are indicated. Results underline the profound social dysfunction across help seeking individuals and need for improved treatments.
TABLE OF CONTENTS
LIST OF TABLES……….vii
LIST OF FIGURES….……….viii
LIST OF ABBREVIATIONS……….ix
Introduction………..………1
The Prodromal State………3
Definition and Assessment of the Prodromal State……….3
Potential Subgroups in CHR Populations………5
Latent Profile Methods in CHR………...8
Predictors of Conversion to Psychosis………...11
Clinical Characteristics………...12
Mood Symptoms………15
Neurocognitive Ability………...17
Covariates Characterizing CHR Subgroups………...21
Social Cognition……….21
Internalized Stigma………22
Substance use……….23
Racial and Ethnic Background………...24
Premorbid Functional Ability………26
Functional Trajectory……….28
Aims & Hypotheses………...30
Exploratory Aims………...33
Methods………..34
Sample………34
Procedures………..35
Follow-up Assessments……….36
Measures………37
Symptom measures………37
Clinical high risk (CHR) symptomatology and criteria……….37
Conversion……….38
Substance use……….38
Mood symptomatology………..38
Internalized stigma……….39
Social Cognition Measures………40
Theory of mind (ToM).………..40
Emotion perception (EP) …...………40
Functioning Measures………41
Social functioning………..……41
Role functioning………42
Premorbid functioning………...42
Neurocognitive measures………...43
Data Analyses………45
Aims & Hypotheses………...47
Exploratory Analyses………...50
Results………51
Primary Analyses………...51
Latent profile analysis (LPA).………....51
LPA model selection.………...51
Classes and risk probability.………...53
Kaplan-Meier survival curve.………....53
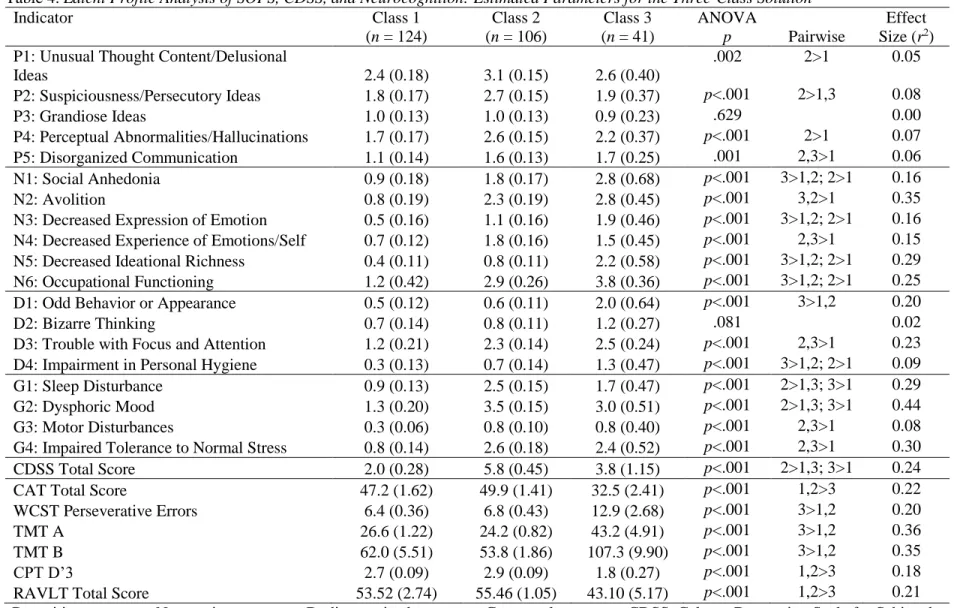
Characteristics of the three-class solution.……….55
Characterizing the three-class solution with covariates.……….……...57
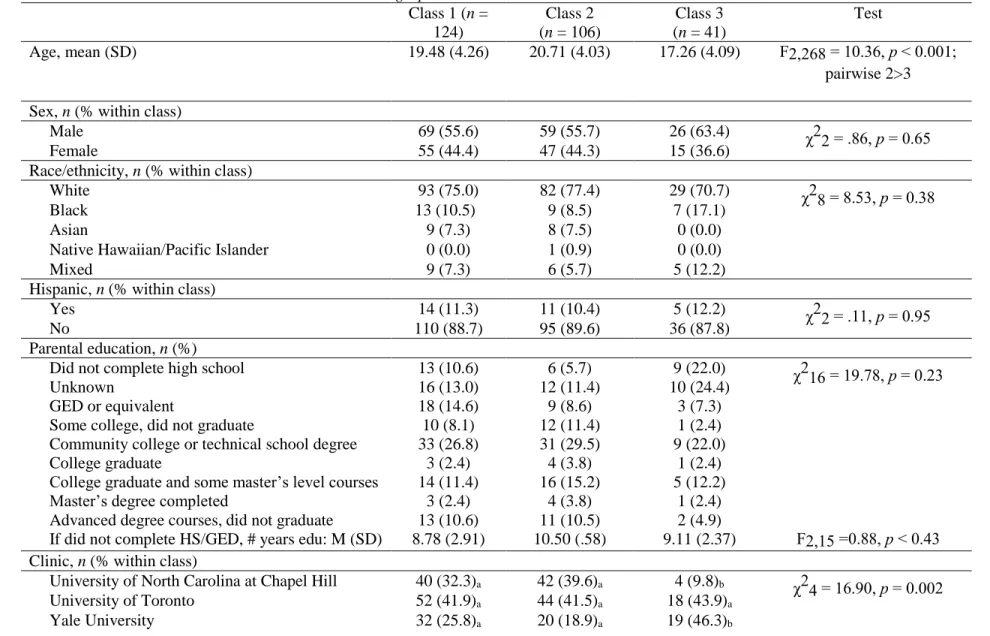
Demographic characteristics.……….57
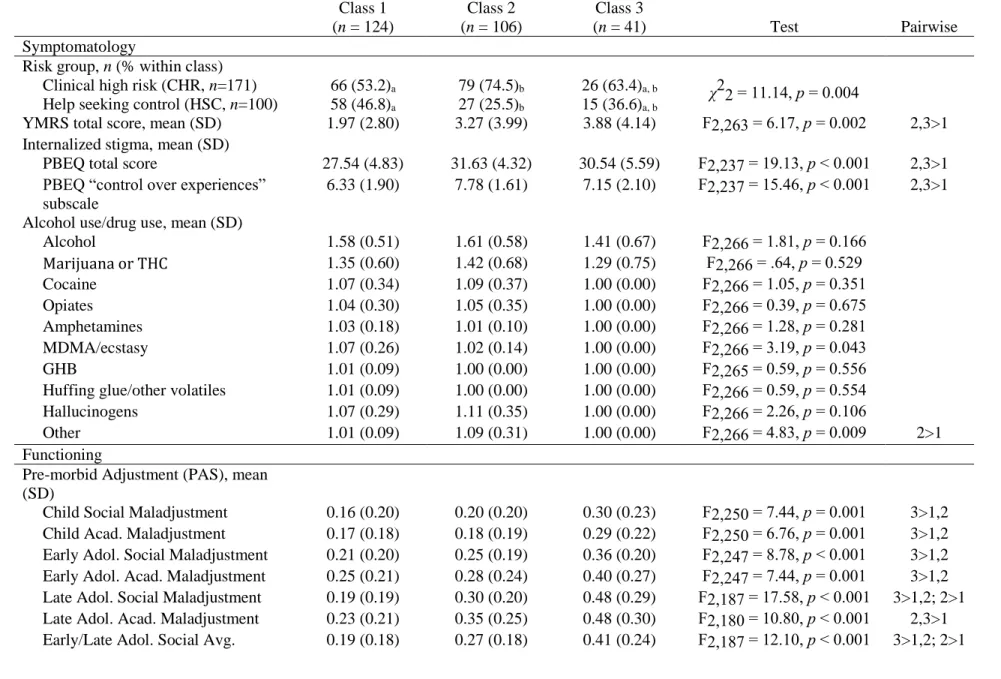
Clinical characteristics.………..58
Functioning.………...59
Social cognition.………...60
Intelligence.………...61
Functional trajectory of subgroups.………...61
Exploratory Analyses.……….………...62
Contribution of covariates to group membership.……….62
Discussion………..67
Rate of Transition to Psychosis.………...72
Further Characterizing Subgroups with Covariates.………..75
Social Functioning Trajectory Within and Across Classes.………...81
Limitations and Strengths.……….………..………..83
Future Directions and Treatment Implications.………...85
Conclusions………...87
APPENDIX A: SCHEDULE OF ASSESSMENTS………….………...89
APPENDIX B: REASONS FOR DROP OUT………...………...90
APPENDIX C: CLINICAL STAGING MODEL OF PRODROMAL PREVENTION…...……….………...………...91
APPENDIX D: DSM-IV DIAGNOSIS AT CONVERSION………...92
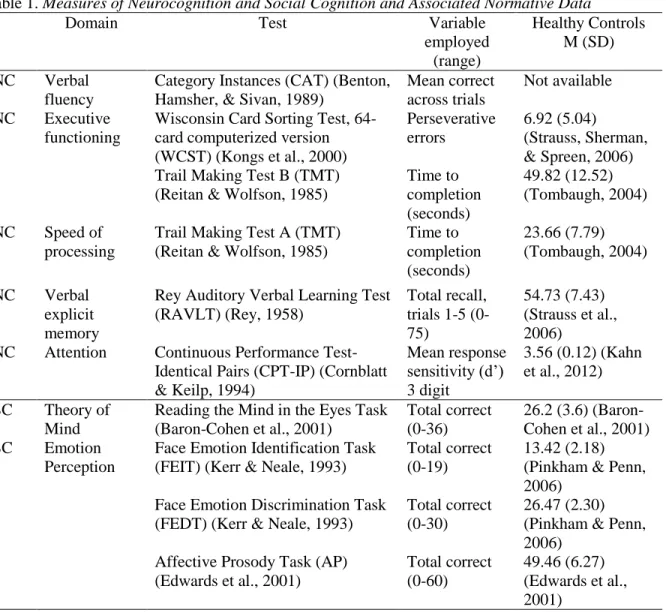
LIST OF TABLES Table 1. Measures of Neurocognition and Social Cognition and
Associated Normative Data……….114 Table 2. Fit Indices and Class Sizes for the Latent Profile Analysis of SOPS
Symptom Scores, CDSS Total Score, and Neurocognitive Scores……….115 Table 3. Latent Class Membership Based Upon Estimated
Posterior Probabilities……….116 Table 4. Latent Profile Analysis of SOPS, CDSS, and Neurocognition:
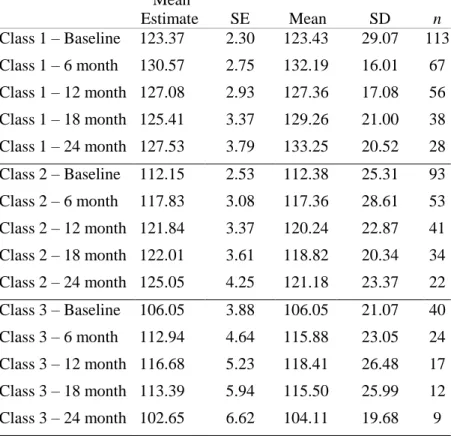
Estimated Parameters for the Three-Class Solution…………...……….117 Table 5. Associations Between Latent Classes and Demographic Characteristics………...…..118 Table 6. Associations Between Classes and Covariates…………...…………..……….119 Table 7. Descriptive Statistics and Mean Estimates of SFS by Class,
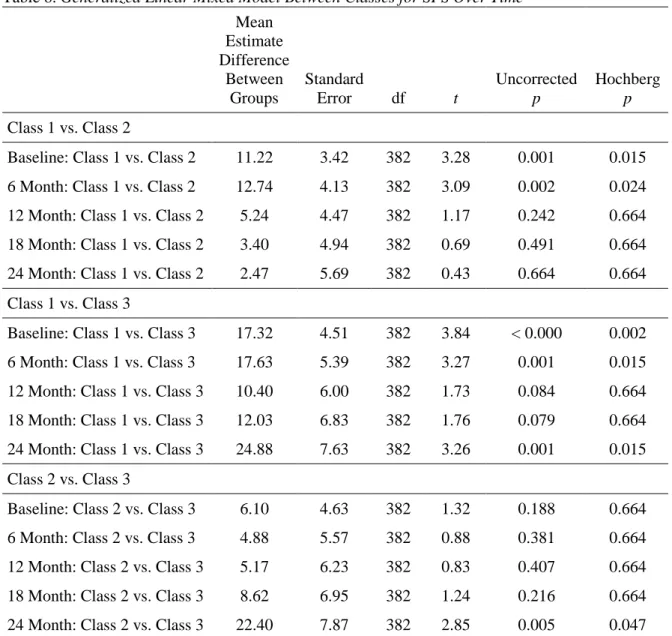
Across Time Points……….……….121 Table 8. Generalized Linear Mixed Model Between Classes for
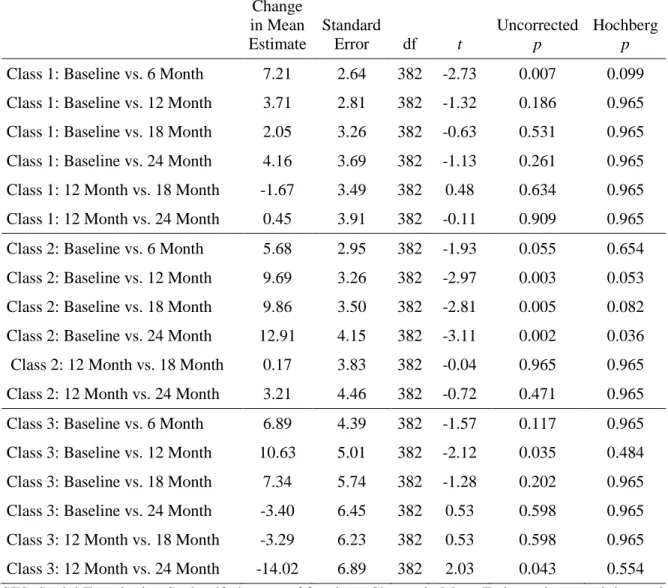
SFS Over Time………122 Table 9. Generalized Linear Mixed Model Within Group
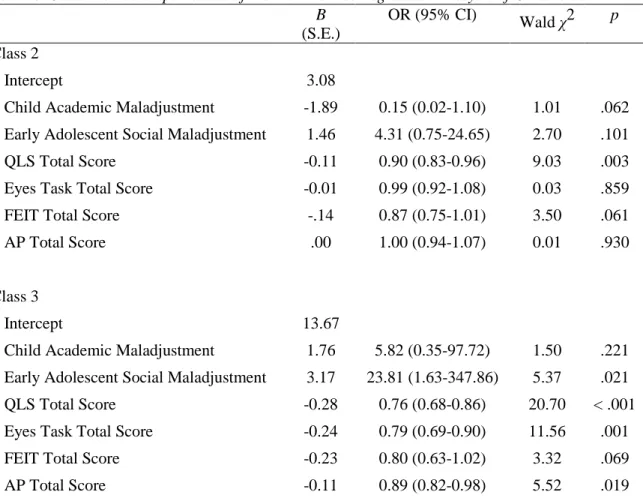
Analysis for SFS Over Time………...……….………123 Table 10. Class Membership: Results of the Multinomial
Regression Analysis of Covariates………...………..……….……124 Table 11. Modeled Probability (%) of Being Assigned to a Class
LIST OF FIGURES
Figure 1. Scree Plots………..……….…….………126 Figure 2. Kaplan-Meier Survival Plot of transition to psychosis within
5 years of referral….………...……….…………127 .
Figure 3. Latent profile plot of Scale of Prodromal Symptoms (SOPS) items and Calgary
LIST OF ABBREVIATIONS AIC Akaike’s Information Criteria ANCOVA Analysis of covariance
ANOVA Univariate analyses of variance AP Affective Prosody Task
BIC Bayesian Information Criteria BLRT Bootstrapped Likelihood Ratio Test CAT Category instances
CDSS Calgary Depression Scale for Schizophrenia CHR Clinical high risk
CPT-IP Continuous Performance Test-Identical Pairs
DSM Diagnostic and Statistical Manual of Mental Disorders EP Emotion perception
FEDT Face Emotion Discrimination Task FEIT Face Emotion Identification Task HSC Help seeking control
IQ Intelligence quotient LPA Latent profile analysis
LVMM Latent variable mixture modeling PAS Premorbid Adjustment Scale
PREDICT Enhancing the Prospective Prediction of Psychosis QLS Heinrichs-Carpenter Quality of Life Scale
RAVLT Rey Auditory Verbal Learning Test SFS Social Functioning Scale
ssa BIC Sample-size adjusted Bayesian information criteria TMT Trail Making Test
ToM Theory of mind UC Unaffected control
Introduction
The present study investigated a novel latent profile analysis (LPA) methodology to better understand latent subgroups among a heterogeneous group of individuals at clinical high risk (CHR) of developing psychosis. Subgroups have the potential to enhance specificity in predicting who among CHR individuals is at risk of transitioning to a frank psychotic disorder. Early detection and intervention in emerging psychosis is critical to the aim of reducing societal burden associated with psychotic spectrum illnesses. The development of schizophrenia and other psychotic disorders is often associated with significant impairment in individuals
diagnosed with schizophrenia, the cost of which amounts to an estimated $30 billion per year and is likely as a result of decline in social and role functioning (Wu et al., 2002). Early intervention may aid in both prevention of frank psychosis and amelioration of dysfunction that precedes the onset of psychosis. To this end, it is crucial to develop both sensitive and specific criteria that enable early identification that generalizes to clinical settings. While current at-risk criteria are the most reliable predictors of psychosis at present, research thus far indicates that such models need improvement (for a review, see Fusar-Poli, Borgwardt, et al., 2013).
developing a psychotic disorder is evenly distributed throughout CHR individuals (Hagenaars & McCutcheon, 2002). However, CHR groups are psychopathologically heterogeneous, composed of individuals presenting with several different clusters of diagnostic symptoms (e.g., affective symptoms, anxiety symptoms, subpsychotic symptoms) (e.g., Fusar-Poli, Bechdolf, et al., 2013; Salokangas et al., 2012; Wigman et al., 2012). It is likely that there are subgroups within the heterogeneous CHR group, each associated with different constellations of symptoms and associated probabilities of conversion. LPA models may ascertain such subgroups and provide a more accurate model of who is truly at risk of developing schizophrenia, resulting in a clinically useful profile of risk indicators.
The introduction will provide an overview of the most relevant background concerning definition and assessment of the prodromal state, rationale for the utility of subgroup analyses in CHR, characteristics associated with conversion to psychosis, as well as other features associated with the CHR state. More specifically, the introduction begins with a definition of the prodromal state, as well as an overview of common methods used to assess risk for psychosis. This will lead to a brief review of research supporting the heterogeneity of CHR subgroups and resulting utility of the latent profile approach. Following this review, there will be a synthesis of studies that have examined clinical, functional, and neurocognitive indices that may predict transition from CHR to a frank psychotic disorder. This will lead to a discussion of covariates potentially associated with the CHR state, such as social cognition, internalized stigma, substance use, racial and ethnic minority status, and premorbid functioning. Functional trajectory in CHR individuals and
The Prodromal State Definition and Assessment of the Prodromal State
Central to the task of early detection and intervention is accurate identification of who has entered the prodromal stage of illness and is at risk of developing a psychotic disorder. At present, the field has identified both a later prodromal phase (CHR) and an earlier prodromal phase. The early prodrome predates the CHR stage, and is characterized by distinct subthreshold symptoms (i.e., basic symptoms) that will be discussed below. This section will briefly
summarize definitions of the prodromal state and associated psychotic risk assessments to gain a foundation for understanding the present prediction model and associated indices.
The prodrome is broadly defined as a set of changes from a person’s premorbid mental and functional state characterized by sub-threshold psychotic symptoms in the period of time preceding onset of psychosis. While the prodrome was first described in 1932 (Mayer-Gross, 1932), it was not until the late 1980’s that research groups empirically investigated early signs of psychosis (Huber & Gross, 1989; Riecher et al., 1989). In the first prospective longitudinal study of risk, it was found that 73% of patients reported experiencing subthreshold symptoms
Yung and McGorry (1996a; 1996b) were the first to establish psychometrically validated psychosis risk criteria. The first tool to assess prodromal states was the Comprehensive
Assessment of At-Risk Mental States (CAARMS), a prospective interview and rating system (Yung & McGorry, 1996a; Yung & McGorry, 1996b). In the CAARMS, individuals are assessed on 27 symptoms across seven core dimensions, including negative symptoms (e.g., avolition), positive symptoms (e.g., perceptual abnormalities), and general symptoms (e.g., impaired tolerance to normal stress). Symptom ratings are used to determine risk status, which can be further delineated into three main subtypes of prodromal syndrome: attenuated positive symptoms (APS), genetic risk and familial risk for psychotic illness with recent decline in functioning (GRD), and brief intermittent psychotic states (BLIPS) (Yung & McGorry, 1996a; Yung & McGorry, 1996b). Early validation studies of CAARMS criteria evidenced enhanced detection rates of individuals at risk of developing a psychotic disorder, with an incidence of psychosis in the CHR group of 30-50% over two years. This provided support for the idea that prodromal individuals are both identifiable and at imminent risk of developing psychosis (Schaffner & McGorry, 2001).
symptom is significantly dysfunctional or dangerous (Miller et al., 2003). As such, individuals that progress from a psychometrically determined risk state to a major psychotic diagnosis will be referred to as “converters,” and those that do not will be referred to as “nonconverters.”
Researchers have also explored prodromal symptoms that emerge prior to CHR, and referred to such symptoms as “basic symptoms” (BS; Klosterkötter, Ebel, Schultze-Lutter, & Steinmeyer, 1996). BS are comprised of subtler alterations from a person’s premorbid state, which can include subjective alterations of perception, language, attention, body perception, and thought processing. BS symptoms cluster into two partially overlapping subgroups of items: cognitive-perceptive (COPER) and cognitive (COGDIS) symptoms (Schultze-Lutter,
Klosterkötter, Picker, Steinmeyer, & Ruhrmann, 2007). The COGDIS cluster is the most predictive of subsequent psychosis (Schultze-Lutter et al., 2007). BS appear similar to CHR symptoms conceptually, but are distinct in their independence from content related to reality orientation, abnormal thought content, and insight into symptoms’ pathological nature. Rather, BS and CHR symptoms and criteria are considered complementary sets of clinical symptoms, thus both tend to be used when assessing the prodromal state to best predict later conversion (Fusar-Poli, Borgwardt, et al., 2013).
While CHR individuals are at increased risk of developing a psychotic disorder, the vast majority of prospectively identified individuals do not convert (Fusar-Poli, Bonoldi et al., 2012). Such a high proportion of false-positives undermine the utility of the CHR status, and calls for enhanced understanding of the CHR state and specificity in predicting conversion.
Potential Subgroups in CHR Populations
schizophrenia (Fusar-Poli, Yung, McGorry, & van Os, 2014). A recent meta-analytic review found that 73% of presenting CHR individuals meet criteria for a comorbid axis I disorder in addition to CHR criteria (Fusar-Poli, Nelson, Valmaggia, Yung, & McGuire, 2014). Individuals at CHR often present with a mixture of psychopathologies in addition to subthreshold psychotic symptoms, such as anxious/mood disorders, personality disorders, and substance use disorders (Salokangas et al., 2012; Wigman et al., 2012; Woods et al., 2009; Yung et al., 2008). CHR groups are characterized by high distress resulting in help-seeking behaviors, though this distress is likely associated with heterogeneous symptom profiles. Heterogeneity impedes research by obscuring potentially discrete subtypes, which then hinders clinical research, evaluation, and treatment. A recent expert consensus paper confirmed that due to the dearth of support for diagnostic reliability and validity, the Attenuated Psychotic Syndrome was not included in the recent Diagnostic and Statistical Manual of Mental Disorders, fifth edition (DSM-5; APA) (Yung et al., 2012). While it remains unknown what disorders CHR individuals may develop, accurate risk criteria are needed to ensure that treatment can be appropriately tailored to the emerging diagnosis.
investigate symptomatic heterogeneity in CHR groups may lead to better identification of who will subsequently convert to a psychotic disorder.
Researchers have called for two different methods of parsing heterogeneity in CHR to create diagnostically meaningful subgroupings, risk stratification models and latent subgroup models. Risk stratification models are well established in medical disease models (e.g., cancer staging, heart disease risk). Such models use available predictive indices to generate a prognostic risk score for each CHR individual. Prognostic risk scores may be stratified into different risk classes, yielding a “prognostic index” with associated likelihood of transition to psychosis. Thus, this process produces specific, individualized hazard rates informing both degree of risk and time to transition (Ruhrmann, Schultze-Lutter, Schmidt, Kaiser, & Klosterkötter, 2014). Staging was first applied to mental illness risk models by Ruhrmann et al. (2010), which used regression to stratify the CHR group by prognostic index into four risk groups, indicating that a differentiated estimation of current risk may further enhance predictive accuracy. This approach has since been replicated with success in large prospective studies of CHR individuals incorporating additional predictor indices (Michel, Ruhrmann, Schimmelmann, Klosterkötter, & Schultze-Lutter, 2014; Nieman et al., 2013). However, risk stratification methods rely on logistic regression, which assumes that the risk of conversion is evenly distributed throughout the sample (Hagenaars & McCutcheon, 2002). Given the heterogeneity of CHR samples, this assumption may be erroneous, and alternate methodological approaches may be warranted.
broader CHR cohort, each with independent, specific symptom constellations with differential associations with later conversion and functional ability. Latent subgroup models may provide a possible path to improved accuracy in identifying who among the CHR group will subsequently convert to psychosis. Recent imaging studies have provided support for latent subgroups
underlying CHR populations, finding significant neurobiological heterogeneity in gray matter volume within the CHR group (Modinos et al., 2014). Prior to such findings, the field of imaging posited that CHR individuals share similar neuroanatomical alterations. This work underlines heterogeneous psychopathologies’ influence on both psychopathological and neurobiological features, with implications for both psychological and psychotropic treatments.
Latent Profile Methods in CHR
Raballo et al. (2014) sought to identify schizophrenia proneness subtypes among a moderately large sample of CHR individuals (n = 81) and individuals with first episode psychosis (n = 86). LCA applied to the full sample’s 17-item schizophrenia checklist scores resulted in a 3-class model, with the class at the highest proneness of developing psychosis characterized by increased paranoid features (e.g., self-referential ideation, persecutory ideation) and increased disturbed subjective experiences (e.g., alterations in perceptual vividness and subclinical hallucinatory experiences). Of note, there was little differentiation between classes on symptoms relating to functionality or affective disturbances. However, this study was limited by its cross-sectional design and authors did not confirm class membership using follow-up
predictor and covariate analyses. Instead, conclusions were drawn from inspection of LCA profile plots rather than empirical statistics.
Two studies aimed to improve the prediction of conversion by investigating the latent subgroups among CHR individuals and their associations with subsequent conversion, and these studies found mixed results (Valmaggia et al., 2013; Velthorst et al., 2013). Velthorst et al. (2013) used a modified latent class factor analysis, a combination of factor analysis and LCA, to investigate latent classes underlying the symptom profiles of 288 CHR and healthy control participants. Using a model that investigated how latent classes cluster based upon the
healthy controls with limited variability. Another issue is the limited diversity of predictive indices, which may have hindered the study’s ability to ascertain vulnerability profiles.
Valmaggia et al. (2013) applied a LCCA approach to a sample of 318 CHR individuals’ CAARMS ratings. The LCCA model sought to clarify the constellation of CAARMS symptoms that was most likely to precede the onset of psychosis. A 4-class model emerged, each associated with different risks of conversion to psychosis (class 1, 4.9%; class 2, 10.9%; class 3, 11.4%, class 4, 41.2%). The subgroup with the highest conversion risk (class 4) was characterized by the highest symptom ratings, lowest overall functioning score, and highest proportion of
unemployed individuals. The four classes could be best separated by differences in negative symptom ratings (e.g., anhedonia, alogia, avolition) and behavioral change indices (impaired role functioning, social isolation), indicating that these variables are useful in determining who is at risk. Items measuring depression, anxiety, or impaired tolerance to normal stress could not differentiate risk groups, as the entire CHR sample reported high scores in these domains. Thus, the LCCA model was able to identify individuals with a specific constellation of negative symptoms and role impairments that were associated with a higher risk of conversion.
The present paper seeks to extend previous latent variable method findings through the application of LPA in a large group of prospectively identified CHR individuals. Clinical and neurocognitive indices will be used to generate latent subgroups, and other demographic and clinical indices will be used to further characterize LPA subgroups. As such, the subsequent sections will refer to “indicators” and “covariates” in exploring possible variables for
Predictors of Conversion to Psychosis
A significant goal in CHR research over the past decade has been to determine who will convert from a CHR state to a full-blown psychotic disorder in prospective, longitudinal studies of CHR individuals. To this end, several clinical trials and longitudinal cohort studies have investigated predictors of conversion among help-seeking individuals meeting CHR criteria. Of note, current conversion estimates and predictive models are generated from samples of
distressed, impaired, help-seeking individuals who likely have a higher risk of developing psychosis than individuals randomly sampled in the general population. The number of
individuals who meet criteria for CHR in the general population remains undetermined (Fusar-Poli, Borgwardt, et al., 2013). Thus, present CHR criteria is based upon and validated among individuals that present to treatment clinics.
Clinical Characteristics
Initial studies predicting conversion included individuals meeting CHR symptom criteria (e.g., APS criteria), BS (e.g., COGDIS criteria), or a combination of the two. Each of the
following studies’ models included different domains of interest and associated psychometric instruments. This has resulted in the generation of distinct predictive models that are difficult to synthesize. All studies used Cox logistic regression, unless otherwise specified.
The Cologne Early Recognition study found that the presence of a specific constellation of BS symptoms (i.e., including thought interference, visual distortions, and disturbances in receptive language) predicted a diagnosis of schizophrenia within 10 years with a probability of 91% (Klosterkötter, Hellmich, Steinmeyer, & Schultze-Lutter, 2001). Importantly, 96% of individuals with an absence of BS did not go on to develop schizophrenia. A recent review of prospective studies using BS found that COGDIS criteria predicted the onset of first-episode psychosis as well as CHR criteria (Schultze-Lutter et al., 2012). Further, meta-analytic findings indicated the addition of individuals meeting BS criteria at baseline assessment was able to identify individuals that transitioned to schizophrenia specifically rather than other affective psychoses, providing support that the BS is associated with diagnostic specificity (Fusar-Poli, Bechdolf, et al., 2013).
various symptoms at an item level. Items included those assessing odd beliefs, role functioning, blunted affect, anhedonia/asociality, and auditory hallucinations. Consistent through these models, as well as in findings from the Early Detection and Intervention Evaluation study, is the key role of attenuated positive symptoms in predicting later conversion (Morrison et al., 2004). This initial foundational work led to larger, longitudinal, multisite studies assessing predictors of conversion to psychosis. Three significant samples will be described in the subsequent text: the North American Prodrome Longitudinal Study (NAPLS; Addington et al., 2007), The Personal Assessment and Crisis Evaluation Program (PACE; Thompson, Nelson, & Yung, 2011), and Prospective European Prediction of Psychosis Study (EPOS; Ruhrmann et al., 2010).
NAPLS prospectively followed 291 CHR individuals and found that five clinical
predictive variables significantly accounted for unique variance in conversion. Predictive criteria included increased unusual thought content, increased suspiciousness and paranoia, social functioning impairment, history of substance abuse, and presence of genetic risk for
schizophrenia with recent decline in overall functioning (Cannon et al., 2008). Contrary to what might be hypothesized given the relationship between cannabis, amphetamines, and psychotic symptom exacerbation, history of alcohol or drug abuse was a relatively weak predictor in this sample. Subsets of the five variables resulted in significantly enhanced predictive power (up to 80%), but led to a higher rate of false negatives (Cannon et al., 2008). NAPLS is a foundational study in prospective prediction research and led to several replication studies.
functioning each uniquely predicted later conversion (PACE; Thompson, Nelson, et al., 2011). The Dutch Prediction of Psychosis (DUPS) study also sought to replicate NAPLS prediction model, finding that social anhedonia and social withdrawal were the two strongest predictors of subsequent onset (Velthorst et al., 2009). The Prospective European Prediction of Psychosis Study (EPOS) included individuals meeting CHR criteria and individuals meeting COGDIS criteria. EPOS results indicated that six variables best predicted conversion, including sleep disturbance, overall positive symptom score, bizarre thinking, schizotypal personality disorder diagnosis, overall functioning in the past year, and years of education (Ruhrmann et al., 2010). Of note, genetic risk for schizophrenia with recent decline in overall functioning was not predictive in the EPOS sample.
Demjaha and colleagues (2012) sought to investigate a data-driven dimensional model of prediction through an exploratory factor analysis of clinical symptom scores to ascertain whether certain symptom dimension scores predicted subsequent conversion to psychosis better than others. Principal factor analysis yielded a five-factor solution comprised of negative,
disorganization/cognitive, self-harm, anxiety, and manic symptom dimensions. Cox regression analyses were conducted using summed dimensional scores; results indicated that the negative and disorganized/cognitive symptom dimensions were most closely associated with subsequent conversion.
2004; Thompson, Nelson, et al., 2011; Ruhrmann et al., 2010), and suspiciousness/paranoia symptom ratings (Cannon et al., 2008; Cornblatt et al., 2015). While the general negative symptom subscale total has limited predictive power with only one early study supporting its utility (Yung et al., 2003), specific items measuring anhedonia (Mason et al., 2004; Velthorst et al., 2009), social dysfunction (Cannon et al., 2008), and withdrawal (Velthorst et al., 2009) appear to be predictive of conversion. Fairly consistent evidence is in support of the utility of overall functioning indices (Ruhrmann et al, 2010; Thompson, Nelson, et al., 2011; Yung et al., 2003) as well as overall decline in functioning combined with genetic risk (Cannon et al., 2008; Thompson, Nelson, et al., 2011). Though BS research is more limited, results generally favor the two-stage model of early and late prodromal phase as assessed by BS and CHR, respectively (Klosterkötter et al., 2001; Klosterkötter et al., 2011). Further, work suggests that using both BS (e.g., COGDIS criteria) and CHR criteria enhances prediction of conversion (Ruhrmann et al., 2010).
Mood Symptoms
2010). Further, they found that depressive symptomatology evidenced a linear increase over time among individuals that later converted to psychosis (Schultze-Lutter et al., 2010).
(Bora & Pantelis, 2015). While work regarding incidence rates of psychosis vs. other psychiatric disorders in CHR groups is limited, recent findings indicated that emergent psychosis diagnoses were significantly more likely than any nonpsychotic disorder diagnoses in CHR individuals (Webb et al., 2015).
Neurocognitive Ability
Neurocognitive deficits are regarded as a hallmark feature of schizophrenia (Heinrichs, 2005). In the psychosis literature, neurocognitive ability may be understood as
neuropsychological performance on a number of different subdomains, including memory,
attention, verbal fluency, executive functioning, and psychomotor performance (Marder, Fenton,
& Youens, 2004). In the Diagnostic and Statistical Manual of Mental Health Disorders (DSM-5) section III, “impaired cognition” was proposed to be one of eight dimensions of psychosis
symptom severity (APA; 2013). The extant literature uses both standardized subdomain scores and composite neurocognition scores (i.e., full scale IQ) in models predicting conversion from
baseline neurocognitive ability.
A recent meta-analysis found that CHR individuals evidenced small to medium neurocognitive deficits when compared to healthy controls, across neurocognitive domains (Fusar-Poli, Deste, et al., 2012). A notable exception is IQ score, as estimates of general IQ appeared not to differentiate between converters and nonconverters (Giuliano et al., 2012). The longitudinal research on neurocognitive predictors is still in a nascent stage. Across the extant longitudinal literature comparing baseline neurocognitive deficits of converters and
al., 2007). However, such work does not consider interactions between clinical symptom criteria and neurocognitive ability.
Of particular interest are studies investigating the predictive validity of neurocognitive deficits in regression models by incorporating a broad range of indices measuring both clinical symptomatology and neurocognitive ability (Cornblatt et al., 2015; Keefe et al., 2006; Riecher-Rössler, 2009; Seidman et al., 2010). Früherkennung von Psychosen used a predictive model including indices of executive functioning, working memory, attention, and general ability in combination with basic clinical symptomatology indices. The predictive model with the strongest sensitivity and specificity included items measuring suspiciousness, anhedonia/asociality, and performance on a measure of executive functioning (Riecher-Rössler et al., 2009). The NAPLS team has also explicated the relationship between baseline neurocognitive performance and subsequent conversion to psychosis, finding that impairments were more significant in
converters than in nonconverters, but only modestly (composite neurocognitive score, d = 0.40) (Seidman et al., 2010). At a domain level, lower baseline verbal memory predicted time to conversion such that it was associated with more rapid conversion. Cox regression models incorporating neurocognitive indices in the prior multivariate NAPLS prediction model (Cannon et al., 2008) found that neurocognitive indicators did not uniquely predict psychosis beyond clinical indices. Conversely, a recent study by Cornblatt et al. (2015) found that impaired verbal memory enhanced a risk model including other clinical variables. Thus, evidence is mixed regarding the utility of neurocognitive indices as compared to other clinical indices.
deficits in executive control/processing speed, greater than and independent from deficits in other domains (Cohen’s d ~ 0.50). The later phase prodrome is characterized by verbal memory deficits, executive control/processing speed, and to a lesser degree, working memory deficits. Working memory was intact in the early phase prodrome. Thus, it is theorized that deficits in executive control/processing speed predate first subthreshold positive symptoms, while the introduction of verbal memory impairment in later prodrome marks a disease progression. While these data do not shed light on differences between converters and nonconverters, findings indicate that progressive neurocognitive impairment co-occurs with psychotic disease progression (Frommann et al., 2010).
A more recent study extended the investigation of Frommann and colleagues (2010) with comparisons of converters and nonconverters and Cox regression modeling to stratify risk level using both clinical and neurocognitive variables (Michel et al., 2014). Further, neurocognitive deficits were defined relative to age normed data, such that deficits on neurocognitive domains were entered categorically into the predictive model (present, absent). This model found that the risk of conversion was highest in the presence of concomitant factors of APS criteria, COGDIS criteria, and a processing speed deficit as measured by the digit symbol test.
Covariates Characterizing CHR Subgroups Social Cognition
Social cognition (SC) is best defined as a set of neurocognitive processes related to understanding, recognizing, processing, and appropriately using social stimuli in one’s environment (Adolphs, 2009; Penn, Corrigan, Bentall, Racenstein, & Newman, 1997). Social cognition is a multi-faceted construct consisting of several sub-domains. Domains of interest in the present study include emotion perception (EP; the ability to perceive and appropriately use emotions) and theory of mind (ToM; the ability to infer others’ mental states) (Pinkham et al., 2013).
There is evidence that as compared to healthy controls, CHR individuals have deficits in some domains of SC more than others (Thompson, Bartholomeusz, & Yung, 2011; van
Donkersgoed et al., 2015). Specifically, a meta-analysis showed medium effect sizes differences between CHR and healthy controls in both ToM and EP (g = 0.43 - 0.45). In comparisons between converters and nonconverters, ToM also evidenced a medium effect size (g = .63), with converters showing significant impairment compared to nonconverters (Lee et al., 2015). Recent findings from baseline measures of the NAPLS 2 cohort found evidence of significant
of later conversion (Healey, Penn, Perkins, Woods, & Addington, 2013; Kim et al., 2011). These models remained significant even after the addition of neurocognitive predictor variables.
Conversely, other work indicates that baseline ToM performance is not predictive of psychosis (Gill et al., 2014). Thus, evidence is mixed in support of SC’s predictive validity in CHR individuals.
Meta-analytic findings indicate SC is more proximal to functional outcome than neurocognition in individuals with schizophrenia spectrum illnesses (Fett, Viechtbauer, Penn, van Os, & Krabbendam, 2011). This underlines the importance of investigating SC in CHR individuals as a potential treatment target to mitigate functional decline. Thus far, only two studies have explored associations between neurocognition, social cognition, and social
functioning in CHR individuals (Addington, Saeedi, & Addington, 2006; Barbato et al., 2013b). Addington et al. (2006) found that SC mediates the relationship between neurocognition and social functioning. Barbato and colleagues (2013) attempted to replicate this finding, with results suggesting there is a stronger relationship between social cognition and social functioning than neurocognition and social functioning. However, SC did not predict social functioning in a regression model (Barbato et al., 2013b). Further work is thus needed to determine SC’s role in CHR individuals and relationship with long term functioning.
Internalized Stigma
of internalized stigma have been validated in CHR individuals with success, and this construct has shown significant associations with depression, social anxiety, and suicidal thinking (Pyle et al., 2015). Using the sample of CHR individuals from the present data set, Stowkowy and colleagues (2015) found that a subscale of items concerning an absence of “control over
experiences” was associated with conversion to a psychotic disorder (e.g., “I am powerless over my experiences”). This is consistent with other work that has found that “self-disturbance,” or a disruption in basic sense of self, is a phenotypic marker of psychotic spectrum illness
vulnerability. Disruptions in “mineness” of one’s mental content (i.e., feeling that one’s thoughts are his/her own) are disrupted in later phases of the prodrome, and is predictive of later transition to psychosis (Nelson, Thompson, & Yung, 2012). Thus, negative beliefs about illness and
associated internalized stigma affect course, chronicity, and may be linked to conversion to a full psychotic disorder.
Substance Use
limited. Substance abuse data is not routinely measured or incorporated in predictive models, and at times individuals meeting substance dependence criteria are excluded from studies to protect validity of neurocognitive data (Addington, Case, et al., 2014).
Of the studies addressing conversion to psychosis, evidence supporting the predictive validity of indices related to substance use is weak. As previously mentioned, results from NAPLS indicated that history of substance use disorder predicted conversion with other indices, though it was not as strong as other clinical predictors (Cannon et al., 2008). Other large
longitudinal studies found that substance abuse was not predictive of conversion to psychosis (Auther et al., 2012; Buchy et al., 2015; Ruhrmann et al., 2010) or social/role functioning
(Auther et al., 2012). Of note, a study using the same data set as the present study found that low alcohol use predicted subsequent transition, but no other substances at baseline (Buchy et al., 2014). A recent meta-analysis suggested that there is a dose-response relationship between cannabis use and conversion to psychosis, such that current use (i.e., dependence or abuse), but not lifetime cannabis use increased risk of conversion (Kraan et al., 2015). The complicated relationship among substance use and onset of psychosis indicates further prospective investigation may be needed.
Racial and Ethnic Background
rates of bipolar spectrum disorders (Amad et al., 2013; Veldhuizen, 2009). It has been theorized that ethnic minority status incurs specific risk for psychotic disorders. Numerous hypotheses are postulated to explain potential causes, including (1) incorrect diagnosis of psychotic disorders in minorities based on race/ethnicity and/or cultural misinterpretations (Barnes, 2008), and (2) visible minority status leading to increased experiences of discrimination (Berg et al., 2014). Increased perception of discrimination is associated with greater depressive, positive, and delusional symptoms (Berg et al., 2014; Janssen et al., 2003). In individuals with chronic
schizophrenia, recent work has investigated the symptom profiles of visible minorities versus all other patients, and has found that visible minorities had significantly higher scores on items measuring delusions and difficulty in abstract thinking (Berg et al., 2014).
Premorbid Functional Ability
Functional impairment is a key feature in the phase prior to onset of frank psychosis, as established by studies of first-episode psychosis (MacBeth & Gumley, 2008). Functional deterioration is associated with an earlier age of onset and poorer general prognosis in individuals with established psychotic disorders (e.g., Strous et al., 2004). While evidence supports the predictive validity of indices of baseline functioning in CHR individuals (e.g., Cannon et al., 2008: Mason et al., 2004; Ruhrmann et al., 2010; Thompson, Nelson, et al., 2011; Yung et al., 2003), less work has focused on the predictive validity of premorbid functioning. Premorbid functioning may be defined as functional ability predating the onset of CHR, across different developmental periods (i.e., childhood).
Two studies from the NAPLS sample prospectively investigated the association between deterioration of functioning in the premorbid phase and conversion to psychosis (Tarbox et al., 2013; Tarbox et al., 2014). The Premorbid Adjustment Scale (PAS; Brill, Reichenberg, Weiser, & Rabinowicz, 2008; Cannon-Spoor, Potkin, & Wyatt, 1982) was used to assess premorbid adjustment in social, academic, and overall functioning across four periods of development (age five to adulthood). Comparisons between converters and nonconverters indicated that converters evidenced significantly higher ratings of social maladjustment in early adolescence (age 12-15). After controlling for baseline subthreshold psychotic symptoms, early adolescent social
Functional Trajectory
While conversion to psychosis has assumed primacy in early detection and intervention studies, it is becoming increasingly clear that functional outcome is worthy of investigation. CHR individuals that do not go on to convert to a psychotic disorder often continue to experience significant impairment in social and role functioning (e.g., Addington et al., 2011; Schlosser et al., 2012). However, much less is known of nonconverters, as a systematic review indicated nearly half of CHR studies did not provide relevant characteristics of nonconverters (Simon et al., 2011). In the field of CHR research, functioning is typically parsed into social, role, and global functioning, though there is conceptual overlap between these areas. Social functioning may be defined as competencies related to interpersonal communication, independence in activities of daily living, social activities and recreation (Birchwood, Smith, Cochrane, Wetton, & Copestake, 1990). Role functioning may be defined as instrumental role functioning (e.g., role of student, housekeeper, worker), interpersonal relations, and common activities/hobbies.
contributing to conversion to a full psychotic disorder, then such symptom constellations may also be prioritized as treatment targets.
Prospective studies including conversion status in models predicting subsequent
functional outcome have explicated this relationship with mixed findings. Carrión et al. (2013) included conversion status in a model predicting social and role outcome from indices measuring symptoms and neurocognition. Role outcome was independent of conversion to psychosis, however social outcome was significantly related to conversion. Findings from the EPOS study indicate that approximately one third of the CHR group experienced poor psychosocial outcome, and that conversion to psychosis did not explain functional outcome (Salokangas et al., 2013). Salokangas et al. (2014) found that conversion status was significantly associated with poor functioning at follow-up as measured by the GAF. However, the GAF includes assessment of symptoms, and thus may not be as valid of a measure as other, more specific role/social functional measures.
The Present Study
The present study aimed to build upon Valmaggia and colleagues’ (2013) model, which included only subthreshold psychotic symptoms as measured by the CAARMS and a single overall functional index as measured by the GAF. Their study is limited by the narrow scope of indicators and covariates, such as lacking specific measures of functioning (e.g., social,
occupational), neurocognition, and pre-morbid functioning, all of which are associated with later conversion to psychosis in regression models. The present study sought to enhance the validity of the latent model by adding diagnostically relevant clinical and neurocognitive indices as indicators. The current study aimed to extend prior LCA models through the exploration of the functional trajectory of each latent subgroup. Additionally, the current study sought to further characterize latent subgroups with regard to social cognitive ability, premorbid functioning, internalized stigma, substance use, and racial/ethnic composition.
Aims & Hypotheses
Aim 1: Evaluate the latent profile structure of the CHR group. The first aim was to evaluate the latent profile structure of the CHR group using LPA. As previously discussed, CHR groups are diagnostically heterogeneous, composed of individuals presenting with various clusters of symptoms (e.g., affective symptoms, anxiety symptoms, subpsychotic symptoms) (e.g., Salokangas et al., 2012). It is likely that there are subgroups hidden within the
clinically useful profile of risk indicators. As the current study is a data driven statistical model, the number and size of classes were not known a priori (Collins & Lanza, 2010).
Hypothesis: It was hypothesized that LPA methods will reveal homogenous subgroups from the psychopathologically heterogeneous sample. The number and size of classes were not
hypothesized.
Aim 2: Evaluate the risk probability of conversion to a psychotic disorder in each latent class. The second aim was to evaluate the probability that each latent class would later convert to a full psychotic disorder (see definition of “conversion” in methods). Hypothesis: It was hypothesized that the subgroup associated with the highest risk of conversion would include high ratings of: attenuated positive psychotic symptoms (e.g., Yung et al., 2003), unusual
thought content (e.g., Cannon et al., 2008), suspiciousness (e.g., Cannon et al., 2008), social anhedonia (e.g., Velthorst et al., 2009), occupational functioning impairment (e.g., Mason et al., 2004), and neurocognitive impairment (e.g., processing speed, verbal memory, verbal fluency, and working memory) (e.g., Frommann et al., 2010; Riecher-Rössler et al., 2009; Seidman et al., 2010). There is currently insufficient evidence to hypothesize what constellation of symptoms would characterize latent classes associated with a lower risk of conversion.
processing speed) would also be influential in the LCA modeling process (e.g., Frommann et al., 2010; Riecher-Rössler et al., 2009; Seidman et al., 2010).
Aim 4: Evaluate covariates to further characterize subgroups. The fourth aim was to examine associations between covariates and subgroup membership. Covariates of interest have demonstrated patterns of association with the CHR state that warrant further exploration,
including social cognition, internalized stigma, substance use, and racial ethnic minority status. Further, prodromal clinic site (Toronto, UNC, Yale) was included as a covariate to assess potential site effects. Hypothesis: It was hypothesized that the subgroup associated with the highest risk of conversion would be further characterized by impairment in ToM, decreased control over experiences, recent cannabis and alcohol abuse, poor premorbid functioning, and racial ethnic minority status (e.g., Bourque et al., 2011; Callaghan et al., 2012; Healey et al., 2013; Kim et al., 2011; Nelson et al., 2012; Tarbox et al., 2013).
Aim 5: Evaluate the functional trajectory of subgroups, and compare subgroups on functioning over time. The fifth aim was to examine the functional trajectory of each subgroup over time. CHR individuals that do not go on to convert to a psychotic disorder often continue to experience significant impairment in social and role functioning (e.g., Addington et al., 2011; Schlosser et al., 2011). Current research indicates that conversion and associated psychotic symptomatology do not fully account for poor functional outcome in CHR individuals (Salokangas et al., 2013; Salokangas et al., 2014). Hypothesis: It was hypothesized that subgroups would evidence significant between group differences across time points on
Methods Sample
The sample consisted of 171 participants (98 males, 73 females) at CHR of developing psychosis with a mean age of 19.8 (SD = 4.5) and 100 help-seeking control (HSC) participants (56 males, 44 females) with a mean age of 19.4 (SD = 3.9) years. All data were collected as a part of NIMH funded, multi-site study “Enhancing the Prospective Prediction of Psychosis” (PREDICT). Several studies have been published using this data set (Addington et al., 2008a; Addington et al., 2008b; Addington et al., 2012; Addington & Barbato, 2012; Barbato et al., 2013a; Barbato et al., 2013b; Barbato et al., 2014; Buchy et al., 2014; Callaway et al., 2014; Couture et al., 2008; Hawkins et al., 2008; Healey et al., 2013; Lyngberg et al., 2015; Stowkowy et al., 2015; Stowkowy & Addington, 2012; Yong et al., 2014).
PREDICT was conducted at the Universities of North Carolina at Chapel Hill (UNC-CH; 62 CHR, 24 HSC), Toronto (69 CHR, 45 HSC), and Yale (40 CHR, 31 HSC). All CHR
The help-seeking control group (HSC) was comprised of individuals who had (1) responded to CHR recruitment and (2) presented with prodromal symptoms at phone screen but upon administration of the full interview did not meet prodromal criteria. The HSC group contains the following subgroups: (1) family high risk but no deterioration in GAF (n = 16) (2) long-standing attenuated symptoms present for 1 year (n = 39) (3) current prodromal symptoms but symptoms were clearly due to another disorder (n = 2) (4) had only negative symptoms (n = 4) and (5) symptoms that did not meet severity or frequency criterion (n = 24). HSC individuals were included as a clinically relevant control group that provides a more stringent test of
conversion, as CHR and HSC individuals are more symptomatically similar to one another than to non-psychiatric controls.
The Structured Clinical Interview for DSM-IV (SCID-I: First, Spitzer, Gibbon, & William, 1996) was administered to determine the presence of any axis I disorders. Exclusion criterion consisted of any of the following criteria: presence of an axis I psychotic disorder, IQ less than 70, or a past or current of a clinically significant central nervous system disorder that may contribute to or confound CHR symptoms. Individuals were also excluded for past or current use of antipsychotic medication, as the PREDICT study aimed to examine predictors of conversion to psychosis without the confound of antipsychotic medications. After conducting comprehensive clinical assessments to determine inclusion, participants completed other measures and tasks.
Procedures
The PREDICT study was a longitudinal study of predictors of conversion to psychosis. Study protocols and informed consent documents were reviewed and approved by the
Toronto, Yale University). Formal consenting procedures were conducted with all participants. Testing occurred over two sessions, typically on the same day but consistently within seven days. Participants were assigned a clinical rater who administered all semi-structured interviews with that participant. Raters at all three sites underwent a training program developed at Yale to properly identify the prodromal syndrome with adequate reliability (Miller et al., 2003). All raters were experienced research clinicians who demonstrated adequate reliability through the administration of routine reliability checks. Gold standard post-training agreements on the discrimination between high risk (5) and psychotic (6) levels of intensity on the positive symptom items (the critical threshold for determining both initial eligibility and subsequent conversion status) were excellent (kappa = 0.90).
The DSM-IV diagnoses were established with the SCID-I. Interrater reliability was determined at the start of the study and subsequent annual retesting by 100% agreement on the diagnosis and at least 80% agreement for symptom presence. JA chaired weekly conference calls to review inclusion criteria for all CHR individuals that participated the study. JA trained
research assistants in neurocognitive assessments and DP trained research assistants in social cognitive assessments.
Follow-up Assessments
Measures
Symptom measures
Clinical high risk (CHR) symptomatology and criteria. Prodromal syndrome and conversion criteria were assessed using the SIPS (McGlashan et al., 2010). The SIPS interview assesses information concerning the presence and severity of 19 distinct symptoms of the Scale of Prodromal Symptoms (SOPS), each rated on a 7-point scale (0-6), with higher ratings
indicating symptomatology associated with greater intensity and frequency. The prodromal range is generally considered to lie between scores of 3-5, corresponding with anchors moderate-severe (Corcoran et al., 2011). The SOPS symptoms are categorized across four domains of
psychopathology, including negative, positive, disorganized, and general symptoms, and can be summarized accordingly for total domain scores (Miller et al., 2003).
The SIPS also assesses information concerning family history, schizotypal personality disorder, and global functioning. Results of SIPS interview are integrated to determine the threshold presence of prodromal syndromes. Three prodromal syndromes are operationally defined, including attenuated positive symptoms syndrome, genetic risk and deterioration syndrome, and brief intermittent psychotic symptoms. The attenuated positive symptoms syndrome (APS) consists of the presence of at least one positive symptom (e.g., suspiciousness or grandiose ideas), but not at a level at or exceeding psychotic (≥ 6). Genetic risk and
Conversion. Conversion to psychotic disorder is defined as at least one of the five attenuated positive symptoms reaching a psychotic level of intensity (rated 6) for a frequency of ≥ 1 h/day for 4 days/week in the past month, or that symptoms seriously impacted functioning (e.g. severely disorganized or dangerous to self/others) (McGlashan et al., 2010). Symptoms were assessed with the Scale of Prodromal Symptoms (SOPS), which is comprised of 19 items in four symptom domains: positive, negative, general, and disorganized. In the present sample, 29 participants in the CHR group (14 males, 15 females) and 5 participants in the HSC group (2 males, 3 females) converted to psychosis.
Substance use. Substance use was rated using a well-established rating scale, the Alcohol and Drug Use Scale (AUS/DUS) (Drake, Mueser, McHugo, 1996). The AUS/DUS is a 12-item scale that assesses severity of substance use within the past month. Each item is rated on a 5-point scale (1-5) where a rating of 1 is “abstinent,” 2 is “use without impairment,” 3 is “abuse,” 4 is “dependence,” and 5 is “severe dependence.” Ratings between 3 and 5 are indicative of
behaviors associated with DSM-IV diagnoses of substance abuse and dependence. There is one severity rating at baseline for each of the following substances: alcohol, marijuana, cocaine, opiates, PCP, amphetamines, MDMA/ecstasy, GHB, glue/other volatiles, hallucinogens, and other substances.
Mood symptomatology. Calgary Depression Scale for Schizophrenia (CDSS: Addington, Addington, & Maticka-Tyndale, 1993) is a semi-structured interview used to measure depressive symptomatology within the past week. The CDSS has been validated in CHR individuals
severity of depressive symptoms during the past week. Each item is rated on a 4-point scale (0-3) with low ratings indicating the absence of a symptom and high ratings indicating a severe
symptom. Full administration of the CDSS generates a total score (range: 0-27).
The Young Mania Rating Scale (YMRS, Young, Biggs, Ziegler, & Meyer, 1978) is a semi-structured interview to measure mania symptomatology within the past month. The YMRS is an 11-item scale with 7 items measuring the following: elevated mood, increased motor activity, sexual interest, sleep, language—thought disorder, appearance, and insight. Such items are rated on a 5-point scale (0-4) where a rating of 0 is “absent” and a rating of 4 is “severe”. The YMRS also includes 4 items measuring the following on a 9-point scale (0-8; absent-severe): irritability, speech (rate and amount), disruptive-aggressive behavior, and content. YMRS administration results in a total score (range: 0-60).
Internalized stigma. Personal Beliefs about Experiences Questionnaire (PBEQ; Morrison et al., 2013; Pyle et al., 2015) is a revised version of the Personal Beliefs about Illness
Questionnaire (PBIQ; Birchwood, Mason, MacMillan, & Healy, 1993). The PBIQ evidenced strong reliability (Birchwood et al., 1993). As the PBIQ was developed for individuals with established schizophrenia, items were removed that were unrelated to the CHR population. Items were as follows, “I will always need to be cared for by professional staff”, “People like me must be controlled by psychiatric services”, and “If I am going to relapse, there is nothing I can do about it”.
which this statement is true of them on a 4-point scale (1-4); lower ratings indicate strong disagreement and higher ratings indicate strong agreement. PBEQ administration results in a total score (range: 13-52). Three items were summed to create the “control over illness”
subscale, consistent with previous work (Birchwood, Jackson, Brunet, Holden, & Barton, 2012; Stowkowy et al., 2015).
Social Cognition Measures
Theory of mind (ToM). ToM was assessed with the “Reading the Mind in the Eyes” task
(Eyes Task: Baron-Cohen, Wheelwright, Hill, Raste, & Plumb, 2001), a multiple choice task
requiring the participant to infer mental/emotional states from 36 cropped photos of pairs of
eyes. Participants are instructed to select one of four words that best describe what the person is
thinking or feeling based on their eyes. Participants are given a practice item to ensure
understanding of the task. They are provided with standardized definitions of word choices at
their request. The number of correctly identified faces indexes performance (range: 0-36). The
Eyes Task was selected for its frequent usage in schizophrenia spectrum disorders (Pinkham et
al., 2013).
Emotion perception (EP). Face Emotion Identification Task (FEIT) and the Face
Emotion Discrimination Task (FEDT) were used to measure EP in facial expressions (Kerr &
Neale, 1993). Both tasks are comprised of black and white facial photographs presented using a
DVD. The FEIT contains 19 photographs depicting six basic emotions (happy, sad, afraid, angry,
surprised, and ashamed). Faces are presented for 15 seconds each with 10 seconds of blank
screen separating each presentation. FEIT performance is indexed as the total number of correct
facial emotion identifications (range: 0-19). The FEDT is comprised of 30 pairs of faces,
emotions. Emotions are consistent with those depicted in the FEIT. Pairs of faces are presented
for 15 seconds each with 15 seconds of blank screen separating each presentation. FEDT
performance is indexed as the total number of correct discriminations (range: 0-30).
The Affective Prosody Task (AP) (Edwards, Pattison, Jackson, & Wales, 2001) was used
to assess EP in voices. AP stimuli are comprised of audio recordings of three professional actors
speaking four simple sentences ("they must stay here", “we must go there”, “she will drive fast”,
and “he will come soon”) in voices expressing fear, sadness, anger, surprise, and neutral (no
emotion). Each actor is associated with three practice items and 20 test items, resulting in 60
total items (range: 0-60) indexing performance. Responses are coded as correct or incorrect and
correct responses are summed for a total score. The reliability coefficient (Cronbach’s Alpha) for
AP is .85 (Edwards et al., 2001).
All social cognitive tests, ranges, and normative data from healthy control groups are provided in Table 1.
Functioning measures
Social functioning. Social functioning was measured using the Social Functioning Scale (SFS; Birchwood et al., 1990). The SFS is a self-report measure with well-established
The SFS has been criticized for overlap with measures of occupational functioning and thus not being a pure measure of social functioning (Cornblatt et al., 2007). Pijnenborg et al. (2009) performed a principal components analysis of SFS subscales and found that the SFS employment item is a separable subscale. As the present study is interested more in social functioning rather than a combined measure of social and role functioning, the subscale measuring occupational functioning will be removed from the SFS total score (range: 0-213).
Role functioning. The Heinrichs-Carpenter Quality of Life Scales (QLS) measures role functioning (Heinrichs, Hanlon, & Carpenter, 1984). The QLS is a clinician rated,
semi-structured interview. The QLS is frequently used in schizophrenia spectrum illnesses, and has evidenced strong convergent validity in associations with performance-based assessments of functional capacity (Sabbag et al., 2011). The QLS is comprised of four items, each rated on a 7-point (0-6) scale. Lower ratings indicate low quality of life and higher ratings indicate greater quality of life. Full administration of the QLS results in the following 4 domain scores:
accomplishment, occupational functioning, underemployment, and satisfaction with occupational functioning. Total score is computed by summing accomplishment, occupational functioning, and underemployment items (range: 0-18). The satisfaction with occupational functioning item is only administered if the occupational functioning item is rated at least 3.
Premorbid functioning. Premorbid functioning was assessed using the Premorbid Adjustment Scale (PAS; Cannon-Spoor et al., 1982), which is a semi-structured interview that measures premorbid functioning retrospectively. Participants are rated on social (i.e.,
sociability/withdrawal and peer relationships) and academic maladjustment across
illnesses. PAS is comprised of 26 items, each rated on a 7-point scale (0-6), with lower ratings indicating low maladjustment and higher ratings indicating high maladjustment.
The PAS measures four domains in addition to a total score: sociability/withdrawal, peer relationships, functional ability apart from nuclear family, and ability to function at a
developmentally appropriate socio-sexual level. Four developmental stages are rated, childhood (up to age 11), early adolescence (age 12-15), late adolescence (16-18), and adulthood (age 19 and older). Subscale scores are computed by dividing the obtained score by the total possible score for that developmental stage. Thus, subscale scores are as numbers ranging from 0.0 to 1.0, with lower numbers representing more “adaptive” levels of functioning. Given the association of early and late adolescence social maladjustment and subsequent conversion, the present study will use an overall social maladjustment score composed of an average of early and late adolescent social maladjustment scores (Tarbox et al., 2013; Tarbox et al., 2014).
General scores were not used, in accordance with administration and scoring procedures outlined by van Mastrigt and Addington (2002). Adult PAS ratings were not included in the present analyses given the sample’s baseline age (mean: 19.63, SD: 4.29) and lack of utility for 44.6% of the total participants (i.e., individuals under age 19).
Neurocognitive measures
such as verbal memory, verbal fluency, processing speed, attention, and executive functioning (Cornblatt et al., 2015; Frommann et al., 2010; Riecher-Rössler et al., 2009; Seidman et al., 2010). Neurocognitive tests, indices, ranges, and normative data from healthy control groups are provided in Table 1.
This study was developed and data collected prior to the Measurement and Treatment Research to Improve Cognition in Schizophrenia initiative and associated battery, which is currently the gold standard neurocognitive assessment in individuals with schizophrenia
spectrum illnesses (Green et al., 2004). However, half of the presently included indices are in the consensus battery (i.e., Trail Making Test A and B, Continuous Performance Test—Identical Pairs).
Intelligence (IQ) was measured using the Wechsler Adult Intelligence Test or the
Wechsler Intelligence Scale for Children-III, depending on age of the participant. Age-scaled IQ is computed from the following subtests: block design, arithmetic, digit symbol/coding,
Data Analyses
Data analyses were performed using Mplus version 7 (Muthén & Muthén, 2012) and SPSS version 23. Statistical significance will be defined as p < .05 unless otherwise specified. Latent Profile Analysis
Latent profile analysis (LPA) is useful in situations where a group may be better
represented by distinct subgroups or categories of individuals. LPA is used to identify subtypes of related cases, also known as latent classes. Classes are latent because they are not directly observable and must be identified based on a pattern of observable indicators (i.e., previously referred to as predictive indicators). Use of LPA is appropriate when it is hypothesized that internally homogenous latent subgroups are present, each subgroup responding similarly to a set of indicators, but not similarly to individuals in other subgroups. Thus, LPA assumes local independence of indicators, which can be defined as independence of indicators outside of an individual’s latent class. Subgroups are heterogeneous within the larger sample such that response patterns to indicators can be distinguished from one another based on subgroup membership (Collins & Lanza, 2010).
The broad objective of LPA is to capture meaningful response patterns within the data, or to meaningfully cluster individuals based on their responses on indicators of interest. The
number of distinct response patterns determines the number of classes. Thus, LPA is an analogue of factor analysis; where factor analysis often investigates the latent structure of variables, LPA and other finite mixture models investigate the latent structure of cases. Similar to factor
researcher must assign labels to the latent classes that are generated. Similar to interpreting factor loadings to assign indices to factors, an individual’s mean posterior probability of class
membership must be examined to determine subgroup membership.
Conceptual underpinnings of latent variable models are such that the latent variable (i.e., risk subgroup membership) is what affects indicators (e.g., suspiciousness, unusual thought content, neurocognitive impairment, etc.). The causal flow is from the latent variable to the indicator variable. In the present study, subgroup membership associated with higher risk of transition would affect increased symptom ratings. Further, there are two influences that determine an individual’s observed response on the indicator variable, the individual’s latent class membership (i.e., subgroup membership) and error. As error variance is decreased, there is a greater likelihood that the individual’s observed responses on indicators are reflections of the individual’s latent class. To this end, it is vital to use indices with strong psychometric
properties. An advantage of LPA is that, like other latent variable models, LPA estimates and adjusts for measurement error (Collins & Lanza, 2010).
transformation, normality of residuals, and homoscedasticity, all of which may be violated if latent subgroups exist among CHR individuals (Collins & Lanza, 2010).
Aims & Hypotheses
Hypothesis 1: It was hypothesized that LPA methods will reveal homogenous subgroups from the psychopathologically heterogeneous sample. To evaluate the first
hypothesis, an exploratory LPA was conducted with the full sample (CHR and HSC individuals; n = 271). The combined sample was used because 5 individuals converted within the HSC group
(14.7% of total converters), thus there may be latent subgroups of interest among HSC individuals. If internally homogenous latent subgroups truly exist among the CHR subgroup, they would be identified in applying LPA to the combined sample. The following continuous indicators were entered in the LPA model: SOPS individual symptoms, CDSS total symptoms, and all neurocognitive indicators included in Table 1.
In the present study, the number of classes were not estimated a priori, but were
ascertained from a combination of model fit statistics and interpretability. The model of best fit (i.e., number of classes) was determined from examinations of all of the following criteria: (1) Akaike’s Information Criteria (AIC; Lin & Dayton, 1997), Bayesian Information Criteria (BIC; Schwarz, 1978), and sample size adjusted BIC (ssa BIC; Sclove, 1987) (lower values are