ADVANCEMENTS AND APPLICATIONS OF IONIC CONDUCTIVITY DETECTION TO MICROCOLUMN AND MICROFLUIDIC SEPARATIONS
Patty Jorene Dennis
A dissertation submitted to the faculty of the University of North Carolina at Chapel Hill in partial fulfillment of the requirements for the degree of Doctor of Philosophy in the Department of Chemistry.
Chapel Hill 2007
Approved by:
ABSTRACT
Patty J. Dennis
ADVANCEMENTS IN CONDUCTIVITY DETECTION FOR USE WITH MICROCOLUMN AND MICROFLUIDIC DEVICES
(Under the direction of James W. Jorgenson)
The research presented herein describes developments and applications of conductivity detection on both capillary and microfluidic platforms. Contactless
conductivity detection is the foundation for this work and has been developed to provide an alternative means of universal detection from the traditionally used method of
ultraviolet absorbance. Through the application of conductivity detection, a photothermal absorbance detector has also been developed. This detector provides a means of optical detection that is not subject to some of the limitations found in traditional absorbance methods, such as path length, and as such, has been applied to the small volume sampling regions found in microfluidics.
electrophoresis systems has been developed. Experimental evidence has indicated the presence of an ion depletion region at the capillary inlet which indicates a unique interaction between these phenomena.
Contact conductivity detection has been developed for use with microfluidic devices. A planar electrode configuration has been developed for conductivity detection on microchips. The decreased area inherent to planar electrodes necessitates a contact detection method. Proof of concept studies and investigation into electrode geometry and fabrication have been performed. Initial studies into the use of polyelectrolytic salt bridge electrodes have also been undertaken as an alternative to traditional metal electrode systems.
Photothermal absorbance detection has been developed for use with microfluidic systems as an alternative to absorbance detection. Due to the path length dependence of traditional absorbance detection methods, it has been severely limited in practicality for small volume detection. Both theoretical and experimental investigations have shown an enhancement in the photothermal signal observed on a microfluidic platform. In addition, modifications to the photothermal system have also been made to enhance the stability and magnitude of the signal observed.
ACKNOWLEDGEMENTS
It’s definitely true what they say about it taking a village to raise a child. There are a ton of people who have been extremely influential in my life and who have helped me to get where I am today. There have also been a lot of people who have put up with the “Patty moments” in life and have shown me how to be true to myself and as a person. I am profoundly grateful for all of the lessons that life has taught me, and especially grateful to those who have helped me to overcome them and, more important, to find humor in them.
First and foremost, I would like to thank my parents, Richard and Yong Dennis, and my grandmother, Gwendolyn Dennis, for all their love and support. Throughout my life they have been the foundation on which I have stood and have often been the framework that has held me up and given me the strength to persevere through even the most challenging obstacles. They taught me to never give up on a dream and to always have passion…passion for people, passion for goals, and, most importantly, passion about life. To them I am in a debt which I will always strive to repay, but which I may never quite be able to.
end. A special thanks to Erin Ferguson for putting up with me on the good days and bad and for her work on the project. I’d also like to extend thanks to Dr. Ramsey and
everyone in the Ramsey group for thoughtful discussions and advice, especially J.P. Alarie, Kevin Braun, Honggu Chun, and Hamp Henly who were all a tremendous help with the work in this manuscript. I owe special recognition to Charles Evans, who has been a wonderful friend to me throughout all of graduate school and who has been there for me through all the good and bad times of the last several years. I thank you for your friendship, kindness, and most importantly, for your patience.
It wouldn’t be right for me to leave out the people who have helped pave my road to graduate school. This entire journey started at the University of Texas in Austin. Dr. Jason Shear gave me the opportunity to experience individual research first hand, and I am extremely grateful for that first opportunity to get my feet wet. During my
undergraduate experience, I was paired with a mentor who continues to be a friend and advisor. Dr. Theodore Curey has taught me too much to put onto paper about the
interplay of personalities and progression in life. It was through that exciting experience that the decision to pursue science as a discipline was established.
together and spend it in tears of laughter. Thanks for allowing Dr. Jaeger passage onto Dodge Island.
TABLE OF CONTENTS
List of Tables ... xv
List of Figures ... xvi
List of Abbreviations ... xxvi
List of Symbols ... xxx
Chapter 1: Detection Methods for Microcolumn Separations... 1
1.1 Challenges of Microcolumn Separations... 1
1.2 Challenges to Conventional Detection Techniques ... 2
1.3 Alternative Detection Strategies ... 5
1.3.1 Conductivity Detection ... 6
1.3.2 Photothermal Absorbance Detection ... 10
1.4 Scope of Dissertation and Overall Research Goals ... 12
1.5 References... 14
Chapter 2: Further Development and Optimization of a Contactless Conductivity Detector... 19
2.1 Introduction... 19
2.2 Basic Background and Principles ... 20
2.2.1 Capacitively Coupled Contactless Conductivity Detection (C4D) ... 20
2.2.2 Buffer Systems Used in C4D... 22
2.3 Experimental... 23
2.3.2 Capillary Electrophoresis System ... 24
2.3.3 Contactless Conductivity Detection System... 25
2.4 Experimental Results and Discussion... 27
2.4.1 Excitation Frequency ... 27
2.4.2 Electrode Length... 29
2.4.3 Capillary Inner Diameter ... 31
2.4.4 Investigations of Noise ... 33
2.4.4.1 Detector Position Relative to High Voltage Power Supply... 34
2.4.4.2 Buffer Systems... 36
2.4.4.2.1 Buffer Composition ... 38
2.4.4.2.2 Concentration of Buffer ... 41
2.4.4.2.3 Buffer Solution Stirring ... 43
2.5 Concluding Remarks... 44
2.6 Tables and Figures ... 47
2.7 References... 73
Chapter 3: Ion Movement in Capillary Electrophoresis Systems... 75
3.1 Introduction... 75
3.1.1 Predicted Noise in Contactless Conductivity – Capillary Electrophoresis Systems ... 76
3.1.2 Solution Stirring and Conductivity Jumps... 77
3.2 Experimental... 78
3.2.1 Materials and Buffers... 78
3.2.2 Capillary Electrophoresis System ... 79
3.2.3 Contactless Conductivity System ... 79
3.2.4 Capillary “Wiggling” System ... 81
3.3.1 Buffer Solution Stirring ... 82
3.3.2 Capillary Wiggling... 83
3.3.2.1 Wiggling Frequency... 84
3.3.3 Large Vials and Bridge Vials... 85
3.3.4 Time Dependent Wiggling... 86
3.3.5 Flow Considerations ... 88
3.3.5.1 Hydrodynamic Flow ... 88
3.3.5.2 Electrokinetic Flow... 89
3.3.6 Noise ... 90
3.3.7 Capillary Tip Considerations ... 92
3.4 Results of Simulations and Discussion... 95
3.4.1 Capillary Tip Effects... 96
3.4.2 Interaction of Electric and Flow Fields... 97
3.5 Concluding Remarks... 101
3.6 Tables and Figures ... 105
3.7 References... 136
Chapter 4: Computational Investigations of a Conductivity Based Photothermal Absorbance Detector... 137
4.1 Introduction... 137
4.1.1 Basic Theory and Background... 138
4.2 Experimental... 140
4.2.1 Simulation Software and Hardware ... 140
4.2.2 CoventorWare Simulation Setup ... 141
4.3 Simulated Results and Discussion ... 145
4.3.3 Laser Spot Size and Gap Size ... 148
4.3.4 Laser Power and Channel Depth... 151
4.3.5 Flow Simulations ... 155
4.4 Concluding Remarks... 156
4.5 Tables and Figures ... 158
4.6 References... 175
Chapter 5: Development of a Conductivity Detector for Use with Microfluidic Devices... 176
5.1 Introduction... 176
5.1.1 Background ... 177
5.1.1.1 Microfluidics... 177
5.1.1.2 Conductivity Detection on Microchips... 180
5.2 Experimental... 182
5.2.1 Materials and Buffers... 182
5.2.2 Electrophoresis Setup... 183
5.2.3 Conductivity Setup... 184
5.2.4 Microchip Fabrication... 186
5.2.4.1 Master Fabrication ... 186
5.2.4.2 PDMS Chip Fabrication... 188
5.3 Results and Discussion ... 192
5.3.1 Electrical Model of Contact Conductivity ... 193
5.3.2 Experimental Investigations... 195
5.3.2.1 Effect of Gap Width and Excitation Voltage... 195
5.3.2.2 Excitation Frequency ... 196
5.3.3 Electrode Investigations... 197
5.3.3.2 Electrode Width ... 200
5.3.4 Initial Separations ... 201
5.4 Concluding Remarks... 202
5.5 Tables and Figures ... 204
5.6 References... 223
Chapter 6: Photothermal Absorbance Detection for Use with Microfluidic Devices... 227
6.1 Introduction... 227
6.2 Experimental... 228
6.2.1 Materials and Buffers... 228
6.2.2 Preparation of dasbyl-tagged glucosamine ... 230
6.2.3 Optical Setup... 230
6.2.4 Photothermal Electronics ... 231
6.2.5 Electrophoresis Setup... 234
6.2.6 Chip Fabrication... 235
6.2.6.1 Quartz Microchips ... 235
6.2.6.2 Polyelectrolyte Salt Bridge Electrode (PSBE) Microchips ... 238
6.3 Experimental Results and Discussion... 240
6.3.1 PDMS ‘Sandwich” Microchip ... 240
6.3.1.1 Excitation Frequency and Voltage... 241
6.3.1.2 Concentration Study... 242
6.3.1.3 Optical Modulation (Chopping) Frequency... 243
6.3.1.4 Laser Power ... 243
6.3.1.5 PDMS Investigations with an Innova FReD Laser... 244
6.3.2.2 Excitation Voltage ... 248
6.3.2.3 Laser Power ... 249
6.3.2.4 Optical Modulation (Chopping) Frequency... 250
6.3.2.5 Concentration... 251
6.3.2.6 Separation ... 252
6.4 Concluding Remarks... 252
6.5 Tables and Figures ... 255
LIST OF TABLES
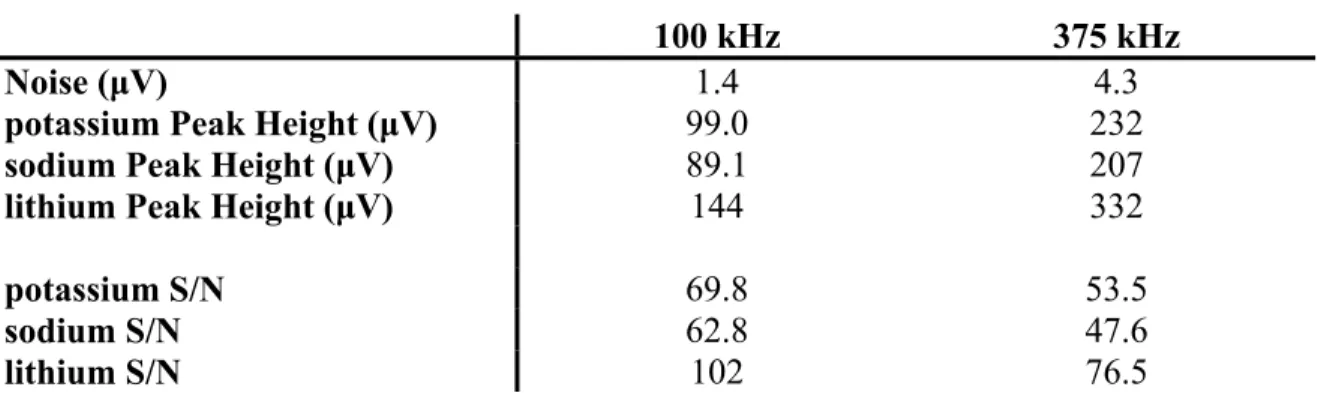
Table 2-1. Summary of results from an investigation of the effect of excitation frequency. The sample of a 10 ppm mixture of Na+, K+, and Li+ ions in 20 mM MES/20 mM His buffer at pH 6.1. Analysis was performed on an SR844 lock-in amplifier. The excitation voltage was held constant at
20 Vp-p in both cases. ... 47 Table 2-2. Comparison of results obtained with two different lock-in
amplifiers, an SR810 and an SR844. The sample was a 10 ppm mixture of Na+, K+, and Li+ ions in 20 mM MES/20 mM His buffer at pH 6.1. The
excitation was a 2 Vp-p, 100 kHz sinusoidal signal in both cases. ... 48 Table 2-3. Results taken from reference 7 showing the theoretical and
experimental response of the contactless conductivity system to a 10 ppm
solution of lithium... 49 Table 2-4. Calculation of expected noise values in the contactless
conductivity system. The measured voltage is the response to a 20 mM MES/20 mM His solution. *This is the shot noise measured in the
detection electrode current... 50 Table 2-5. Small sample of the buffers used found in literature... 51 Table 2-6. Summary of buffers tested with contactless conductivity
detection. The concentration of the buffers listed is 20 mM for each component, with the exception of propionic acid/dihydroxybenzylamine, which was used at 10 mM. DHB is dihydroxybenzylamine. ND designates that the signal was indistinguishable from the baseline. UI designates that
a peak assignment could not be made... 52 Table 2-7. Summary of results in an investigation of the contribution of
each buffer species to the buffering capacity and overall noise. ... 53 Table 4-1. Material properties used for photothermal simulations in
CoventorWare. The electrical conductivity of water is assumed to be 100
LIST OF FIGURES
Figure 2-1. Equivalent circuits for contactless conductivity detection with shielding (A) and no shielding (B) to prevent capacitive leakage of signal between the electrodes (CL). CW is the wall capacitance and RS is the
solution resistance... 54 Figure 2-2. Experimental contactless conductivity - capillary
electrophoresis setup... 55 Figure 2-3. Frequency response of the OPA602 operational amplifier with
a 1 MΩ feedback resistor. The solution used for this investigation was 20 mM MES/20 mM His at pH 6.1. The response was measured using an
SR844 lock-in amplifier. The input voltage was 2 Vp-p... 56 Figure 2-4. Comparison of separation of 10 ppm Na+, K+, and Li+ ions in
20 mM MES/20 mM His buffer at pH 6.1 at 375 kHz (A) and 100 kHz (B)
using an SR844 lock-in amplifier. The excitation input was 20 Vp-p. ... 57 Figure 2-5. Comparison of separation of 2 ppm Na+, K+, and Li+ ions in 20
mM MES/20 mM His buffer at pH 6.1 using an SR810 (A) and SR844 (B)
lock-in amplifier at 100 kHz. The excitation input was 20 Vp-p. ... 58 Figure 2-6. Response of various length electrodes using 10 ppm sodium
(A) and potassium (B) in 20 mM MES/20 mM His. The excitation was 20
Vp-p at 100 kHz... 59 Figure 2-7. Signal to noise ratio of 10 ppm potassium in 20 mM MES/20
mM His at pH 6.1. The excitation was 20 Vp-p at 100 kHz. ... 60 Figure 2-8. Response of 10 ppm K+ in 20 mM MES/His using an input
voltage of 20 Vp-p using various length excitation (A) and detection (B)
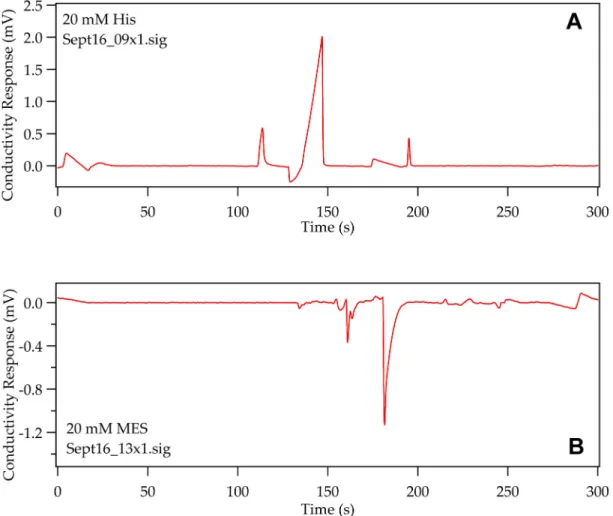
electrodes. ... 61 Figure 2-9. Lithium chloride front showing the measured conductivity
signal... 62 Figure 2-10. Measured front height of 10 ppm lithium chloride in 20 mM
MES/20 mM His buffer at various flow rates... 63 Figure 2-11. Conductivity response to 10 ppm lithium chloride in 20 mM
MES/20 mM His buffer in various inner diameter capillaries. The blue squares are for electrokinetically driven flow, while the red circles are
responses obtained with pressure driven flow. ... 64 Figure 2-12. Noise associated with measurements taken at various
distances from the high voltage power supply for (A) 20 mM MES/His
Figure 2-13. Noise associated with measurements taken at various
distances from the high voltage power supply for (A) 2.5 mM KCl and (B)
3.4 mM NaCl. ... 66 Figure 2-14. Structures of MES and Histidine... 67 Figure 2-15. Electropherograms showing the separation of a 10 ppm
mixture of Na+, K+, and Li+ in (A) 20 mM MES/His (B) 20 mM
PIPES/His and (C) 20 mM HEPES/Arg. ... 68 Figure 2-16. Electropherograms showing the separation of a 10 ppm
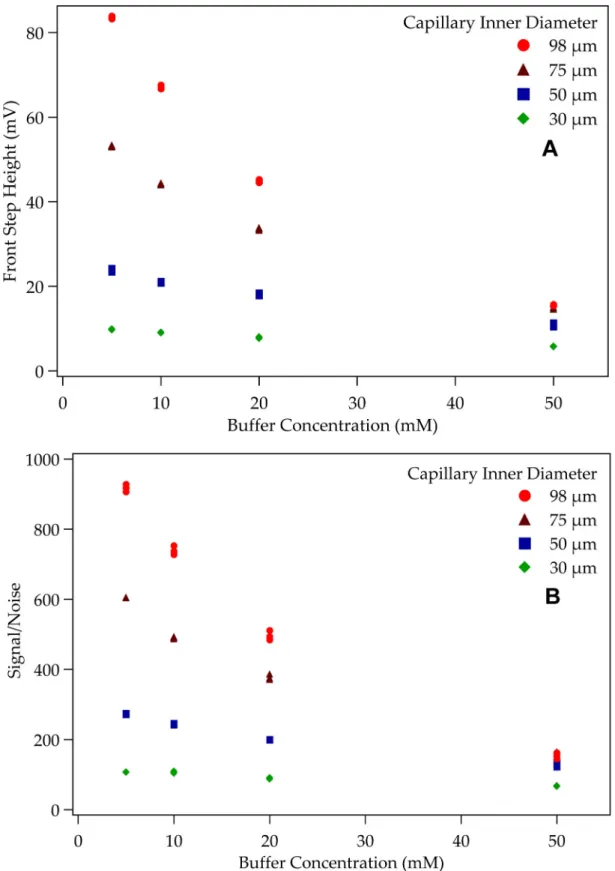
mixture of Na+, K+, and Li+ in (A) 20 mM His (B) 20 mM MES. ... 69 Figure 2-17. Effect of buffer concentration on the (A) conductivity
response of a 10 ppm lithium chloride front (electrokinetically driven) and the (B) signal to noise ratio using various inner diameter capillaries in 20
mm MES/His. ... 70 Figure 2-18. Effect of buffer concentration on the (A) conductivity
response of a 10 ppm lithium chloride front (pressure driven) and the (B) signal to noise ratio using various inner diameter capillaries in 20 mm
MES/His... 71 Figure 2-19. Comparison of the conductivity response of electrokinetically
and pressure driven fronts of 10 ppm lithium chloride in 20 mM MES/His. ... 72 Figure 3-1. Background conductivity (blue) and electrophoresis current
(red) traces showing the effect of buffer solution stirring in a 50/360 (i.d./o.d.) capillary using 3.4 mM NaCl as the electrolyte solution under an
applied field of 300 V/cm. ... 105 Figure 3-2. Capillary wiggling system; (A) is a top view showing the brass
plate and capillary pivot system, while (B) is a side view showing the
motor... 106 Figure 3-3. Stirring of 20 mM MES/20 mM His with a magnetic stir plate... 107 Figure 3-4. Stirring of a 3.4 mM solution of sodium chloride with the
“capillary wiggler”... 108 Figure 3-5. Frequency calibration curve for “capillary wiggler” for a
solution of 3.4 mM sodium chloride... 109 Figure 3-6. Magnitude of conductivity jump with increasing wiggling
frequency for a solution of 3.4 mM sodium chloride. ... 110 Figure 3-7. Conductivity response using 450 mL reservoir vials with a
Figure 3-8. Bridge vials ... 112 Figure 3-9. Conductivity jump observed with solutions of (A) 3.4 mM
sodium chloride and (B) 20 mM MES/His using the bridge vials and
capillary wiggling. ... 113 Figure 3-10. Front of MES and His plotted along with the conductivity
jump associated with movement of the inlet of a capillary back and forth
in MES/His buffer... 114 Figure 3-11. Conductivity jump associated with capillary movement in a
solution of 2.5 mM potassium chloride (green) and a trace showing the
migration of a front of 4 mM potassium (red). ... 115 Figure 3-12. Conductivity jump for a solution of 2.5 mM potassium
chloride. Hydrodynamic pressure was used to flow the solution though the capillary. Capillary movement lasted for 60 seconds and occurred in the time period from 60-120 seconds. (*) denotes the system peak. Green and red arrows indicate the approximate times of application and cessation of
wiggling, respectively... 116 Figure 3-13. Conductivity jump for a solution of 2.5 mM potassium
chloride (A) without (background subtracted) and (B) with a height differential of 30 cm using an acrylamide coated capillary. Green and red arrows indicate the approximate times of application and cessation of
wiggling, respectively... 117 Figure 3-14. Conductivity trace for a solution of 2.5 mM potassium
chloride in an acrylamide coated capillary. Capillary movement was for 60 seconds. Green and red arrows indicate the approximate times of
application and cessation of wiggling, respectively. ... 118 Figure 3-15. Conductivity noise measurements taken for a solution of 2.5
mM potassium chloride under different conditions throughout a capillary
movement study... 119 Figure 3-16. Conductivity noise measurements taken for a solution of 20
mM MES/His under different conditions throughout a capillary movement
study... 120 Figure 3-17. SEM image showing an end-on view of a fused silica
capillary after filing... 121 Figure 3-18. SEM images of (A) 13° (B) 25° (C) 33° (D) 45° and (E) 65°
Figure 3-19. Conductivity traces for coned capillaries. Green and red arrows indicated the approximate times of application and cessation of
wiggling, respectively... 123
Figure 3-20. SEM image of the tip of the 13° capillary. ... 124
Figure 3-21. Etched capillary. This was originally a capillary that was coned to 13°. ... 125
Figure 3-22. Etched capillaries showing some of the deformities encountered. ... 126
Figure 3-23. SEM images of commercially available Taper Tips. ... 127
Figure 3-24. SEM images of an (A) incompletely and (B) completely etched Taper Tip. ... 128
Figure 3-25. Conductivity jump for a solution of 2.5 mM potassium chloride in an (A) unmodified Taper Tip and an (B) etched Taper Tip. Green arrows indicate when wiggling started and red arrows indicated when wiggling ceased... 129
Figure 3-26. Electric potential shown as a (A) contour plot and an (B) isoplot in the inlet reservoir after application of 1.5 V at the end of the capillary... 130
Figure 3-27. Potential and electric field plots for a blunt ended capillary... 131
Figure 3-28. Potential and electric field for a 15° coned capillary ... 132
Figure 3-29. Hypothetical electric and flow field lines. ... 133
Figure 3-30. (A) plot of velocity field using FEMLAB 3.0a and (B) Isosurface plot of velocity field using CoventorWare ... 134
Figure 3-31. Velocity due to diffusion and migration for the sodium ion... 135
Figure 4-1. A 50 µm x 50 µm x 150 µm channel with 50 µm x 10 µm x 1 µm platinum electrodes. The green cube in the center denotes the thermooptically heated region of the channel, while the pink areas represent silica substrates. The blue layer on the bottom is a silicon substrate which is the default setting on which all other materials are placed. ... 159 Figure 4-2. Manhattan bricks mesh of a 50 µm x 50 µm x 150 µm channel
entities that are smaller than 10 µm in any dimension, a mesh comprising
the entire dimension is used... 160 Figure 4-3. Simulated average temperature response of a 10 µm x 50 µm x
1 mm (d x w x l) channel with a 10 µm x 50 µm x 50 µm (d x w x l) thermooptically heated region. The response is due to 0.33% absorption of
200 mW laser light, using a 50 ms cyclic heating parameter. ... 161 Figure 4-4. Temperature change associated with different heating regions
in a 50 µm square capillary. The red trace is the average temperature change in a 50 µm cube, while the blue trace is the average temperature in a region 50 µm x 50 µm x 1 mm with a thermooptically heated region comprising of a 50 µm cube, which approximates the capillary
photothermal system. ... 162 Figure 4-5. Experimental photothermal signal obtained from rastering the
laser beam across the electrodes and the detection region (gap). The larger response on the left is the response obtained while in close proximity to the detection electrode, while the smaller response on the right is obtained while the laser beam is close to the excitation electrode. The detection region, or gap, gives a response as represented by the trace between the electrode responses. This data was collected on a PDMS chip consisting of a 75 µm square channel with 30 nm thick electrodes (10 nm chromium
and 20 nm platinum). ... 163 Figure 4-6. Average temperature change associated with laser spot
location after 50 ms of continuous exposure to light. (A) lateral distance (B) cross channel distance. This simulation was performed using a
thermooptically heated region 1 mm wide and 50 µm deep in a region 180 µm long. The laser power used was based on 1.6% absorption of 200 mW
light. ... 164 Figure 4-7. Simulated effect of laser power on the spatial extent of heating
in a 50 µm x 20 µm channel in a quartz microchip after 50 ms of continuous exposure to light. Shown in the graph is the average temperature taken as a function of distance from the center of the
thermooptically heated region, designated as the zero point on the x axis.
The thermooptically heated region is 50 µm x 20 µm x 50 µm (l x d x w). ... 165 Figure 4-8. Effect of electrode spacing on the average temperature in the
detection region. This simulation was performed with a 50 µm deep, 50 µm wide channel. The region being heated was a 10 µm x 10 µm x 50 µm
rectangle... 166 Figure 4-9. Simulated effect of laser spot size on the average temperature
exposure to light. This is based on 500 mW laser light with 0.33%
absorption in a channel with 50 µm x 10 µm (w x d) dimensions... 167 Figure 4-10. Temperature distribution of a 50 µm laser spot in a 50 µm x
10 µm channel (w x d) simulating 0.33% absorption of light by 50 µM dasbyl glucosamine at a laser power of 50 mW. (A) is an overhead view of the chip while (B) is a side view of the same chip, showing the thermal
distribution of temperature after 50 ms of continuous exposure to light... 168 Figure 4-11. The maximum temperature in the thermooptically heated
region of a microchip with channel dimensions of 10 µm x 50 µm (d x w) after 50 ms of continuous exposure to light. The area heated was a 50 µm
cube... 169 Figure 4-12. The average temperature in a thermooptically heated region
modeled as a 50 µm cube in a 10 µm microchip. A heat generation parameter was used to heat this cube for 50 ms using powers
corresponding to 0.33% absorption of the overall power. ... 170 Figure 4-13. Simulated effect of laser power on the average temperature in
the thermooptically heated region in a 10 µm, 30 µm, and 50 µm
microchip. The thermooptically heated region was held constant at 50 µm x 50 µm, while the channel depth was changed for each chip. The
percentage of light absorbed was a fraction based on the channel depth. The average temperature was taken 50 ms after continuous application of
laser light... 171 Figure 4-14. Effect of channel depth on the average temperature in the
detection region. This simulation was performed using a corrected laser power of 400 mW. For each model used, the aspect ratio was held
constant at 0.25. ... 172 Figure 4-15. Temperature distribution in the thermooptically heated region
with (A) 1 mm/s fluid flow and (B) 50 mm/s in a 50 µm simulated
microchip where the detection region is 180 µm x 1 mm (l x w). The laser light is applied for 100 ms at 1.6% of 200 mW. The arrow in each figure
denotes the direction of flow. The laser spot was 20 µm... 173 Figure 4-16. Spatial distribution of temperature across detection region
(gap) with various flow rates in the simulated microchip in Figure 4-13. The absolute temperature was taken after 100 ms of continuous
application of 0.33% of 200 mW laser light. The chip used in this
simulation was a 30 µm chip, with a channel width of 1 mm and detection
Figure 5-2. Finished PDMS “sandwich” chip. Shown in figure A is a
pressure chip, while B is an electrophoresis chip. ... 206 Figure 5-3. Simplified circuit used to model the contact conductivity
detector on a microfluidic chip. ... 207 Figure 5-4. Capacitive reactance of the electrodes at 100 kHz. This value
is based on a 16 µF/cm2 capacitance (metals in liquid). ... 208 Figure 5-5. Modeled and experimental background conductivity. Both sets
of data are based on 20 mM MES/20 mM His at 100 kHz... 209 Figure 5-6. Modeled response of the effect of changing the detection width
(gap) based on 20 mM MES/20 mM His excited at 0.5 Vp-p and 100 kHz. ... 210 Figure 5-7. Modeled effect of changing the electrode width based on the
background conductivity obtained with 20 mM MES/20 mM His at an
excitation voltage of 0.5 Vp-p and a frequency of 100 kHz... 211 Figure 5-8. Effect of various gap widths on the (A) background
conductivity and (B) signal response of 50 ppm sodium chloride in 20 mM
MES/His... 212 Figure 5-9. Effect of excitation frequency on (A) conductivity background
and (B) signal of simple ions in 20 mM MES/His using an excitation
voltage of 250 mVp-p... 213 Figure 5-10. Effect of excitation frequency on the signal to noise of 10
ppm sodium, potassium, and lithium in 20 mM MES/20 mM His using an
excitation voltage of 250 mVp-p. ... 214 Figure 5-11. Peeling away of 10 nm chrome/20 nm platinum electrodes. ... 215 Figure 5-12. Effect of electrode thickness on the (A) background
conductivity and (B) signal response to 50 ppm sodium in 20 mM
MES/His at a frequency of 100 kHz. ... 216 Figure 5-13. Effect of electrode thickness on (A) noise and (B) signal to
noise of 50 ppm sodium in 20 mM MES/His using an excitation frequency
of 100 kHz... 217 Figure 5-14. SEM images of (A) 10 nm chrome/20 nm platinum and (B)
30 nm iridium electrodes after the application of 3 kV (600 V/cm) in a PDMS “sandwich” chip. The white arrows indicate in which direction
profile data was taken (shown in Figure 5-15). ... 218 Figure 5-15. Profile of (A) 10 nm chrome/20 nm platinum and (B) 30 nm
“sandwich” chip. Figure 5-14 shows in which direction this data was taken
(indicated by arrows). ... 219 Figure 5-16. Effect of electrode width on (A) background conductivity and
(B) signal response to 50 ppm sodium chloride in 20 mM MES/His at a
frequency of 100 kHz... 220 Figure 5-17. Effect of electrode width on the (A) noise and (B) signal to
noise of 50 ppm sodium chloride in 20 mM MES/His at an excitation
frequency of 100 kHz... 221 Figure 5-18. Initial separation of three inorganic ions (potassium, sodium,
and lithium) in 20 mM MES/20 mM His using an excitation voltage of 200 mVp-p at 100 kHz. The separation was performed on a PDMS sandwich chip using a 1 second electrokinetic injection and 200 V/cm
electric field strength... 222 Figure 6-1. UV-Vis absorbance spectrum for a solution of 3.2 mM
DABSYL tagged glucosamine in water... 255 Figure 6-2. Experimental photothermal setup showing both optical and
electronic components. ... 256 Figure 6-3. Original two electrode PSBE microchip ... 257 Figure 6-4. PDMS microchip; effect of excitation frequency for 20 mM
MES/20 mM His – (A) photothermal background (B) background
conductivity using 0.2Vp-p at 100 kHz... 258 Figure 6-5. PDMS microchip; effect of excitation frequency for 20 µM
DABSYL glucosamine in 20 mM MES/His using 0.2Vp-p at 100 kHz –
(A) signal (B) noise... 259 Figure 6-6. PDMS microchip; effect of excitation frequency on the signal
to noise ratio for a 20 µM solution of DABSYL glucosamine in 20 mM
MES/His using an excitation of 0.2Vp-p at 100 kHz ... 260 Figure 6-7. PDMS microchip; effect of excitation voltage for 20 mM
MES/20 mM His – (A) conductivity background (B) photothermal
background using 0.2Vp-p at 100 kHz ... 261 Figure 6-8. PDMS microchip; effect of excitation voltage for 20 µM
DABSYL glucosamine in 20 mM MES/His using 0.2Vp-p at 100 kHz –
(A) signal (B) noise... 262 Figure 6-9. PDMS microchip; effect of excitation voltage on the signal to
noise ratio for a 20 µM solution of DABSYL glucosamine in 20 mM
Figure 6-10. PDMS microchip calibration plots using DABSYL
glucosamine in 20 mM MES/His buffer in (A) linear and (B) log formats... 264 Figure 6-11. PDMS microchip; effect of modulation frequency for 20 µM
DABSYL glucosamine in 20 mM MES/His using 0.2Vp-p at 100 kHz –
(A) signal (B) noise... 265 Figure 6-12. PDMS microchip; effect of modulation frequency on the
signal to noise ratio for a 20 µM solution of DABSYL glucosamine in 20
mM MES/His using an excitation of 0.2Vp-p at 100 kHz ... 266 Figure 6-13. PDMS microchip; effect of laser power for 20 µM DABSYL
glucosamine in 20 mM MES/His using 0.2Vp-p at 100 kHz – (A) signal (B)
noise ... 267 Figure 6-14. PDMS microchip; effect of laser power on the signal to noise
ratio for a 20 µM solution of DABSYL glucosamine in 20 mM MES/His
using an excitation of 0.2Vp-p at 100 kHz ... 268 Figure 6-15. PDMS microchip; effect of laser power using the Innova 300
FReD laser as the light source to probe a 20 µM solution of DABSYL
glucosamine in 20 mM MES/His using an excitation of 0.2Vp-p at 100 kHz ... 269 Figure 6-16. (A) PSBE microchip showing three salt bridges in a glass
(B270) microchip (B) PSBE microchip showing placement of the laser
spot... 270 Figure 6-17. (A) glass (B270) microchip with metal electrodes (B) metal
electrode microchip showing placement of the laser spot ... 271 Figure 6-18. Frequency response of PSBE and metal electrode microchips
using a solution of 20 mM MES/His. The excitation was 0.5Vp-p. The laser
power was 400 mW and modulated at 20 Hz. ... 272 Figure 6-19. Effect of excitation frequency on PSBE and metal electrode
microchips using a 5Vp-p signal to 50µM DABSYL glucosamine – (A)
photothermal response (A) noise ... 273 Figure 6-20. Signal to noise response to 50 µM DABSYL glucosamine in
20 mM MES/His for the PSBE and metal electrode microchips with
increasing excitation frequency at an excitation voltage of 5Vp-p... 274 Figure 6-21. Effect of excitation voltage on PSBE and metal electrode
microchips using a 100 kHz signal to 50µM DABSYL glucosamine – (A)
Figure 6-22. Signal to noise response to 50 µM DABSYL glucosamine in 20 mM MES/His for the PSBE and metal electrode microchips with
increasing excitation frequency at an excitation frequency of 100 kHz... 276 Figure 6-23. Effect of laser power on PSBE and metal electrode
microchips using a 100 kHz, 5Vp-p signal to 50µM DABSYL glucosamine
in 20 mM MES/His – (A) photothermal response (A) noise... 277 Figure 6-24. Signal to noise response to 50 µM DABSYL glucosamine in
20 mM MES/His for the PSBE and metal electrode microchips with increasing laser power at an excitation frequency of 100 kHz and voltage
of 5Vp-p... 278 Figure 6-25. Raw photothermal data. The inset shows the modulation of
the conductivity signal. ... 279 Figure 6-26. Effect of optical modulation (chopping) frequency on PSBE
and metal electrode microchips using a 100 kHz, 5Vp-p signal to 50µM DABSYL glucosamine in 20 mM MES/His – (A) photothermal response
(A) noise... 280 Figure 6-27. Signal to noise response to 50 µM DABSYL glucosamine in
20 mM MES/His for the PSBE and metal electrode microchips with increasing optical modulation (chopping) frequency at an excitation
frequency of 100 kHz and voltage of 5Vp-p... 281 Figure 6-28. Metal electrode microchip calibration plots using DABSYL
glucosamine in 20 mM MES/His buffer in (A) linear and (B) log formats... 282 Figure 6-29. Signal to noise ratio with increasing concentration of
DABSYL glucosamine in 20 mM MES/His buffer using an excitation of 5Vp-p at 100 kHz. The laser power was set to 400 mW and modulated at 20
Hz... 283 Figure 6-30. Electrophoretic separation of an 50 µM mixture of glycine,
proline and tryptophan in a 20 mM MES/His 65/35 acetonitrile/water buffer using an excitation of 5 Vp-p at 100 kHz. The laser power used for
LIST OF ABBREVIATIONS
Abbreviation Definition
18-crown-6 1,4,7,10,13,16-hexaoxacyclooctadecane
°C degree Celsius
A amp
AC alternating current
Arg Arginine
BGE background electrolyte
C4D capacitively coupled contactless conductivity detection cal calorie
CAPS 3-(cyclohexylamino)-1-propanesulfonic acid
CHES 2-(cyclohexylamino)-ethanesulfonic acid
CITP capillary isotachophoresis
cm centimeter d depth
DABSYL (dimethylamino) azobenzenesulfonyl
DAQ data acquisition
dB decibel
DC direct current
DHB dihydroxybenzylamine DTAB dodecyl trimethylammonium bromide fA femtoamp
GB gigabyte GHz gigaHertz h height
HCl hydrochloric acid
HEPES 4-(2-hydroxyethyl)piperazine-1-ethanesulfonic acid His Histidine
HPLC high performance liquid chromatography Hz Hertz
i.d. inner diameter
K Kelvin
KCl potassium chloride
kg kilogram kHz kiloHertz kV kilovolt
kΩ kiloohm
l length
LiCl lithium chloride
LiDS lithium dodecyl sulfate
LIF laser induced fluorescence
M molar
MES 2-morpholinoethansulfonic acid
mm millimeter
MOPS 3-(N-morpholino)-propanesulfonic acid
ms millisecond mV millivolt
mVp-p peak-to-peak millivolt
mW milliWatt
MΩ megaohm
nA nanoamp
NaCl sodium chloride
NaOH sodium hydroxide
ND not distinguishable
nm nanometer nV nanovolt
o.d. outer diameter
OPA operational amplifier
PCB printed circuit board
PDMS poly-dimethylsiloxane PEEK polyetheretherketone pF picoFarad
pg picogram
PIPES 1,4-piperazinediethanesulfonic acid pJ picoJoule
ppb parts per billion ppm parts per million
pS picoSiemen psi pounds per square inch pW picoWatt
rpm revolutions per minute
s second S/N signal to noise ratio
SEKC size-exclusion electrokinetic chromatography SEM scanning electron micrograph
TLS thermal lens spectroscopy
TMEC thermal modulation of electrical conductivity µm micrometer
µM micromolar
µ-TAS micro-total analysis system
µV microvolt V Volts
Vp-p peak-to-peak voltage
Vrms root-mean-square voltage
w width W watt
LIST OF SYMBOLS
Symbol Definition
A absorbance
b path length
c concentration C capacitance
CL leakage capacitance
S A
C − concentration of the anionic species in the sample zone
CW wall capacitance
e fundamental charge of an electron Er electric field vector
ε molar absorptivity
O
ε permittivity of vacuum
F Faraday’s constant
ƒ frequency
GBGE background conductivity
GS sample conductivity
j - 1
A
k transfer ratio
−
A
m mobility of the anionic species in the sample zone
−
E
m mobility of the anionic species in the buffer
+
E
m mobility of the cationic species in the buffer
η viscosity
PT transmitted power
Q charge on an ion
r radius
rˆ unit vector
R distance from rod
RS solution resistance
T transmittance
μ ion mobility
V Volts
XC capacitive reactance
Z impedance
z ion charge
∆G conductivity difference
Chapter 1:Detection Methods for Microcolumn Separations
1.1Challenges of Microcolumn Separations
As separation techniques continue to get smaller, and the desire for fast, high-throughput analyses using micro-total analysis systems (µ-TAS) becomes more prominent, the demand for increased sensitivity and selectivity in detection methods becomes more important. Research in the field of analytical detector development has centered on providing an ultra-sensitive detection method that gives as much information about the analyte of interest as quickly as possible. This is especially important in
electrokinetically driven separations, where in a capillary the total separation is complete within minutes, and even more so in a µ-TAS, where the entire analysis is complete on the order of several seconds. Development of microfluidic based platforms such as these – where complete analysis of an analyte, from sample preconcentration to enzymatic reactions, cell lysis, and detection are on a single microfluidic chip – has seen continued interest in the last several years, with detection being one of the integral components to the overall success of the sample analysis.1-9
Due to the small dimensions of the separation channels in microcolumn and microfluidic systems, necessitated by the need to provide an adequate means of
path-length dependence of Beer’s law. While one could imagine increasing the incident light power, it is also known that with traditional absorbance techniques this does not
necessarily result in improved signal to noise ratios. Thus, conventional methods of detection in microfluidic and microcolumn separation techniques have been based on either fluorescence or electrochemistry; however, it has been observed that these techniques, while highly sensitive and selective, lack a wide range of applicability to most analytes.10 Given this need, work to develop a detection method to overcome these issues will be presented and discussed.
1.2Challenges to Conventional Detection Techniques
Laser induced fluorescence (LIF) has been used extensively for small volume
not always available for every analyte of interest and modifications can often cause undesirable changes to the physical attributes of the analyte, including electrophoretic mobility and solubility. Additionally, derivatization reactions have been shown to cause matrix effects, including interference from unreacted derivatization reagents and
undesired reaction products, further decreasing the applicability of this technique to wider range of analytes.16
Amperometric techniques have been shown to be highly sensitive as well, allowing the quantization of analytes in the nanomolar range.17 This technique works by using a potential applied to an electrode to induce oxidation or reduction of the species of interest at the electrode surface while continuously monitoring the current. While
amperometry has proven to be sensitive, the detection method is extremely selective, as only analytes that undergo redox reactions at the specified potential are detected, and thus has limited applicability.18 Absorption of reaction products to the carbon electrode
surface can also reduce the electron transfer, and thus the activity, of this method.19 Since amperometric detection methods are mass flux sensitive techniques, in which only a small fraction of the analyte molecules undergo the electrochemical conversion, scaling of the electrochemical cell to the dimensions necessary for micro- and nanoscale
applications may result in a loss in sensitivity.10
Potentiometry is another electrochemical method that has been shown to be both selective and sensitive. While it is known that the electrode geometry and size has little effect on the measured potential – and could thus be used as a detection method in
with ion selective electrodes.20 Additionally, with all electrochemical detection
techniques, decoupling of the high (separation) electric field is a necessity, making these techniques difficult to implement in many electrophoresis systems.
While electrochemistry and fluorescence methods have proven to be highly sensitive and selective, optical absorbance techniques are still of interest as a detection method for chemical separations due to their extensive range of applicability.12 In this case, the amount of light transmitted through the sample is measured and related to the concentration of the analyte of interest via Beer’s law (equation 1).
A = εbc = -log T (1)
A is the absorbance, ε is the molar absorptivity of the analyte in M-1 cm-1, b is the path length of the detection cell in cm, c is the concentration of analyte in solution in mol/L, and T is the transmittance – the fraction of light transmitted through the sample. One of the main drawbacks to absorbance detection, however, is its direct dependence on path length. Although there have been many attempts to increase the path length of the detection cell, including incorporation of the Z-cell21, 22 and the bubble-cell,23 in which the size of the detection cell is increased based on changes in geometry, these methods have seen limited improvement over conventional methods due to the extra band
1.3Alternative Detection Strategies
An alternative universal detection technique to absorbance detection is conductivity detection. Like absorbance detection, this method of detection is concentration sensitive rather than mass sensitive because it does not solely rely on the amount of analyte at the electrode surface. Instead, conductivity detection measures the impedance of the solution between a set of electrodes relative to the background impedance. Like absorbance detection, conductivity detection has a wide range of applicability, as any species which alters the impedance of the solution will change the corresponding electrical conductivity. A significant decrease in the limits of detection, or increase in the signal to noise ratio, can be further achieved through the use of a lock-in amplifier.24 Thus, this type of
detection can provide a means of sensitive, universal detection that is able to be used with small volume separations.
While small volume separations continue to become more prevalent due to their increased resolving power and speed of analysis, the need for a universal detection strategy that can be applied to these smaller separation platforms becomes critical. Through investigations of conductivity detection and photothermal absorbance detection, the research presented in this dissertation demonstrates the potential of these techniques to provide an extremely sensitive, yet universal detection method. While the overall goal of this work is the development of a photothermal absorbance detector, work on
conductivity detection has been performed simultaneously, as this serves as a basis for the photothermal detection system being developed.
1.3.1Conductivity Detection
The conductivity detector, in a direct contact mode, first appeared in the literature as a means of detection for use with capillary isotachophoresis (CITP) systems in the 1970s. Development of this detector was necessitated by the need for a method that had high spatial resolving power, unlike thermometric detection techniques commonly used in CITP. Everaerts and colleagues sandwiched a 50 µm sheet of Terylene polymer film, with a 100 µm thick layer of a metallic foil on each side, between two pieces of Kel-F, in a butt-connected manner to ensure little fluidic leakage. The plastic Kel-F pieces were then fitted into a brass capillary holder. The center of the Terylene piece and the Kel-F pieces were then drilled out to match the inner diameter of the capillary used, to provide a uniform channel. In this configuration, the metal foil deposited on each side of the
alternating current (AC) and direct current (DC) modes were tested. However, it was found that in the DC mode, polarization of the electrode surface made definition of zone boundaries impossible. It was also noted that drops in the potential gradient occurred due to gas formation at the surface of the electrodes, further increasing the noise in the system. In the AC mode, it was observed that gas formation on the surface of the electrodes did not occur to a significant degree, despite having potential gradients of 50 mV along the length of the electrodes. It was noted, however, that absorption of hydrogen into the metallic layer decreased the sensitivity of the detection method over time.25
One method for circumventing the problems associated with direct contact measurements is to use the conductivity detector in a contactless mode. This was first developed for CITP in the 1980s as a means of detection that did not suffer from the irreproducibility and electrode fouling that commonly occurs with direct contact measurements. Gas and co-workers used a four electrode setup for detection, wherein a high frequency signal is applied to two electrodes and detected by the remaining two electrodes at the output end of a capacitive cell. The electrodes were made of 200 µm copper enameled wire placed in an equiplanar arrangement around the capillary. A high frequency signal was applied to each excitation electrode, with the signals being 180° out of phase. An operational amplifier set in differential mode, using the two detection electrodes, serves as an amplifier prior to rectification and filtering. While it was
Conductivity detection was first applied to capillary zone electrophoresis systems in an on-column manner in the late 1980s, by Huang, et al. This initial attempt at on-column detection was performed in the contact mode by placing 25 µm (o.d.) platinum wires into 40 µm (i.d.) holes drilled into the wall of a fused silica capillary directly opposite each other. The holes were placed such that the potential difference between them due to the electrophoretic separation field was minimized, lessening any electrochemical effects from the high separation field. The wires, or electrodes, were held in place using epoxy and the entire cell was sealed in a Plexiglas jacket. Using this setup, the detection volume was determined to be 30 pL, with detection of Li+ exceeding three orders of magnitude with good linearity.27 This setup was also used to quantify Li+ in human serum and provide a means for detection of low molecular weight carboxylic acids.28-30 However, the construction of the detector made this technique very difficult to implement, and as a result, it never found widespread use.
from shorter path lengths was not of concern. One added advantage of using cylindrical electrodes is the ease of placement. The electrodes can be placed anywhere along the length of the capillary and the placement can be changed quickly. The detection of inorganic cations and anions was demonstrated with this detector and shown to have limits of detection on the order of 200 ppb for sodium and chloride over a dynamic range that was more than three orders of magnitude.32
Since the introduction of the contactless conductivity system by both groups, there have been numerous papers in the literature dealing with the development and
optimization of the detection electronics,33-35 electrode configuration,36-41 and cell geometry.42, 43 There have also been papers dealing with the overall fundamental aspects of the detection method,43-46 including capillary inner diameter,47, 48 excitation frequency and voltage,33, 49-51 and even high voltage excitation.52, 53 As was discussed earlier, conductivity detection is a concentration sensitive detector, and as a result, there have also been a number of accounts where detection has occurred on miniaturized
1.3.2Photothermal Absorbance Detection
As an alternative to absorbance detection, thermooptical techniques, such as thermal lens spectroscopy (TLS), have been developed.16, 71-81 Thermooptical techniques are based on a nonradiative relaxation event triggered by the absorption of light. As light is absorbed by a species, the heat produced induces changes in intrinsic solution
properties, such as refractive index. Unlike optical techniques, thermooptical techniques have been thought of as path length independent since the measurement is not based on the amount of light transmitted through the sample. If one considers two volumes, one of 1 cm x 1 cm with a path length of 1 cm and the other 1 cm x 1 cm with a path length of 2 cm, both filled with identical solution, under conditions of low absorbance, the amount of energy absorbed per volume will remain the same, given identical experimental
conditions. This assumes an identical degree of heat escape through convection in each volume, or that the heat escaping from the smaller volume is not significantly greater than that of the larger volume.
this detection method can be applied to very small volume sampling regions. Limits of detection for 18 amino acids derivatized with (dimethylamino) azobenzenesulfonyl (DABSYL) have been shown to be as low as 750 attomole using a 150 mW argon ion laser at 457.9 nm.75 However, the complication of alignment of the optical system makes this a less desirable detection method. In an attempt to ease the complication of this system, a single laser method was introduced in 1986 by Skogerboe and Yeung wherein a beam splitter was used to provide both probe and pump beams to the detection region.73 Using this setup, it was shown that a limit of detection of 3 pg for benzopurpurin 4B – a red acid dye – could be achieved using a 90 mW argon ion laser at 514.5 nm. While this detection method reduces the complexity of the optical setup, additional electronic components, such as an acoustooptical modulator, are necessary for proper optical detection.
An alternative to refractive index detection using thermally triggered events is to probe viscosity changes in the solution. In aqueous solutions, the viscosity changes ~2% per degree of temperature change, which is more than two orders of magnitude more significant of a change observed using refractive index measurements (0.01% per degree) for aqueous solutions. While refractive index changes are more significant in organic solutions (0.04% per degree), the effect of viscosity measurements is greater, as this change is still ~2% per degree for these solutions.83 The work compiled in this
simulations, while also aiding in the overall development and optimization of the detection method, including fabrication, electronics, and detector optimization.
1.4Scope of Dissertation and Overall Research Goals
The ultimate goal of the research contained in this dissertation is complete development and optimization of the photothermal absorbance detection system in the ultraviolet region of the electromagnetic spectrum. On the road to this end goal, however, are many stops along the way. Since the development of the photothermal absorbance detection system ultimately relies on complete elucidation of the contactless conductivity system, further development of this system will be discussed in Chapter 2. While doing research into the optimization of the conductivity system, an interesting phenomenon was observed experimentally and investigated using both simulations and additional
1.5References
1. Beard, N.P.; Edel, J.B.; deMello, A.J. Electrophoresis 2004, 25, 2363-2373. 2. Craighead, H. Nature 2006, 442 (7101), 374-380.
3. Dittrich, P.S.; Tachikawa, K.; Manz, A. Analytical Chemistry 2006, 78, 3887-3907.
4. Gotz, S.; Karst, U. Analytical and Bioanalytical Chemistry 2007, 387, 183-192. 5. Lee, S.J.; Lee, S.Y. Applications in Microbiology and Biotechnology 2004, 64,
289-299.
6. McGlennen, R.C. Molecular Diagnostics 2005, 365-390.
7. Reyes, D.R.; Iossifidis, D.; Pierre-Alain, A.; Manz, A. Analytical Chemistry 2002, 74 (12), 2623-2636.
8. Rios, A.; Escarpa, A.; Gonzalez, M.C.; Crevillen, A.G. Trends in Analytical Chemistry 2006, 25 (5), 467-479.
9. Whitesides, G.M. Nature 2006, 442 (7101), 368-373.
10. Landers, J.P., ed. Handbook of Capillary Electrophoresis; CRC Press: Ann Arbor, MI, 1994.
11. Dovichi, N.J.; Chen, D. Single-Molecule Optical Detection, Imaging and Spectroscopy 1997, 223-243.
12. Skoog, D.A.; Holler, F.J.; Nieman, T.A. Principles of Instrumental Analysis. 5th ed.; Brooks/Cole Thomson Learning: United States, 1998.
13. Asakura, R.; Isobe, T.; Kurokawa, K.; Aizawa, H.; Ohkubo, M. Analytical and Bioanalytical Chemistry 2006, 386 (6), 1641-1647.
14. Duggal, R.; Pasquali, M. Physical Review Letters 2006, 96 (24), 246104/1-246104/4.
15. Min, J.Z.; Toyo'oka, T.; Kawanishi, H.; Fukushima, T.; Kato, M. Analytica Chimica Acta 2005, 550 (1-2), 173-181.
17. Pumera, M.; Merkoci, A.; Alegret, S. Trends in Analytical Chemistry 2006, 25 (3), 219-235.
18. Cunico, R.L.; Gooding, K.M.; Wehr, T. Basic HPLC and CE of Biomolecules; Bay Bioanalytical Laboratory: Richmond, CA, 1998.
19. Swinney, K.; Bornhop, D.J. Critical Reviews in Analytical Chemistry 2000, 30 (1), 1-30.
20. Vandaveer, W.R., IV ; Pasas-Farmer, S.A.; Fischer, D.J.; Frankenfeld, C.N.; Lunte, S.M. Electrophoresis 2004, 25 (21-22), 3528-3549.
21. Dasgupta, P.K.; Bellamy, H.S.; Liu, H. Talanta 1993, 40, 341-345. 22. Kahle, V. Biomedical Chromatography 1999, 13, 93-94.
23. Xue, Y.;Yeung, E.S. Analytical Chemistry 1994, 6, 3575-3580.
24. Johnston, S.E.; Fadgen, K.E.; Jorgenson, J.W. Analytical Chemistry 2006, 78, 5309-5315.
25. Everaerts, F.M.; Verheggen, T.P.E.M. Journal of Chromatography 1972, 73, 193-210.
26. Gas, B.; Demjanenko, M.; Vacik, J. Journal of Chromatography 1980, 192, 253-257.
27. Huang, X.; Pang, T.-K.J.; Gordon, M.J.; Zare, R.N. Analytical Chemistry 1987, 59, 2747-2749.
28. Huang, X.; Gordon, M.J.; Zare, R.N. Journal of Chromatography 1988, 425, 385-390.
29. Huang, X.; Gordon, M.J.; Zare, R.N. Journal of Chromatography 1989, 480, 285-288.
30. Huang, X.; Luckey, J.A.; Gordon, M.J.; Zare, R.N. Analytical Chemistry 1989, 61, 766-770.
31. da Silva, J.A.F.; do Lago, C.L. Analytical Chemistry 1998, 70, 4339-4343. 32. Zemann, A.J.; Schnell, E.; Volgger, D.; Bonn, G.K. Analytical Chemistry 1998,
70, 563-567.
34. Bastemeijer, J.; Lubking, G.W.; Laugere, F.; Vellekoop, M.J. Sensors and Actuators B 2002, 83, 98-103.
35. Johnston, S.E.; Fadgen, K.E.; Tolley, L.T.; Jorgenson, J.W. Journal of Chromatography A 2005, 1094, 148-157.
36. Laugere, F.; Guijt, R.M.; Bastemeijer, J.; Gert, v.d.S.; Berthold, A.; Baltussen, E.; Sarro, P.; van Dedem, G.W.K.; Michiel, V.; Bossche, A. Analytical Chemistry
2003, 75, 306-312.
37. Baltussen, E.; Guijt, R., M.; van der Steen, G.; Laugere, F.; Baltussen, S.; van Dedem, G.W.K. Electrophoresis 2002, 23, 2888-2893.
38. Lichtenberg, J.; de Rooij, N.F.; Verpoorte, E. Electrophoresis 2002, 23, 3769-3780.
39. Baldock, S.J.; Fielden, P.R.; Goddard, N.J.; Prest, J.E.; Brown, B.J.T. Journal of Chromatography A 2003, 990, 11-22.
40. Bai, X.;,Wu, Z.; Josserand, J.; Jensen, H.; Schafer, H.; Girault, H.H. Analytical Chemistry 2004, 76, 3126-3131.
41. Novotny, M.; Opekar, F.; Stulik, K. Electroanalysis 2005, 17 (13), 1181-1186. 42. Tuma, P.; Opekar, F.; Stulik, K. Electrophoresis 2002, 23, 3718-3724.
43. Kuban, P.; Hauser, P.C. Electrophoresis 2004, 25, 3387-3397.
44. Kaniansky, D.; Zelenska, V.; Masar, M.; Ivanyi, F.; Gazdikova, S. Journal of Chromatography A 1999, 844, 349-359.
45. Kuban, P.; Hauser, P.C. Electrophoresis 2004, 25, 3398-3405.
46. Brito-Neto, J.G.A.; da Silva, J.A.F.; Blanes, L.; do Lago, C.L. Electroanalysis
2005, 17 (13), 1198-1206.
47. Mayrhofer, K.; Zemann, A.J.; Schnell, E.; Bonn, G.K. Analytical Chemistry 1999, 71, 3828-3833.
48. Tanyanyiwa, J.; Galliker, B.; Schwarz, M.A.; Hauser, P.C. The Analyst 2002, 127, 214-218.
51. Gas, B.; Zuska, J.; Coufal, P.; van de Goor, T. Electrophoresis 2002, 23, 3520-3527.
52. Tanyanyiwa, J.; Schweizer, K.; Hauser, P.C. Electrophoresis 2003, 24, 2119-2124.
53. Tanyanyiwa, J.; Abad-Villar, E.M.; Fernandez-Abedul, M.T.; Costa-Garcia, A.; Hoffmann, W.; Guber, A.E.; Hermann, D.; Gerlach, A.; Gottschlich, N.; Hauser, P.C. The Analyst 2003, 128, 1019-1022.
54. Wang, J.; Gang Chen, G.; Muck, A.J. Analytical Chemistry A Pages 2003. 55. Guijt, R.M.; Baltussen, E.; van der Steen, G.; Frank, H.; Billiet, H.;
Schalkhammer, T.; Laugere, F.; Vellekoop, M.J.; Berthold, A.; Sarro, L.; van Dedem, G.W.K. Electrophoresis 2001, 22, 2537-2541.
56. Guijt, R.M.; Baltussen, E.; van der Steen, G.; Schasfoort, R.B.M.; Schlautmann, S.; Billiet, H.; Frank, H.; van Dedem, G.W.K.; van den Berg, A. Electrophoresis
2001, 22, 235-241.
57. Pumera, M.; Wang, J.; Opekar, F.; Jelinek, I.; Feldman, J.; Lowe, H.; Hardt, S. Analytical Chemistry 2002, 74, 1968-1971.
58. Wang, J.; Pumera, M. Analytical Chemistry 2002, 74, 5919-5923.
59. Berthold, A.; Laugere, F.; Schellevis, H.; de Boer, C.R.; Laros, M.;Guijt, R.M.; Sarro, R.M.; Vellekoop, M.J. Electrophoresis 2002, 23, 3511-3519.
60. Laugere, F.; Lubking, G.W.; Bastemeijer, J.; Vellekoop, M.J. Sensors and Actuators B 2002, 83, 104-108.
61. Galloway, M.; Stryjewski, W.; Henry, A.; Ford, S.M.; Llopis, S.; McCarley, R.L.; Soper, S.A. Analytical Chemistry 2002, 74, 2407-2415.
62. Macka, M.; Hutchinson, J.; Zemann, A.; Shusheng, Z.; Haddad, P.R. Electrophoresis 2003, 24, 2144-2149.
63. Guijt, R.M.; Baltussen, E.; van der Steen, G.; Frank, H.; Billiet, H.;
Schalkhammer, T.; Laugere, F.; Vellekoop, M.J.; Berthold, A.; Sarro, L.; van Dedem, G.W.K. Electrophoresis 2001, 22, 2537-2541.
64. Willauer, H.D.; Collins, G.E. Electrophoresis 2003, 24, 2193-2207.
66. Wang, J.; Pumera, M.; Collins, G.E.; Mulchandani, A. Analytical Chemistry 2002, 74, 6121-6125.
67. Hilder, E.F.; Zemann, A.; Macka, M.; Haddad, P.R. Electrophoresis 2001, 22, 1273-1281.
68. Galloway, M.; Soper, S.A. Electrophoresis 2002, 23, 3760-3768.
69. Oudhoff, K.A.; Macka, M.; Haddad, P.R.; Schoenmakers, P.J.; Kok, W.T. Journal of Chromatography A 2005, 1068, 183-187.
70. Kuban, P.; Abad-Villar, E.M.; Hauser, P.C. Journal of Chromatography A 2006, 1107, 159-164.
71. Dovichi, N.J.; Nolan, T.G.; Weimer, W.A. Analytical Chemistry 1984, 56, 1700-1704.
72. Nolan, T.G.; Hart, B.K.; Dovichi, N.J. Analytical Chemistry 1985, 57, 2703-2705. 73. Skogerboe, K.J.; Yeung, E.S. Analytical Chemistry 1986, 58, 1014-1018.
74. Bornhop, D.J.; Dovichi, N.J. Analytical Chemistry 1987, 59, 1632-1636. 75. Nolan, T.G.; Dovichi, N.J. Analytical Chemistry 1987, 59, 2803-2805. 76. Yu, M.; Dovichi, N.J. Analytical Chemistry 1989, 61, 37-40.
77. Waldron, K.C.; Dovichi, N.J. Analytical Chemistry 1992, 64, 1396-1399. 78. Krattiger, B.; Bruno, A.E.; Widmer, H.M.; Rene, D. Analytical Chemistry 1995,
67, 124-130.
79. Odake, T.; Kitamori, T.; Sawada, T. Analytical Chemistry 1995, 67, 145-148. 80. Ragozina, N.; Heissler, S.; Faubel, W.; Pyell, U. Analytical Chemistry 2002, 74,
4480-4487.
81. Nedosekin, D.A.; Bendrysheva, S.N.; Faubel, W.; Proskurnin, M.A.; Pyell, U. Talanta 2007, 71, 1788-1794.
82. Nolan, T.G.; Weimer, W.A.; Dovichi, N.J. Analytical Chemistry 1984, 56, 1704-1707.
Chapter 2:Further Development and Optimization of a Contactless Conductivity
Detector
2.1Introduction
Highly sensitive detection for small volume separation techniques continues to remain a challenge, as separation platforms and methods continue to move towards smaller and smaller dimensions. For capillary electrophoresis techniques, development of a universal detector has been limited, as other, more selective techniques, such as laser induced fluorescence (LIF) and amperometry, have proven to be much more sensitive methods of detection, albeit at the expense of applicability to a wide range of analytes in any single separation or assay.
mobility to prevent additional peaks, such as system peaks, as well as peak broadening.1 In addition, with any indirect detection method, measurement of a small incremental change in signal on a high background usually limits the sensitivity and limit of detection.
As stated previously, the contactless conductivity detector, in its present format, was developed in 1998 by work performed in the do Lago2 and Zemann3 research groups. Previous work in the Jorgenson research group on a contactless conductivity system has been performed, which led to the incorporation of a lock-in amplifier, giving more sensitive detection. The detection electronics (i.e., electronic circuitry) were also changed, improving the reproducibility of the detection. In addition, a thorough investigation of noise sources revealed increased noise measurements from those calculated, caused by small amplitude fluctuations in the function generator.4
The present work expands on the work done previously in the Jorgenson research group. Experimental investigation on the effect of excitation frequency, electrode length, and capillary inner diameter has been performed. Additionally, continued investigation of noise has been carried out, with an emphasis on buffer systems, including buffer
concentration and type, as well as detector position.
2.2Basic Background and Principles
2.2.1Capacitively Coupled Contactless Conductivity Detection (C4D)
current passed from the excitation to the detection electrode. Although this idea is simple in theory, measurement of the solution resistance is a difficult task to accomplish, as there are various other contributions to the overall impedance within the overall system.
Conventionally, in contactless conductivity detection, the electrodes are metal cylinders placed on the outside of the separation capillary. An AC voltage is applied to one electrode, termed the excitation electrode. The excitation signal capacitively couples from the excitation electrode through the capillary wall and into the solution, giving a capacitive contribution from the fused silica wall. After coupling resistively down the channel through the solution, the signal then capacitively couples back out of the capillary to the second electrode, termed the detection electrode, giving an additional capacitive contribution to the overall measured impedance. Thus, the impedance can be thought of, in simplistic terms, as a series circuit comprised of two capacitors and a resistor, as shown in Figure 2-1A. Calculation of the capacitive reactance (XC) in
equation 2-1, gives a mathematical expression for the overall impedance in the detection cell (Z), as shown in equation 2-2.
fC XC π 2 1 = (2-1) fC j R Z S π 1 + = (2-2) Here, ƒ is the excitation frequency in Hz, C is the capacitance in Farads (coulombs/volt), j is the imaginary unit (-√(1)), and RS is the solution resistance.5 Equation 2-2, however,
simplistic mathematical model to give a more definitive description of the impedance, as shown in equation 2-3.
f C C C C jR f C jR C C f j Z L W L W S L S L W π π
π 1 2
2 1 ) ( 2 1 + + + + = (2-3) In this case, CW is the capacitance from the channel wall and CL is the leakage
capacitance between the two electrodes.6 This work was then expanded further by work completed in the Jorgenson research group, wherein a model composed of a network of resistors and capacitors, each 25 µm long, giving a total of 1044 elements, was used to more accurately predict the experimental behavior7; however, the basic principle of capacitive coupling remains the same.
2.2.2Buffer Systems Used in C4D
As with any detection method, sensitivity to low abundance analytes is extremely important. The combination of contactless conductivity detection and capillary
electrophoresis has its own unique challenges pertaining to finding a suitable background electrolyte that functions well when used with conductivity detection, but which does not diminish the advantages to separations that capillary electrophoresis possesses.
usefulness of amphoteric buffers for overcoming these issues has been presented in literature.8 Thus, it has been shown that for electrophoresis based separations, amphoteric buffers offer the advantage of low background conductivity, while allowing higher ionic strengths to be used. Based on the principles of capillary electrophoresis, high ionic strength BGEs have the added advantage of electrostacking effects, which serves to further enhance separations. This presents a challenge for conductivity detection,
however, where larger differences in ionic concentration serve to increase the sensitivity of the detection technique. A more thorough discussion of the effects of buffer systems in conductivity detection and capillary electrophoresis will follow in the next chapter of this dissertation (Chapter 3); however, investigation of the effect of buffer components as applied to the separation of inorganic ions detected with conductivity detection are discussed in this chapter.
2.3Experimental
2.3.1Materials and Buffers
All materials were used as shipped without further modification.
Potassium chloride (KCl) was obtained from Mallinckrodt (Paris, NY). All solutions were prepared using deionized water filtered through a Barnstead Nanopure Filtration System (Boston, MA). Only buffer solutions involved in pH studies were adjusted using either sodium hydroxide or hydrochloric acid; otherwise buffer solutions were at their native pH. Borate solutions were prepared from borax. Normal capillary electrophoresis buffer solutions were 20 mM MES/20 mM Histidine at pH 6.1. All other buffer solutions were prepared at a concentration giving a similar background conductivity value as the normal solution, which was determined experimentally. All solutions were filtered using a 0.2 µm nylon membrane filter from Grace Davidson (Deerfield, IL) and vacuum degassed using a Cole Parmer 8891 Ultrasonic Bath (Vernon Hills, IL).
2.3.2Capillary Electrophoresis System
Capillary electrophoresis was performed using an untreated fused silica capillary (Polymicro Technologies, Phoenix, AZ) 68 cm in length. The outer diameter (o.d.) of all capillaries used was 360 µm. The inner diameter (i.d.) for all studies, with the exception of the capillary inner diameter study, was 50 µm. Electrophoresis was driven by a reversible 30 kV power supply (Spellman High Voltage Electronics, Inc., Plainview, NY). The power supply current was limited using an in-house built current delimiting circuit with a resistance value of 111 MΩ. The electrophoresis current was monitored by measuring the voltage drop across a 220 kΩ resistor at the outlet end of the