THE ASSOCIATION OF HABITUAL MILK INTAKE WITH THE RATE OF COGNITIVE DECLINE, AND RISK OF MILD COGNITIVE IMPAIRMENT AND DEMENTIA.
Natalia Petruski-Ivleva
A dissertation submitted to the faculty at the University of North Carolina at Chapel Hill in partial fulfillment of the requirements for the degree of Doctor of Philosophy in the Department
of Epidemiology in the Gillings School of Global Public Health.
Chapel Hill 2017
Approved by: David Couper Misa Graff Gerardo Heiss Katie Meyer
Ó2017
ABSTRACT
Natalia Petruski-Ivleva: The Association of Habitual Milk Intake with the Rate of Cognitive Decline, Mild Cognitive Impairment and Dementia.
(Under the direction of Anna Kucharska-Newton)
Greater than average rates of cognitive decline in the elderly are likely to result in earlier onset of mild cognitive impairment and dementia. D-galactose, a derivative of lactose, is used in animal studies to mimic naturally occurring aging and neurodegeneration through increased oxidative stress. Milk is the primary source of lactose in the diet and its effects on oxidative stress levels or the rate of cognitive decline have not been fully evaluated. Thus, the objective of this work was to study the association of milk intake with cognitive change over a 20-year period. We further examined the association of milk intake with oxidative stress, defined as levels of mitochondrial DNA copy number. Analyses accounted for participants’ genetic predisposition to lactose intolerance, or lactase non-persistence, which determines the metabolic pathways through which lactose is metabolized. We used data from a large biracial cohort of men and women, who completed dietary assessment at midlife and had multiple assessments of cognitive function in three cognitive domains: processing speed, executive function, and
language.
observed among Black participants, but not among Whites. Milk intake was inversely
proportional to mitochondrial DNA copy number, suggesting higher levels of oxidative stress among milk drinkers. Due to the small number of participants classified as lactase non-persistent we were not able to capture difference in the effect of milk on cognitive change or oxidative stress by lactase persistence genotype.
ACKNOWLEDGEMENTS
I would like to thank my committee members (David Couper, Misa Graff, Katie Meyer, and Anna Kucharska-Newton) and Chair (Gerardo Heiss) for their support and for guiding me through my doctoral research. Additionally, I would like to thank my academic advisors Anna Kucharska-Newton, Gerardo Heiss and Wayne Rosamond who were there for me at every step of the academic program. I am grateful for the funding that was provided for me through the T32 Institutional Training Grant and research assistantships in the department.
TABLE OF CONTENTS
LIST OF TABLES ... x
LIST OF FIGURES ... xii
LIST OF ABBREVIATIONS ... xiii
CHAPTER I: INTRODUCTION ... 1
CHAPTER II: SPECIFIC AIMS ... 3
Rationale ... 3
Aim 1 ... 4
Aim 2 ... 4
Aim 3 ... 4
Public health implications ... 5
Conceptual framework ... 5
CHAPTER III: BACKGROUND AND SIGNIFICANCE ... 6
Epidemiology of cognitive decline, MCI and dementia ... 6
1. Cognitive decline ... 6
2. Definition, prevalence, and incidence of MCI ... 7
3. Definition, prevalence, and incidence of dementia ... 9
4. Global burden of dementia and cognitive impairment ... 11
5. Risk factors for cognitive decline, MCI and dementia ... 11
Milk intake, milk metabolism, and its effect on health ... 14
1. Milk intake globally and in the US – recommendations and trends ... 14
3. The effect of milk intake on health – existing studies ... 16
4. Milk metabolism ... 16
Milk metabolism and oxidative stress ... 19
1. Oxidative stress – overview ... 19
2. Oxidative stress and mitochondrial damage ... 21
3. Oxidative stress and neurodegenerative diseases ... 22
4. Milk and oxidative stress- mechanism ... 23
5. The role of inflammation in oxidative stress and cognitive decline ... 25
6. The role of antioxidants in oxidative stress ... 25
Existing studies of milk intake and cognitive function ... 26
Supporting figures ... 29
CHAPTER IV: METHODS ... 33
Overview ... 33
Study population ... 34
1. Description of the ARIC cohort ... 34
2. Inclusion criteria ... 34
3. Exclusion criteria ... 34
Exposure assessment ... 35
1. Assessment of milk intake ... 35
2. Preliminary data ... 36
3. Selection of categories of milk intake for the analysis ... 36
4. Performance of the FFQ in ARIC ... 36
Outcome assessment ... 37
1. Assessment of levels of oxidative stress among study participants ... 38
2. Assessment of genetic variant for lactase persistence in ARIC ... 40
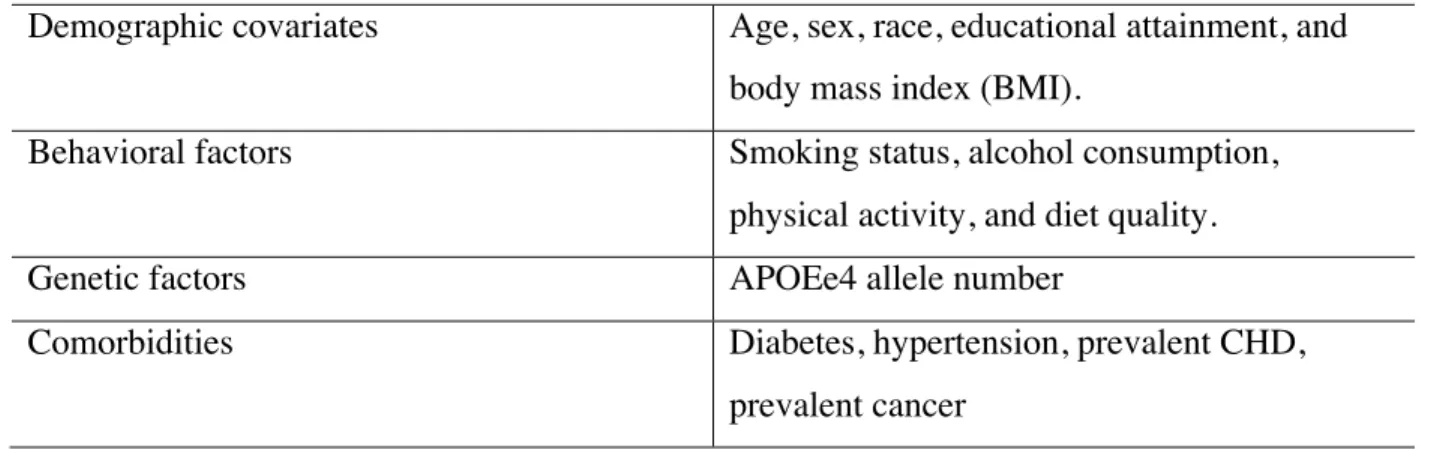
3. Assessment of other covariates ... 41
Statistical approach ... 44
1. Specific Aim 1 ... 44
2. Specific Aim 2 ... 47
3. Specific Aim 3 ... 49
4. Sensitivity analyses ... 50
Supporting tables and figures ... 51
CHAPTER V: RESULTS ... 59
Manuscript 1: Milk intake at midlife and cognitive decline over 20 years. The Atherosclerosis Risk in Communities (ARIC) study. ... 59
1. Overview ... 59
2. Background ... 60
3. Methods ... 62
4. Results ... 68
5. Discussion ... 70
6. Conclusions ... 72
7. Main tables and figures ... 73
Manuscript 2: Association of milk intake at midlife with mitochondrial DNA copy number. The Atherosclerosis Risk on Communities (ARIC) study. ... 78
1. Overview ... 78
2. Introduction ... 79
3. Methods ... 80
5. Discussion ... 86
6. Conclusion ... 89
7. Main tables and figures ... 90
CHAPTER VI: CONCLUSIONS ... 98
Recapitulation of Aims ... 98
Main Findings ... 99
1. Strengths ... 101
2. Limitations ... 102
Overall Conclusions ... 103
APPENDIX A: FREQUENCIES OF THE EUROPEAN VARIANT LCT -13910 C>T IN DIFFERENT COUNTRIES. ... 104
APPENDIX B: FREQUENCIES OF OTHER LACTASE PERSISTENCE ALLELES IN THE MCM6 GENE. ... 105
APPENDIX C: ENERGY ADJUSTED DIET COMPOSITION OF STUDY PARTICIPANTS BY MILK INTAKE GROUP, MEAN(SD). ARIC STUDY. ... 106
APPENDIX D: CHANGE IN GLOBAL Z SCORE BY FOLLOW-UP TIME PERIOD. ARIC STUDY. ... 107
APPENDIX E: MEAN INTAKE OF MILK AND OTHER DAIRY PRODUCTS BY MILK INTAKE GROUP. ARIC STUDY. ... 108
APPENDIX F: DISTRIBUTION OF MILK INTAKE GROUPS AND OTHER DAIRY INTAKE BY TOTAL DAIRY INTAKE QUARTILES. ARIC STUDY. ... 109
APPENDIX G: ESTIMATED, ADJUSTED DIFFERENCE IN THE 20-YEAR COGNITIVE CHANGE BY TYPE OF DAIRY INTAKE. ARIC STUDY. ... 110
APPENDIX H: ENERGY ADJUSTED DIETARY INTAKE OF STUDY PARTICIPANTS BY MILK INTAKE QUARTILE, MEAN (SE). ... 111
APPENDIX I: DIFFERENCE IN MTDNA-CN BY COVARIATES INCLUDED IN THE MODEL. ... 112
LIST OF TABLES
Table 1: MCI subtypes by etiology, pathology, presentation, and outcomes17. ... 29 Table 2: Visit 1 milk consumption by race in the ARIC cohort
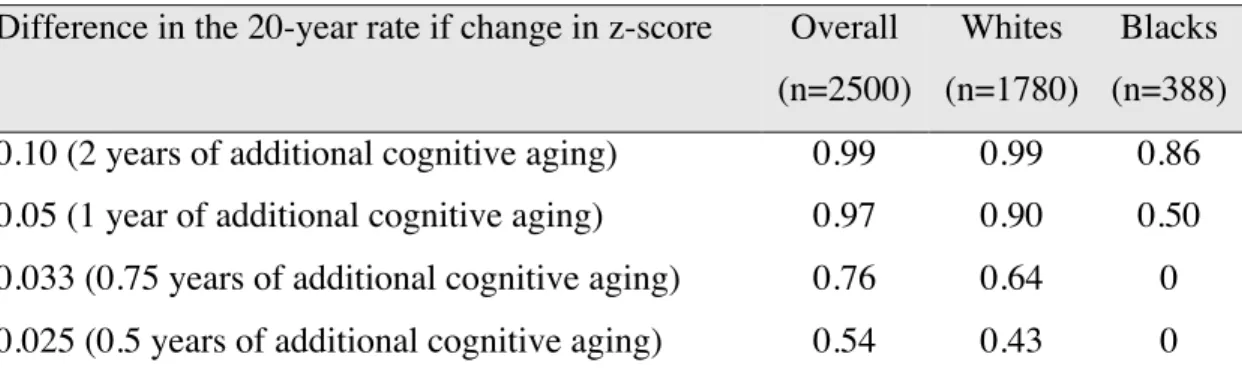
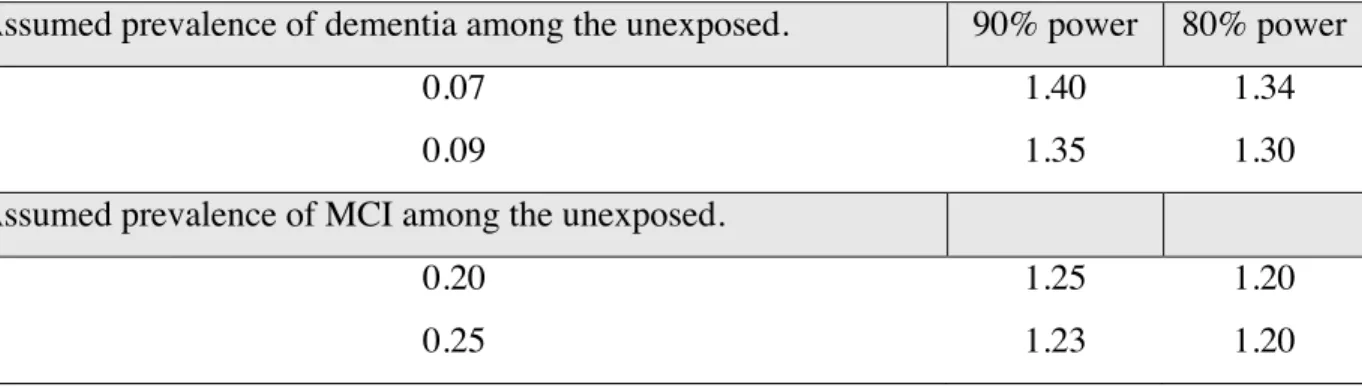
(preliminary analysis). ... 51 Table 3: Summary of the covariates used in the analysis. ... 52 Table 4: Power estimates for the study of the association between milk intake and cognitive decline. ... 53 Table 5: Estimates of the minimum detectable odds ratio for the association of milk intake and the risk of MCI and dementia. ... 54 Table 6: Baseline (Visit 2) characteristics of study participants by milk intake group. ARIC Study, 1990-1992. ... 73 Table 7: Estimated, adjusted* race-specific difference in the 20-year change in cognitive performance by milk intake category. ARIC Study. ... 74 Table 8: Baseline (visit 2) characteristics of the ARIC study participants by milk intake quartile. ... 90 Table 9: Average milk intake (glasses/day) by race-specific quartile of milk intake. ... 91 Table 10: Mean mtDNA-CN* (95%CI) by race-specific quartiles of milk intake. ... 92 Table 11: Difference in mean mtDNA-CN by stratum-specific milk intake quartile. ... 93 Table 12: Relative risk ratio for being in the 1st
LIST OF FIGURES
Figure 1: Conceptual framework of the hypothesize association of milk intake with cognitive decline (Aim 1 and Aim 2) through the mechanism of oxidative stress (Aim 3), and potential effect modification by lactase persistence genotype . ... 5 Figure 2: Trends in milk intake from 1970 through 2010 in the US69. ... 30 Figure 3: Effects of milk on health by lactase persistence genotype. ... 31 Figure 4: Balance between mediators of oxidative stress/inflammation and
LIST OF ABBREVIATIONS
Ab Beta-amyloid
AD Alzheimer’s disease-related dementia AGEs Advanced glycation end products
ApoE Apolipoprotein E
APOEe4 Apolipoprotein E e4 allele
ARIC Atherosclerosis Risk in Communities Study BLAST Basic Local Alignment Search Tool
BMI Body Mass Index
CAT Catalase
CDR Clinical dementia rating CHD Coronary heart disease CVD Cardiovascular disease DAG Direct acyclic graph
DASH diet Dietary approach to stop hypertension diet DLB Dementia with Lewy bodies
DNA Deoxyribonucleic acid DSST Digit symbol substitution test DWRT Delayed word recall test
ER Endoplasmic reticulum
ETC Electron transport chain
GEE Generalized estimating equations
GSH Glutathione
IL-1 Interleukin-1
IL-6 Interleukin-6
LNP Lactase non-persistence
LP Lactase persistence
LRR Log R ratio
MAR Missing at random
MCI Mild cognitive impairment MET Metabolic Equivalent of Task
MICE Multiple imputations by chained equations MMSE Mini-mental state examination
MtDNA Mitochondrial DNA
MtDNA-CN Mitochondrial DNA copy number NFT Neurofibrillary tangles
OR Odds ratio
PC Principal component
PD-D Parkinson’s disease with dementia
RAGEs Receptor for advanced glycation end products RCT Randomized controlled trials
RNA Ribonucleic acid
ROS Reactive oxygen species
SE Standard error
SNP Single nucleotide polymorphisms SOD1 Superoxide dismutase 1
SOD2 Superoxide dismutase 2
TICS-m Telephone Interview for Cognitive Status
TNF-a TUMOR NECROSIS FACTOR ALPHA
USDA United States Department of Agriculture
VaD Vascular dementia
CHAPTER I: INTRODUCTION
Cognitive decline has become a major public health concern. The onset of cognitive decline begins in the early 30s and the rate of decline varies among individuals. Faster rate of cognitive decline can lead to an earlier onset of mild cognitive impairment (MCI) and dementia. Early studies on cognitive impairment suggested that socio-economic factors are the main contributors to the risk of dementia, however more recent longitudinal studies have shown that those factors account for differences in cognitive reserve, but do not explain variability in the rate of decline. The focus of research has shifted to modifiable risk factors and younger populations in order to identify behaviors that could prevent progression to cognitive impairment. Animal studies suggest that oxidative stress plays an important role in
neurodegeneration. The brain is particularly vulnerable to oxidative damage due to its high metabolic activity and low antioxidant defense. D-galactose, a metabolic derivative of lactose, has been used for many years to mimic cognitive aging through oxidative stress in animal models. D-galactose reacts readily with free amines of amino acids in proteins and peptides to form advanced glycation end products that accumulate in the organs by binding with cell surface receptors or cross-linking with body proteins, altering their structure and function, resulting in generation of reactive oxygen species (ROS), increased oxidative stress and inflammation. Based on recent studies 100mg/kg of D-galactose, administered subcutaneously for 7 weeks, is
the diet, plays an important role in the growth and development of children, however its health effects in adults have not been extensively studies. Studies looking at the association of milk intake with cognitive performance are few. Most existing studies explore the association of total dairy intake without accounting for lactose content of dairy products, or lactase persistence (LP) and non-persistence (LNP) among individuals, who digest lactose through different metabolic pathways. The proposed study will measure the association of habitual milk intake with the rate of cognitive decline, risk of MCI and dementia accounting for LP/LNP status in the
CHAPTER II: SPECIFIC AIMS
Rationale
To enhance our understanding of the effect of lactose in the diet on the rate of cognitive decline, and risk of MCI and dementia, two interrelated manuscripts were developed following the conceptual framework presented in Figure 1. Aims 1 and 2 were developed to study the association of milk intake and cognitive function, while Aim 3 was developed to assess the proposed mechanism through which lactose in milk may affect health and cognitive function.
An evaluation of the performance of the food frequency questionnaire (FFQ) in assessing habitual milk intake of participants was done as part of Aim 1, which informed the classification of exposure for all three aims. Aim 1 was also used to describe habitual milk intake in the study population, including differences in intake in sub-populations such as by race and by lactase persistence genotype.
Aim 1 analyses also included an evaluation of two methods to address attrition in the cohort and compared results before and after such adjustments. Aims 1 and Aim 2 were developed to be combined into one manuscript.
Aim 1
To examine the association of habitual milk intake with the rate of cognitive decline
over a period of 20 years. The association was to be assessed in race-stratified analysis, and analysis stratified by lactase persistence.
Hypothesis 1: Milk intake is associated with faster rate of cognitive decline. A faster rate of decline is expected among individuals of LP genotype, who break down lactose though lactase in the small intestine – a process that generates D-galactose and leads to additional formation of ROS.
Sub-aims of Aim 1 were to 1.1) describe the distribution of LP/LNP genotype by race and to 1.2) describe milk intake by lactase persistence genotype.
Hypothesis 1.1: A higher proportion of LNP individuals is expected among Blacks. Hypothesis 1.2: Lower milk intake is expected for carriers of the LNP genotype.
Aim 2
To examine the association between habitual milk intake assessed at midlife with the
risk of MCI and dementia, in the overall population and stratified by race and by LP/LNP
genotype.
Hypothesis 2: Milk intake is associated with higher risk of MCI and dementia.
Aim 3
To examine the association of milk intake with levels of oxidative stress assessed by
mitochondrial DNA copy number.
Hypothesis 3: Greater milk intake is associated with lower count of mtDNA-CN,
Public health implications
Milk intake throughout life may impact the rate of cognitive decline via oxidative stress and associated cellular damage, but studies so far had been inconclusive and limited by
inconsistent study designs, lack of high quality longitudinal data on cognitive function, or appropriate assessments of dietary intake. Given that a large proportion of adults in the U.S. consumes milk daily, understanding of the potential impact of milk intake on the rate of cognitive decline may be an important step towards reducing the burden associated with
impaired cognition. In addition, exploring the association of milk intake with mtDNA-CN would help gain a better understanding of ways in which diet can have an impact on health.
Conceptual framework
CHAPTER III: BACKGROUND AND SIGNIFICANCE
Epidemiology of cognitive decline, MCI and dementia
1. Cognitive decline
The term cognitive decline refers to decline in mental processes, such as attention, short-term and long-short-term memory, reasoning, coordinating of movement and planning of tasks, which are crucial for the conduct of daily living activities1
. Evidence from the neurobiological and cognitive performance studies suggest that age-related cognitive decline begins early in life - in the 20s or early 30s2
. The rate of cognitive decline varies among individuals3-6
. It has been suggested that faster rate of cognitive decline in older adults is associated with lower levels of well-being, including self-acceptance, autonomy, purpose in life, personal growth, positive relations with others, and environmental mastery7, 8
. Furthermore, a faster rate of cognitive decline can lead to earlier onset of cognitive impairment and dementia, resulting in significant burden for individuals experiencing the decline, as well as their caregivers. In an attempt to delay the onset of cognitive impairment and dementia, research efforts have focused on modifiable risk factors that could be associated with the rate of cognitive decline.
cognitive reserve 9-11
which may then explain the differences in the risk of MCI and dementia. Individuals with higher cognitive reserve, compared to those with lower cognitive reserve, take longer to decline enough cognitively to meet the threshold at which point dementia would be diagnosed, even if decline occurs at the same rate10
. Cognitive reserve is a reflection of intellectual capacity, as well as education, occupation, and participation in intellectually stimulating activities12
. Extant studies also suggest that pathological indices of the common causes of dementia, such as metabolic impairments and Lewy body disease, don’t explain the majority of the variation in cognitive decline. Other important determinants of cognitive decline may thus remain to be identified13
.
2. Definition, prevalence, and incidence of MCI
MCI is a clinical syndrome defined as cognitive decline greater than expected for an individual’s age and education level that does not interfere notably with activities of daily life14
. Criteria for clinical diagnosis of MCI include evidence of concern about a change in cognition (in comparison to previous level), impairment in one or more cognitive function domains expressed as performance lower than expected for age and educational level, mild problems performing functional tasks while preserving the ability to function independently in daily life with minimal assistance, or a score 1 to 1.5 standard deviations below the mean for age and educational level in one or more domains on cognitive test15, 16
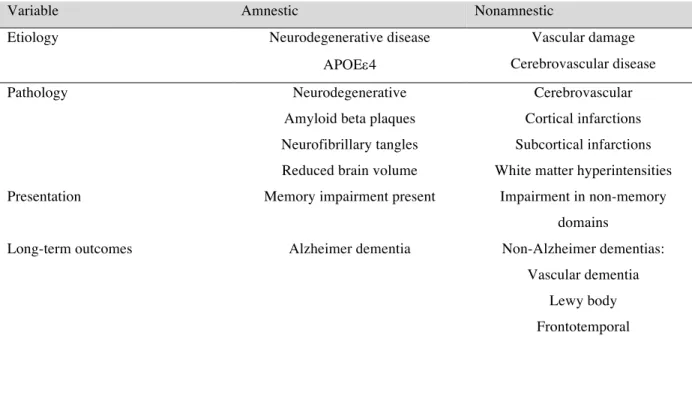
. MCI may consist of impairment in a single or multiple cognitive domains. The number of affected domains indicates disease severity and likelihood of progression to dementia. Given that cognitive and functional severity within the MCI is highly variable and includes different traits and etiologies the diagnosis of MCI is heterogeneous, which explains the variability in estimates of prevalence rates, incidence rates, and rated of progression to dementia17
The types of MCI are characterized by the presence or absence of memory impairment, i.e., amnestic and non-amnestic MCI respectively17
. Further classification of MCI is related to the underlying etiology, pathology, clinical presentation, and outcomes. The etiology of MCI can include neurodegenerative disease, Apolipoprotein E (ApoE) variant, vascular damage, or cerebrovascular disease (CVD). The pathology underlying MCI includes neurodegenerative, amyloid beta (Ab)plaques, neurofibrillary tangles (NFT), hippocampal atrophy, reduced brain
volume, cortical and subcortical infarctions, as well as white matter hyperintensities (Table 1) 17 . Estimates of the prevalence of MCI in population-based studies range from 3% to 29% globally, due to different criteria for MCI diagnosis. Although most MCI classification criteria included memory impairment and absence of impaired intellectual functioning, differences in diagnosis criteria were observed in acceptable levels of impairment in activities of daily living and degree of impairment in a domain other than memory18, 19
. In population-based studies, which have used more recent criteria for diagnosis, the prevalence of MCI has been estimated from 16% to 24%17
. The few existing studies on incidence of MCI report rates from 5.1 to 168 cases per 1000 person years17, 20
.
An important feature of MCI outcome is an increased risk of progression to dementia, with rates of progression among study populations ranging from 20% to 40% over the follow-up period, which translated into 10-15% conversion rate per year17, 21
3. Definition, prevalence, and incidence of dementia
Dementia is characterized by deterioration in multiple cognitive domains, which unlike MCI, is severe enough to interfere with daily functioning22
. Alzheimer’s disease (AD) is the most frequent cause of dementia, which progresses from deterioration in episodic memory to other domains of cognition. Other less frequent forms of dementia include vascular dementia (VaD), mixed dementia, dementia with Lewy bodies (DLB) and Parkinson’s disease with dementia (PD-D)23, 24
. The diagnosis of dementia applies given when there are cognitive and behavioral symptoms that interfere with the ability to function at work or at usual activities and there is an observed decline from previous levels of functioning that are not explained by delirium or other psychiatric disorder25
. Dementia is diagnosed through a combination of patient’s history (self-reported or through an informant) and an objective cognitive assessment through mental status examination or neuropsychological testing25
. The cognitive or behavioral impairment involves a minimum of two of the following domains: impaired ability to acquire and remember new information; impaired reasoning and handling of complex tasks; impaired visuospatial abilities; impaired language functions (speaking, reading or writing); changes in personality, behavior, or comportment25
.
Alzheimer’s disease-related dementia (AD) is a clinical diagnosis based on the presence of the cognitive syndrome that is not of abrupt onset and includes memory impairment in the absence of other diagnosis sufficient to cause cognitive impairment. The criteria for Alzheimer’s disease dementia includes presence of one or more of the flowing disturbances in addition to memory impairment: language, learned motor skills, visuospatial/sensory, executive function, impairment in social or occupational functioning16, 25
Cardiovascular disease-related dementia, or Vascular dementia (VaD), is defined by an algorithm that uses the following information: history of stroke, history of bilateral or multiple infarcts, extent of white matter hyperintensities on imaging, physical examination evidence of a typical stroke pattern of neurologic signs, onset of dementia 3 months after a recognized stroke and abrupt deterioration in cognitive functions26
.
Lewy body disease-related dementia (DLB) diagnosis is based on the published criteria when there are at least two of the following: spontaneous features of parkinsonism, history of fluctuations in alertness or cognition, dream enactment behavior (REM sleep behavior disorder) reported by an informant, or hallucinations27
.
Parkinson disease dementia (PD-D) is diagnosed when dementia occurs in the context of well-established Parkinson disease27
.
The prevalence of all dementias in the US in people 60 years of age or older is estimated at 6.8%28
. The age-specific prevalence of dementia doubles for every five years of age, from 1.5% in persons aged 60-69 years to 40% in those over 90 years of age29
. It is estimated that the number of people with dementia will double every 20 years30. Annual incidence of dementia is estimated from 1 per 1000 among ages 60-64 years to 86 per 1000 among those 95 years of age and older31
.
Due to population aging, dementia has become one of the major challenges to public health and to the elderly care system. It is a principal cause of disability, institutionalization and shorter survival in older people. In 2015, the number of people living with dementia globally was estimated at 47.5 million and is projected to reach 75.6 million in 2030 and 135.5 million in 205032
disability increases exponentially with age, recognition of the importance of midlife vascular risk factors and midlife cognition for late life cognitive impairment has shifted the focus of research towards younger persons and the early stages of cognitive decline and mild cognitive impairment with an attempt to delay the progression to full dementia33
.
4. Global burden of dementia and cognitive impairment
Globally, dementia and cognitive impairment are the leading chronic disease contributors to disability and dependence among older people32
. The onset of cognitive impairment quickly compromises the ability to carry out essential daily life activities and results in loss of
independence, placing demands on healthcare and social services. The need for support from the caregiver starts early in the dementia course, and intensifies as the illness progresses over time. Such demand placed on caregivers in its turn results in practical, psychological and economic strains leading to anxiety, depression, loss of income from employment32
. The total estimated worldwide costs of dementia in 2010 were $604 billion, which is equivalent to 1% of the world’s gross domestic product. About 70% of the global costs occurred in two regions: Western Europe and North America34. Those costs are driven mainly by social care needs, while direct health care costs account for a small proportion of the total, given the low diagnosis rate and limited
therapeutic options. The World Alzheimer Report 2010 estimated an 85% increase in costs to 2030.
5. Risk factors for cognitive decline, MCI and dementia
Risk factors for cognitive decline, MCI and dementia include non-modifiable risk factors such as age, sex35, 36, genetic factors (Apolipoprotein e4 allele number)37-48
, and modifiable risk factors such as low number of years of education1, 10, 49
, vascular risk factors (diabetes, hypertension, obesity, dyslipidemia, smoking)50-54
disease, atrial fibrillation, congestive heart failure, cerebrovascular disease)55, 56
, neuropsychiatric conditions (depression and anxiety)57-61
, and biomarkers (inflammation)52, 54, 62-65 .
APOEe4, an allele of the cholesterol transfer Apolipoprotein E, is an extensively studied non-modifiable risk factor for dementia. Carriers of the APOEe4 allele have an increased risk of
Alzheimer’s disease, as well as an earlier age at onset compared to non-carriers37-39
. Longitudinal studies show that APOEe4 carriers also exhibit greater cognitive decline with aging40, 41, 66
. Looking at gene-environment interactions, excess risk has been reported in APOEe4 carriers
with hypertension, diabetes, and atherosclerosis, as well as an interaction with body mass index (BMI) and sex36, 40, 43-47
. A gene-behavior interaction was reported between depressive symptoms and APOEe448
.
Many modifiable risk factors and protective factors have been studied in relation to cognitive decline, MCI and dementia. A recent systematic review and meta-analysis by Beydoun et al. summarized evidence from 247 cohort and case-control studies published between January 1990 and October 20121
alcohol consumption, which is hypothesized to be beneficial in moderation, were also mixed with some cross-sectional and cohort studies finding a linear, J or U shaped association with cognitive outcomes, while others finding no association at all. Physical activity was hypothesized to have a beneficial effect on cognition by reducing the risk of related comorbidities (coronary heart disease, stroke, diabetes), sustaining cerebral blood flow, improving aerobic capacity and cerebral nutrient supply, as well as growth factors (e.g. brain-derived neurotrophic factor). After reviewing the literature, Beydoun et al. concluded that physical activity could represent an important and potent protective factor for cognitive decline and dementia. Some of the
nutritional factors that were reviewed included caffeine, antioxidants (vitamin E), homocysteine, and n-3 fatty acids, all showing mixed findings.
From the review of 247 studies it is clear that the mixed findings make it difficult to draw firm conclusions on risk and protective factors for cognitive outcomes. Existing studies vary in their definition of cognitive function, MCI and dementia, tests and scoring systems to assess cognitive performance, and quality of case ascertainment. The studies vary also in sample size, and some may be underpowered. Assessment of cognitive function was often done by the Mini-Mental State Examination (MMSE), which is known to have a “ceiling effect”, failing to capture differences in cognitive function among those with higher levels of cognitive performance10
European populations (England and Netherlands), making findings not easily generalizable to the population of US or other countries with more diverse populations1
.
Randomized controlled trials (RCTs) looking at the association of nutritional factors (folic acid, vitamins B6 and B12, fatty acids, antioxidants) and dietary patterns (Mediterranean diet, DASH diet, caloric restriction) with cognitive outcomes also show mixed results and fail to provide evidence for a beneficial effect of nutrient supplementation67
. Although RCTs are better able to provide unbiased results than observational studies, some of the limitations, such as short duration of the interventions, small sample size, adherence to treatment, and differences in cognitive performance assessment could explain mixed findings.
Milk intake, milk metabolism, and its effect on health
1. Milk intake globally and in the US – recommendations and trends
Dairy foods such as milk, cheese, and yogurt are consumed by billions of people around the world. According to the 2013 Food and Agriculture Organization (FAO) of the United Nations milk is a major source of dietary energy, protein and fat68
. Milk intake varies by geographical region, with less milk consumed in Asia and Africa and more in Europe and the Americas. According to the USDA data, despite overall high intake of milk, average
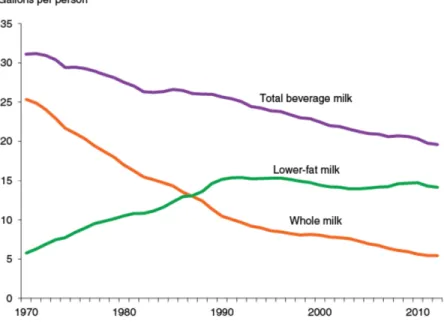
consumption in the US has decreased by 37%, from 1.5 cups per day in 1970 to 0.8 cups per day in 2010. The consumption of whole milk decreased by 78% over the last 40 years, partially being replaced with the low-fat milks (Figure 2)69
.
children ages 1-3, but not in adults70
. An age-related decline in dairy intake begins in childhood and is observed throughout adulthood, partially due to the decrease in lactose tolerance with age. In the US, milk accounts for 51% of all dairy intake70
.
2. Milk as part of diet
Milk intake can serve as a marker of diet quality because of its high nutrient content71 . Whole milk is high in fat, thus it plays an important role in the diets of infants and young children in populations with low fat intake72
. Milk lipids are carriers of fat soluble vitamins and milk protein contains all the essential amino acids needed by humans. The main carbohydrate in milk is lactose, which is involved in the intestinal absorption of calcium, magnesium and
phosphorus, and the utilization of vitamin D73
. Milk contributes to the required intake for calcium, magnesium, selenium, riboflavin, vitamin B12 and pantothenic acid 68
and plays an important role in child growth and development. Intervention and observational studies around the world indicate that preschoolers receiving dairy supplementation or consuming more dairy showed improved nutritional status as well as weight –for-height z-scores68
. Benefits of milk supplementation on growth have also been observed among school-aged children in countries with higher prevalence of malnutrition, and less so in countries where malnutrition is less common. Ecologic and observational studies have shown that countries and regions with higher milk consumption across and within countries correspond to better nutritional status and taller adults 74-76
3. The effect of milk intake on health – existing studies
Beyond the nutritional benefits that milk can provide for the growth and development of children, less is known about its effects on health in adults. It has been suggested that dietary patterns with higher dairy intake are associated with reduced risk of some components of metabolic syndrome and of type 2 diabetes 77-79
. Milk and dairy products are often linked to CVD risk due to high content of saturated fatty acids, however conflicting results have been found about the association of full-fat dairy and CVD risk, with some studies pointing at risk reduction80, 81
and others at increase in risk82
. Other nutrients found in milk, such as protein82 , lactose83, 84
, and calcium-to magnesium ratio84
, have also been implicated in increased CVD risk. Previous studies reported inverse association between dairy intake and hypertension85, 86
and stroke87
, ischemic heart disease81
, and total CVD88
. A recent review of 18 observational studies concluded that full-fat milk, cheese, and yogurt have a protective effect on risk of CVD89
. Studies of the association of dairy intake with the risk of cancers (colorectal, breast, prostate, bladder) have given inconclusive results and several hypotheses exist on how some nutrients in milk may increase and others decrease the risk for different cancers. Calcium, found in dairy, is hypothesized to have a protective effect with respect to colorectal cancer by inhibiting the proliferation of aberrant crypt foci in the colon90, 91
. On the other hand, some studies suggest that dairy is associated with increased risk of ovarian92
, prostate93, 94
, and testicular95
cancers. No consensus exists on the association of milk intake with the risk of breast cancer96-98
.
4. Milk metabolism
The main carbohydrate in milk is the disaccharide lactose, which is broken down through hydrolysis in the intestinal tract. Once broken down into monosaccharides galactose and glucose it can be used as a source of energy99
in the small intestine. Lactase activity is high in infancy, when milk is the main source of
nutrition, and often declines after weaning. Those individuals who maintain high lactase activity throughout adulthood are identified as lactase persistent (LP), while those who experience a decline in lactase activity are referred to as lactase non-persistent (LNP) individuals. The distribution of lactase phenotype in human populations is highly variable, with proportion of LNP individuals ranging from less than 10% to 90% of the population99
.
Lactase persistence and milk metabolism
Lactase persistence, or the ability to digest lactose into glucose and galactose in
adulthood, emerged 7,500-10,000 years ago among populations that domesticated milk animals and consumed milk99, 100
. Dominant mutations occurred in the lactase promoter region upstream form lactase phlorizin hydrolase on chromosome 2q21 retaining intestinal lactase into adulthood. Although genetic variation allows the modern populations to be categorized as lactase persistent and lactase non-persistent, a further type of adaptation is observed in lactase maldigesters, namely lactase non-persistent individuals who continue consuming dairy foods and exhibit improved lactose handling through altered microbiome and metabolome (colonic adaptation) 101. In turn, carriers of the LP genotype may lose the ability to digest lactose due epithelial damage that leads to decreased lactase activity102-104
. Secondary loss of lactase is a frequent result of viral infections and allergies99
.
Determining lactase persistence genotype in population studies
Lactase phenotypes can be determined directly by assaying lactase from a small intestine biopsy or indirectly by lactose-tolerance tests105
. Lactose tolerance tests consist of measuring blood glucose concentrations within 15 to 45 minutes of lactose consumption (50mg), or by measuring urinary galactose after inclusion of ethanol with the lactose load106, 107
non-persistent people, undigested lactose can be determined by measuring breath hydrogen which is excreted when undigested lactose reaches the colon and gets fermented108
. Direct measures through biopsy are more reliable, but not practical in population studies.
Population distribution of the lactase persistent genotype
The frequency of lactase persistence varies dramatically in different populations105
. LP is most prevalent in Europe (with the highest frequency in Swedes and Danes, declining as one moves south and west) and in milk-dependent nomads of the Afro-Arabian desert zone. LP is considered low in the rest of the world, including Asiatic populations (Appendix A).109
The single nucleotide polymorphisms (SNPs) most frequently used to determine LP/LNP status are rs4988235 13910C>T) in the populations of European descent and rs145946881 (LCT-14010G>C) in populations of African descent. However studies in African countries suggest that there are other SNPs also associated with lactose digestions, such as rs182549
(LCT-22018G>A), rs41380347 (LCT-13915T>G), rs41525747 (LCT-13907C>G), LCT-13914G>A, LCT-14009T>G may show greater prevalence109
(Appendix B).
Different pathways of milk metabolism and their effect on health
Research studies on the health effects of dairy foods have shown inconclusive results and one of the suggested explanations has been that the effect of dairy on health differs among LP/LNP individuals, introducing confounding to studies that ignore the phenotype110
. The LNP individuals who consume dairy products frequently and show no symptoms of lactose
in which the microbiome plays a role but also may accentuate risk if the mechanism involves other “toxic” effect of the byproducts of dairy digestion by bacteria110, 111
.
This bacterial toxin hypothesis is based on the fact that bacteria release a wide range of fermentation products, such as diols. For example, butane 2,3 diol is a fermentation product of glucose. The plasma concentration of butane 2,3 diol in healthy humans is 10-100mM. If lactose in a glass of milk is converted to butane 2,3 diol, the local concentration of this diol in the gastrointestinal tract would be 100-200mM111
. Other bacterial toxins include amino acid degradation products such as the phenol cresol, indoles and skatoles, or peptide and protein toxins99
. These bacterial toxins act on regulatory pathways that switch cells on or off in the nervous system, heart and muscles, and the immune system99, 112, 113
.
In the LP population, the effect of lactose breakdown by lactase leads to formation of D-galactose which is processed by liver and leads to elevated levels of oxidative stress, a process that is well established in animal models114-118
.
Figure 3 summarizes different pathways of milk metabolism by lactase persistence/non-persistence phenotype and resulting health effects from lactose consumption.
Milk metabolism and oxidative stress
1. Oxidative stress – overview
Free radicals are molecules with an unpaired electron in their outer orbit, which makes them more reactive than the corresponding non-radicals. Free radicals readily accept electrons from other molecules - a process called oxidation119
. Humans are continuously exposed to free radicals from environmental sources (e.g. smoking, pollution, radiation) and from cellular metabolism (e.g. respiration, enzyme reactions)120, 121. Free radicals play an important role in origin of life and biological evolution122
biochemical activities of cells such as signal transduction and gene transcription, and regulate important processes, such as relaxation and proliferation of vascular smooth muscle cells, leukocytes adhesion, platelets aggregation, angiogenesis, thrombosis, vascular tone and hemodynamics123
. The most common free radicals are hydroxyl radical (OH.
), superoxide radical (O2
-), and nitric oxide (NO. )124, 125
. Other molecules, such as hydrogen peroxide (H2O2) and peroxynitrate (ONOO), are not free radicals, but can lead to their generation through various chemical reactions. Free radicals and related molecules are often classified together as reactive oxygen species (ROS) due to their ability to promote oxidative changes within the cell125
. Mitochondria are the primary source of ROS in the majority of cells, as they are the cite of cellular respiration126
. The mitochondria are ancient bacterial symbionts with their own mitochondrial DNA, RNA, and protein synthesizing systems. The mitochondria burn calories that come from diet, using oxygen that is breathed in to make chemical energy to do work and maintain body temperature. As a byproduct of energy production, the mitochondria generate ROS (O2
-
and H2O2). ROS can pass freely through cell and nucleus membranes, and oxidize biomacromolecules such as lipids and proteins, as well as cause damage to RNA and DNA. As an example, ROS are involved in lipid peroxidation, which leads to cell membrane leakage 127
. The oxidation of amino-acids results in the formation of protein-protein cress-links, leading to dysfunction of these proteins. Oxidation of kinase and phosphatase dysregulates the signal pathways. ROS-induced DNA peroxidation interrupts gene transcription and causes gene mutations128
. These processes lead to damage of various cellular components and may result in cell death129
. Overproduction of ROS is linked to many chronic diseases, including
atherosclerosis, cancer, diabetes, rheumatoid arthritis, myocardial infarction, cardiovascular disease, chronic inflammation, stroke, aging and degenerative diseases130-134
To counteract the oxidative damage from free radicals, antioxidant defense systems co-evolved along with the aerobic metabolism. Free radicals and antioxidants exist in a dynamic state of equilibrium and disruption of this balance in favor of an increase in reactive oxygen species leads to what is labeled oxidative stress135, 136, 137
.
2. Oxidative stress and mitochondrial damage
Typical aging involves a gradual decline in cognitive function, but the onset and
progression of decline are variable among individuals. While this variability may be due to many biological changes, a large contribution may be attributed to differences in rates of age-related cellular deterioration138-140
. The brain is particularly susceptible to cellular damage through the pathway of oxidative stress due to its high metabolic activity141, 142
. The brain has high oxygen demands, which constitutes 20% of the body oxygen consumption, as well as high content of redox-active metals such as iron or copper in the central nervous system cells, which are actively involved in ROS formation143
. Brain cell membranes are high in levels of polyunsaturated fatty acids, making them susceptible to lipid peroxidation144
. ROS and oxidative stress have been shown to play a pivotal role in neurodegeneration, which may subsequently lead to cognitive impairment and dementia 137, 145-147
. Neuronal mitochondria provide energy and modulate calcium kinetics and metabolism for the high energy demand synaptic activity. Mitochondria in the neurons are at higher risk for damage due to the long lifespan of neurons and thus increased risk for toxin accumulation with aging. Increased ROS production/accumulation results in oxidative stress, disrupting neuronal homeostasis through lipid oxidation, protein modification, DNA mutations, formation of mitochondrial permeability transition pores, thus leading to low energy provision, dysregulated mitochondrial dynamics, disrupted mitochondrial calcium handling capacity, decreased neuronal plasticity and eventually neuronal death148
for lesion development through the process of oxidative stress due to the physical proximity to ROS generation sites. There are multiple presentations of mtDNA defects in neurodegenerative diseases, including point mutation, nucleic acid modification, large-scale deletions, and
decreased mtDNA copy number149-152
. Damaged mtDNA leads to mitochondrial respiration defects, excessive ROS generation, increase mitophagy and eventually apoptosis and cell death148
. The rate of mtDNA damage and decline is modulated by the level of mitochondrial oxidative stress. When the mitochondrial ROS production rate increases, the rate of cell loss increases, resulting in early tissue failure and age-related disease141
. In addition to mitochondrial dysfunction, accumulation of ROS results in nuclear DNA lesions, loss of proteostasis (excessive protein misfolding), and altered cellular communication, all of which have been described as culprits of aging and age-related pathologies 138-141, 153-168
.
3. Oxidative stress and neurodegenerative diseases
Multiple studies have shown that oxidative stress plays a role in the etiology of a variety of neurodegenerative diseases, including MCI, AD, and PD169-179
.
MCI subjects exhibit significant oxidative imbalance179, 180, enhanced protein peroxidation181, 182
, and decreased levels of antioxidants183, 184
. Extensive oxidative stress is also a characteristic of AD brains, which exhibit increased markers of protein oxidation and markers of oxidative damage to DNA and RNA145, 181, 185-187
, increased lipid peroxidation in multiple brain regions188-192
, and alterations in the activities or expression of antioxidant enzymes192-194 . Increased oxidative damage to lipids and proteins correlate with the severity of the disease in both MCI and AD195
.
identified in the hippocampal neurons of AD196-198
. Biopsies from AD brains also showed significant reduction of mitochondria, suggesting degradation by autophagy196, 197
. Apart from neuronal death AD is characterized by two pathologic hallmarks: senile plaques formed by extracellular deposits of Ab peptides and neurofibrillary tangles (NFTs) composed of
intracellular aggregations of hyperphosphorylated tau proteins199. Ab deposits and NFTs are manifestations of protein misfolding in the brain, a process in which ROS imbalance plays an important role200, 201-203
. In addition, misfolded proteins are retained in the endoplasmic reticulum (ER), leading to ER stress response, which, in the presence of oxidative stress, elicits apoptotsis. The role of the ER stress in mediation of neurodegenerative diseases has been well
documented204, 205
. ROS are also actively involved in tau phosphorylation. In an in vitro model of chronic mild oxidative stress ROS were found to phosphorylate tau and once phosphorylated, tau are vulnerable to modification by carbonyl products of oxidative stress and consequent
aggregation into fibrils206, 207, which contributes to formation of neurofibrillary tangles208. Oxidative stress and mitochondrial dysfunction also play an important role in the degeneration of dopaminergic neurons in PD, leading to characteristic motor symptoms209-211
. Evidence has been developed for oxidative and nitrative damage to key cellular components in the PD substantia nigra142, 212-214
. PD brains show increase levels of lipid peroxidation215, 216 , modification of soluble proteins217
, and DNA and RNA oxidation218, 219 .
4. Milk and oxidative stress- mechanism
glycation end products (AGEs). AGEs are not metabolized further and accumulate in the organs by binding with cell surface receptors or cross-linking with body proteins, altering their structure and function. AGEs affect intracellular processes via specific receptors, such as the receptor for AGE (RAGE), activating diverse signal transduction cascades and downstream pathways, including generation of ROS which results in increased oxidative stress108, 118, 220-223
.
The effect of D-galactose on physiological processes has been extensively studied in animal models. It has been shown that injection of D-galactose induces neurological
impairments, decreases neuromuscular activity, increases production of free radicals, decreases antioxidant enzyme activity, diminishes immune responses, and causes impairment of spatial learning and memory in rodents, which resembles naturally occurring aging115, 220,224-229
. Even at low doses, D-galactose results in a shorter life span caused by oxidative stress damage, chronic inflammation, neurodegeneration, decreased immune response, and gene transcriptional
changes115, 224
. Although the mechanism of D-galactose-induced aging and memory impairments has not been defined, existing data suggest that increased levels of ROS and oxidative damage in the brain might be the main reason 116, 220, 227.
Although lactose from milk is not the only dietary source of galactose, its concentration is greatest in milk. A serving of milk corresponds to approximately 6,250mg of galactose, while peas and beans have 120-740mg per serving, and fruits and vegetables 5-76mg per serving230
. It has been suggested that the amount of D-galactose generated by 1-2 glasses of milk could be sufficient to observe physiological changes in humans similar to those observed in animal models, such as signs of accelerated senescence, including cognitive changes 231
5. The role of inflammation in oxidative stress and cognitive decline
The two most common features of neurodegenerative disease are sustained oxidative stress and inflammation232
. Excessive generation of ROS in the brain causes neuronal damage and thus a release of cytosolic factors that activate microglia and astrocytes. These cells respond by releasing proinflammatory cytokines (IL-1, IL-6, TNF-a), which induce further accumulation
of ROS, leading to potentiation of the inflammatory response and subsequent exacerbation of neuronal damage. TNF-a is a key cytokine of the immune system that initiates and promotes
inflammation. The cyclical promotion of inflammation though ROS and promotion of ROS production by TNF-a can, when uncontrolled, result in chronic neurodegeneration232
.
6. The role of antioxidants in oxidative stress
In healthy state, mediators of oxidative stress/inflammation are in balance with the counteracting antioxidants and anti-inflammatory molecules233
(Figure 4 232 ).
During mitochondrial activity superoxide is produced in the electron transport chain (ETC). Superoxide can inactivate proteins containing iron-sulfur clusters in the mitochondrion, thus it is immediately converted to H2O2 by superoxide dismutase 2 (SOD2), located in the mitochondrial matrix, or SOD1 located in the cytosol234, 235
. H2H2 can act as an oxidant, and, in the presence of reduced metal ions such as ferrous iron, can be converted by the Fenton reaction into a highly reactive hydroxyl radical, the most harmful species of all ROS143, 209
. H2O2 is rapidly converted to water by mitochondrial glutathione (GSH) with the participation of GSH reductase and peroxiredoxins236
. The GSH redox cycle is also important in the reduction of oxidized lipid molecules and is considered a critical defense mechanism to protect membranes against oxidative stess236
. Other antioxidants include catalase (CAT), vitamins C and E which are effective in preventing lipid peroxidation237
interest as a potential treatment of chronic conditions related to oxidative stress, however reviews of recent clinical trials have failed to confirm the efficacy of antioxidant treatment of chronic and neurodegenerative conditions in humans237-239
.
Existing studies of milk intake and cognitive function
So far, few studies have examined the association of dairy intake with cognitive outcomes, and studies on milk as a separate group are even fewer.
Four cross-sectional studies examined the association of dairy intake with cognitive performance and dementia risk. A study from Korea of 449 participants ages 60-83 years, found that women with poor cognitive function had significantly lower dairy product intake, but no significant association was found in men240
. A study from Mexico of 1748 participants with a mean age of 64 years, found no association of dairy products consumption with cognitive impairment241
. A US study of 1056 participants ages 55-94 years, found that greater cheese intake was associated with reduced likelihood of cognitive impairment in a dose response manner, while no association was found for milk242
. Another US study of 972 participants ages 23-98 years, found that daily dairy food intake was associated with better performance, but no association was found for individual dairy products243
No prospective studies have examined the association of dairy intake with cognitive decline. All identified prospective studies measured cognitive function once, so that the rate of cognitive decline could not be assessed. Only one study assessed “recent cognitive change” that was reported by caregivers of study participants244
. A study from Australia of 601 males ages 75 years and older with a mean follow up of 4.8 years reported an association of full-fat milk with impaired cognitive function171
. Two studies from Finland of more than 1000 participants over 50 years of age followed for 21 years reported that fat intake from milk products was not
significantly associated with dementia risk245
, but that high saturated fat intake from milk products was associated with poor global cognitive function and increased risk of MCI246
. A study from Japan of 1774 participants ages 35-60 years at baseline followed for 27 years found that daily milk intake was associated with significantly lower risk for vascular dementia, but not for Alzheimer’s dementia247
. And finally, two studies from France of 4,809 and 3,076
participants over age 60 years at baseline followed for 13 years found that consumption of dairy desserts and ice-cream was associated with cognitive decline (reported by caregivers)244
, and milk consumption was associated negatively with verbal memory248. Overall, most prospective studies focused on fat from dairy products and overall dairy intake, and association with milk intake as a separate group were not reported. Half of the studies included older population at baseline, who may have already suffered cognitive decline prior to initial screening. Assessment of dairy intake varied across studies and dairy products included in “total dairy” also varied by study (e.g milk+sour milk+spreads vs milk+yogurt+cheese+desserts).
same oxidative properties. As a result, individual in a high total dairy intake group who consume more fermented products ingest less lactose compared to someone in the same intake group but consuming primarily milk. The few prospective studies that have examined milk intake
separately from other dairy products reported contradictory results, but were heterogeneous in their methodological approaches. Such studies had small sample sizes, some were restricted to one gender group, were conducted in predominantly in White or Asian populations, or included older populations at baseline. Other limitations included a single assessment of cognitive status, or a study outcome limited to clinical diagnoses of dementia, precluding the study of potential effects of milk intake on milder forms of cognitive impairment such as MCI. Further, most studies did not have information on APOEe4 status, a strong risk factor for cognitive
Supporting figures
Table 1: MCI subtypes by etiology, pathology, presentation, and outcomes17 .
Variable Amnestic Nonamnestic
Etiology Neurodegenerative disease Vascular damage
APOEe4 Cerebrovascular disease
Pathology Neurodegenerative Cerebrovascular
Amyloid beta plaques Cortical infarctions
Neurofibrillary tangles Subcortical infarctions
Reduced brain volume White matter hyperintensities
Presentation Memory impairment present Impairment in non-memory
domains
Long-term outcomes Alzheimer dementia Non-Alzheimer dementias:
Vascular dementia
Lewy body
.
Figure 4: Balance between mediators of oxidative stress/inflammation and antioxidants/anti-inflammatory mediators232
CHAPTER IV: METHODS
Overview
This study benefited from the long follow-up of the ARIC cohort from mid-life to older adulthood to examine the association of milk intake in mid-life with cognitive change and measures of cognitive performance through older adulthood. The availability of repeated measures of cognitive performance allowed for the assessment of change in cognitive function over a 20+ year period and quantification of the risk of MCI and dementia. Analyses also used the in-depth genotyping of the cohort to stratify analyses by LP/LNP status in order to identify potential differences in the effect of lactose on health that may arise from differences in lactose metabolism. Limitations arising from the use of a food frequency questionnaire (FFQ) to capture milk intake were addressed by repeat assessment of dietary patterns at two separate visits.
MtDNA-CN was used to assess the state of oxidative stress levels in the cohort participants, thus allowing an exploration of the proposed mechanism for the association between milk intake and cognitive decline. Imputation techniques were used – multiple imputations by chained equations (MICE) for continuous outcomes (cognitive decline) and Heckman model for categorical
Study population
1. Description of the ARIC cohort
The prospective ARIC cohort includes 15,792 adults who were selected through probability sampling from four US communities: Washington County, Maryland; Forsyth County, North Carolina; suburbs of Minneapolis, Minnesota; and Jackson, Mississippi.
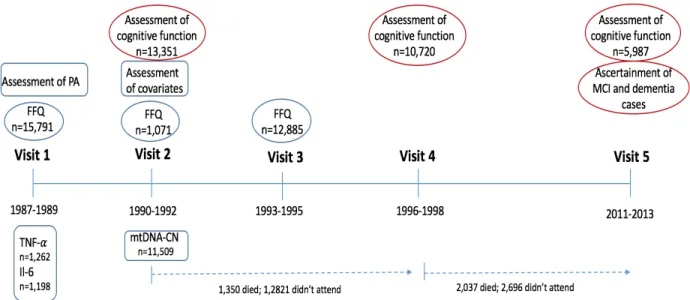
Participants were examined at five visits, with the first four visits approximately 3 years apart, and a fifth visit conducted 15 years following visit 4 (Figure 5). At baseline (1987-1989), participants were 45-64 years of age, 56% were female and 24% were Black. At the time of the study visits, participants received extensive examinations, including assessment of their medical conditions, physical function, and social position. Annual (semi-annual since 2011) follow-up of ARIC cohort participants via telephone is also conducted to maintain contact and assess health status of participants249
. The FFQ was administered at Visits 1 (1987-1989) and 3 (1993-1995) to the entire cohort, and to a subset of participants at Visit 2 (1990-1992). Assessment of
participants’ cognitive function was performed at Visits 2 (1990-1992), 4 (1996-1998), and 5 (2011-2013).
2. Inclusion criteria
For the analyses in Aims 1 and 2 we included participants who completed FFQ at least on one occasion (Visit 1) and those who completed cognitive assessments at Visit 2, 4 and 5. For Aim 3 analysis we included those with completed FFQ at least on one occasion (Visit 1) and those with data on mtDNA-CN.
3. Exclusion criteria
one or more cognitive function test at baseline, and those who did not complete the FFQ or had missing data on milk intake on the FFQ. Participants at the extremes of caloric intake (<600 kcal or >4200 kcal per day for men, <500 kcal or >3600 kcal per day for women) were also be
excluded.
Exposure assessment
1. Assessment of milk intake
Self-reported milk intake in the past year was assessed at visits 1, 2 and 3 by an interviewer-administered, 66-item FFQ 250
developed by Willet et al. The usual frequency of milk consumption was reported in 9 categories, from “never” or “less than once a month” to “>6 times per day”. The amount of milk intake was assessed as skim/low-fat and whole milk in 8oz glasses per week. For the analyses in which we hypothesized the effect of milk on cognitive decline through lactose, milk intake was operationalized as a combined intake of skim/low-fat and whole milk. Habitual milk intake at midlife was assessed as the average milk intake
reported at Visit 1 and Visit 3. Most common sources of measurement error associated with FFQ arise from the fixed list of foods, memory, perception of portion sizes, and interpretation of questions. However, reliability and validity of the FFQ have been tested and determined to be a sufficient to quantify relationship between estimated nutrient intake and disease in population studies 250
.
2. Preliminary data
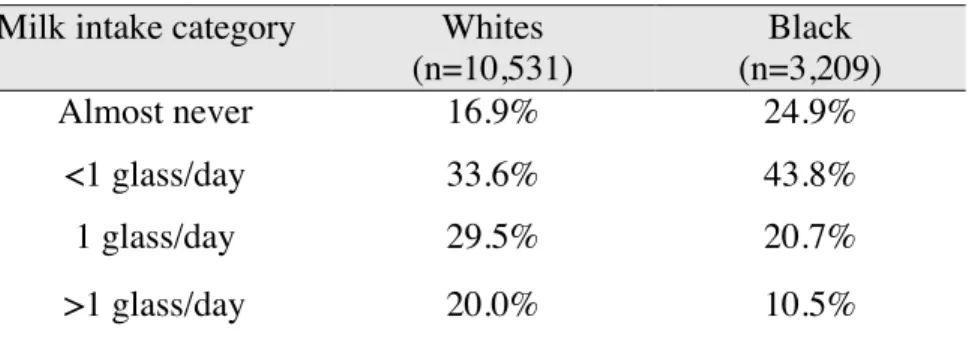
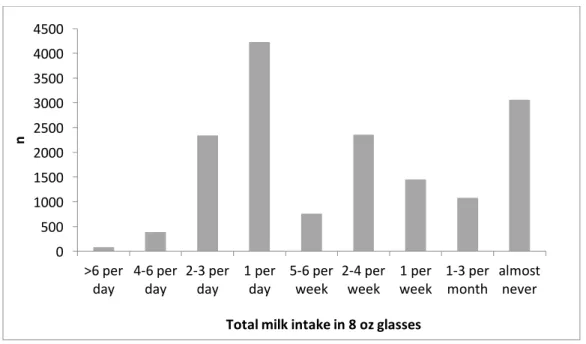
In preliminary analysis we assessed the distribution of milk intake among the study participants at Visit 1 (Figure 6). Among 13,741 participants who completed the FFQ, a
significant proportion (73.7%, n=10,127) reported consuming some milk throughout the week at the time of the assessment. Approximately 45% of the FFQ respondents reported consuming a glass of milk or more daily. About 19% of participants reported “almost never” consuming milk. This preliminary assessment suggested that there is enough variability in milk intake to study the association of milk intake with cognitive decline and with biomarkers of oxidative stress.
3. Selection of categories of milk intake for the analysis
Descriptive analyses suggested a non-normal distribution (Figure 6). Therefore, responses to the FFQ question concerning the amount of milk consumed were re-grouped into four categories: almost never (19%), <1 glass per day (36%), 1 glass per day (27%), >1 glass per day (18%).
4. Performance of the FFQ in ARIC
Outcome assessment
1. Assessment of cognitive status in ARIC
Cognitive function tests
Participants’ cognitive status was assessed on three occasions: at visits 2, 4, and 5, using tests that assessed cognitive function in three domains: verbal and short term memory, executive function and processing speed, and executive function and expressive language. Verbal learning and short-term memory were evaluated by the Delayed Word Recall Test (DWRT), during which participants were asked to learn 10 nouns, use them in sentences, and were then asked to recall those nouns after a period of 5 minutes. The score on the test is the number of words recalled (0-10)251
. Executive function and processing speed was assessed by the Digit Symbol Substitution test (DSST) during which participants used a key to write symbols corresponding to numbers in 90 seconds. The score on the test is the number of correctly written symbols and it ranges from 0 to 93252 . Executive function and expressive language was assessed by the Word Fluency Test (WFT) during which participants generate as many words starting with the letters F, A, and S as possible within 60 seconds, with one trial per letter. The score on this test is the sum of all the correct words generated253
. All three tests had high test-retest reliability, with intra-class correlation coefficients of r=0.75 for DWRT, r=0.82 for DSST, and r=0.82 for WFT251, 254, 255
. The tests were standardized and tests were administered by trained examiners in a fixed order during one session in a quiet room.
For the analysis, all scores were converted to z-scores standardized to Visit 2 mean and standard deviation. This was calculated for each test by subtracting each participant’s test score at each visit from the Visit 2 mean and dividing by the Visit 2 standard deviation. Global
for each Visit by averaging the z-scores of the 3 tests and then subtracting the global mean and dividing by standard deviation from the Visit 2 global Z score256-259
.
MCI and dementia classification
Presence of MCI and dementia among ARIC cohort participants was identified at the time of the Visit 5 examination. MCI and dementia ascertainment was based on diagnostic review of the following data: 1.Neuropsychiatric information (e.g. change in DSST, DWRT, WFT scores from previous visits); 2. Medical/family history (e.g. self-reported transient
ischemic attack (TIA) or stroke, neurologic history, family history); 3. Subjective memory (e.g. informant, clinical dementia rating score (CDR), functional assessment questionnaire (FAQ)); 4. Neurologic/physical examination/labs; 5. Imaging (e.g. infarct rating, white matter rating, prior imaging report from ARIC Brain MRI study); 6. Medications (e.g. medications known to impact cognition/alertness). Based on these criteria, records for participants with suspected dementia or MCI were reviewed by the Dementia/MCI Classification Committee for syndromic and etiologic diagnoses. A classification was confirmed by two diagnostic reviewers (one physician and one neuropsychologist) and adjudicated by a third independent reviewer in case of disagreement.
Covariate ascertainment
1. Assessment of levels of oxidative stress among study participants
Mitochondrial DNA copy number (mtDNA-CN)
It has been shown that ROS can cause damage to mitochondrial enzymes, resulting in mtDNA mutations, alterations in mitochondrial membrane permeability, and cell death208
. These mitochondrial defects have been attributed to reduced mtDNA content, expressed by a lower mtDNA-CN260
. The mtDNA-CN has been used in relation to many conditions associated with oxidative damage, such as frailty and all-cause mortality261
, general health among elderly262 , diabetes263
, several types of cancer264-267
, and neurodegenerative diseases268-270 .
Assessment of mtDNA-CN in ARIC
MtDNA-CN was determined as part of an ARIC ancillary study among 11,509 participants, with the majority of the samples coming from Visit 2. Analyses were performed using the Genvisis software package. First, a list of high-quality mitochondrial SNPs was hand-curated by employing the Basic Local Alignment Search Tool (BLAST) to remove SNPs which may cross-hybridize to the nuclear genome. The probe intensity of the remaining 25 SNPs was determined using quantile sketch normalization (apt-probeset-summarize) as implemented in the Affymetrix Power Tools software. The median of the normalized intensity, log R ratio (LRR) (PennCNV-Affy Pipeline) for all homozygous calls was GC corrected (GC correction refers to GC content bias, that is between the proportion of G and C bases in a region and the count of fragments mapped to it)271
and used as an initial estimate of mtDNA-CN for each sample. To correct for DNA quality, DNA quantity, and other technical artifacts, principal components (PCs) were generated using the BLAST filtered, GC corrected LRR of 43,316 autosomal SNPs. The following qc filters were used: call rate > 98%, HWE p-value > 0.00001, PLINK mishap p-value > 0.0001, association with sex p-value > 0.00001, linkage disequilibrium purning (r2
initial pool of 1000 PCs generated, a stepwise linear regression was performed to select the top 152 PCs order in such a way that they explain the variance of the initial estimates of mtDNA-CN. The final measure of mtDNA-CN used in these analyses were the standardized residuals from a race-stratified linear regression adjusting for the PCs, age, sex, sample collection site, and white blood cell count. PCs were included until no longer significant in the model272
.
2. Assessment of genetic variant for lactase persistence in ARIC
Genotype data were obtained for consenting ARIC participants using the Affymetrix Genome-Wide Human SNP Array 6.0 and the IBC chip array (Affymetrix, Santa Clara, CA, USA). Genotypes were excluded for call rates <90%, MAF (minor allele frequency) <1%, Hardy–Weinberg equilibrium deviation <10-6
, and genotype frequency that was different at P<10-6
from prior genotyped samples. Principal components were generated using the Eigensoft package (http://genepath.med.harvard.edu/~reich/Software.htm) and ancestry outliers were removed. SNPs imputation was performed in two steps: (1) Pre-phasing with ShapeIt (v1.r532 ) (2) Imputation with IMPUTE2. After frequency and genotyping pruning, there were 695,783 SNPs in the final set used for the imputation (669,450 autosomal SNPs). Final imputations were performed using IMPUTE2 based on the 1,000 Genomes Phase I integrated variant set release (v3) in NCBI build 37 (hg19) reference panel haplotypes. All 1092 individuals were used for the imputation from the reference panel. The final sample with genetic data used for imputation was 9713 Whites and 2871 Blacks249
. In this analysis we used the imputed genotype LCT-13910 C/T (polymorphism (rs4988235) upstream from the lactase (LCT) gene) in Whites99
and LCT-14010G/C (polymorphism (rs145946881)) in Blacks109