Scenario Graphs Applied to Network Security
Jeannette M. Wing Computer Science Department
Carnegie Mellon University 5000 Forbes Avenue, Pittsburgh, PA 15213
Abstract. Traditional model checking produces one counterexample to illustrate a violation of a property by a model of the system. Some applications benefit from having all counterexamples, not just one. We call this set of counterexamples a scenario graph. In this chapter we present two different algorithms for producing scenario graphs and explain how scenario graphs are a natural representation for attack graphs used in the security community. Through a detailed concrete example, we show how we can model a computer network and generate and analyze attack graphs automatically. The attack graph we produce for a network model shows all ways in which an intruder can violate a given desired security property.
1
Overview
Model checking is a technique for determining whether a formal model of a system satisfies a given property. If the property is false in the model, model checkers typically produce a single counterexample. The developer uses this counterexample to revise the model (or the property), which often means fixing a bug in the design of the system. The developer then iterates through the process, rechecking the revised model against the (possibly revised) property.
Sometimes, however, we would like all counterexamples, not just one. Rather than produce one example of how the model does not satisfy a given property, why not produce all of them at once? We call the set of all counterexamples a scenario graph. For a traditional use of model checking, e.g., to find bugs, each path in the graph represents a counterexample, i.e., a failure scenario. In our application to security, each path represents an attack, a way in which an intruder can attack a system. Attack graphs are a special case of scenario graphs.
This chapter first gives two algorithms for producing scenario graphs. The first algorithm was published in [15]; the second in [13]. Then, we interpret scenario graphs as attack graphs. We walk through a simple example to show how to model the relevant aspects of a computer network and we present some example attack graphs. We highlight two automated analyses that system administrators might perform once they have attack graphs at their disposal. We summarize our practical experience with generating attack graphs using our algorithms and discuss related work. We close with some suggestions for future work on scenario graphs in general and attack graphs more specifically.
2
Algorithms for Generating Scenario Graphs
We present two algorithms for generating scenario graphs. The first is based on symbolic model checking and produces counterexamples for only safety properties, as expressed in terms of a computational tree logic. The second is based on explicit-state model checking and produces counterexamples for both safety and liveness properties, as expressed in terms of a linear temporal logic.
Both algorithms produce scenario graphs that guarantee the following informally stated properties: – Soundness: Each path in the graph is a violation of the given property.
– Exhaustive: The graph contains all executions of the model that violate the given property.
– Succinctness of states: Each node in the graph represents a state that participates in some counterexample. – Succinctness of transitions: Each edge in the graph represents a state transition that participates in some
coun-terexample.
These properties of our scenario graphs are not obvious, in particular for the second algorithm. See [21] for formal definitions and proofs.
Input:
S– set of states
R⊆S×S– transition relation S0 ⊆S– set of initial states
L:S→2AP – labeling of states with propositional formulas p=AG(¬unsafe)– a safety property
Output:
Scenario graphGp=Sunsafe, Rp, S0p, Ssp Algorithm:GenerateScenarioGraph(S, R, S0, L, p)
1. Sreach = reachable(S, R, S0, L)
(* Use model checking to find the set of statesSunsafethat violate the safety property AG(¬unsafe). *)
2. Sunsafe = modelCheck(Sr, R, S0, L, p).
(* Restrict the transition relationRto states in the setSunsafe*) 3. Rp = R∩(Sunsafe×Sunsafe). Sp 0 = S0∩Sunsafe. Sp s = {s|s∈Sunsafe∧unsafe∈L(s)}. 4. ReturnGp=Sunsafe, Rp, S0p, Ssp.
Fig. 1. Symbolic Algorithm for Generating Scenario Graphs
2.1 Symbolic Algorithm
Our first algorithm for producing scenario graphs is inspired by the symbolic model checking algorithm as imple-mented in model checkers such as NuSMV [17]. Our presentation and discussion of the algorithm in this section is taken almost verbatim from [22].
In the model checker NuSMV, the modelM is a finite labeled transition system and pis a property written in
Computation Tree Logic (CTL). In this section, we consider only safety properties, which in CTL have the form AGf
(i.e.,p=AGf, wherefis a formula in propositional logic). If the modelM satisfies the propertyp, NuSMV reports “true.” IfM does not satisfyp, NuSMV produces a counterexample. A single counterexample shows a scenario that leads to a violation of the safety property.
Scenario graphs depict ways in which the execution of the model of a system can lead into an unsafe state. We can express the property that an unsafe state cannot be reached as:
AG(¬unsafe)
When this property is false, there are unsafe states that are reachable from the initial state. The precise meaning of
unsafe depends on the system being modeled. For security, unsafe might mean that an intruder has gained root access
to a host on a network.
We briefly describe the algorithm (Figure 1) for constructing scenario graphs for the property AG(¬unsafe). We start with a set of states, S, a state transition relation,R, a set of initial states, S0, a labeling function,L, and a safety property,p. The labeling function defines what atomic propositions are true in a given state. The first step in the algorithm is to determine the set of statesSreach that are reachable from the initial state. (This is a standard step in symbolic model checkers, whereSreach is represented symbolically, not explicitly.) Next, the algorithm computes the set of reachable statesSunsafe that have a path to an unsafe state. The set of statesSunsafe is computed using an iterative algorithm derived from a fix-point characterization of the AG operator [4]. LetRbe the transition relation of the model, i.e.,(s, s)∈ Rif and only if there is a transition from statestos. By restricting the domain and range ofRtoSunsafe we obtain a transition relationRp that encapsulates the edges of the scenario graph. Therefore, the scenario graph isSunsafe, Rp, S0p, Ssp, whereSunsafeandRprepresent the set of nodes and set of edges of the graph, respectively,S0p=S0∩Sunsafe is the set of initial states, andSsp ={s|s∈Sunsafe ∧unsafe ∈L(s)}is the set of success states.
Input:
M– the model B¨ucchi automaton p– an LTL property
Output:
Scenario graphMp=M∩ ¬p Algorithm:GenerateScenarioGraph(M, p)
1. Convert LTL formula¬pto equivalent B¨ucchi automatonNp. 2. Construct the intersection automatonI=M∩ ¬Np.
Iaccepts the languageL(M)\L(p), which is precisely the set of of executions ofMforbidden byp.
3. Compute SCC, the set of strongly-connected components ofIthat include at least one acceptance state.
4. ReturnMp, which consists of SCC plus all the paths to any component inSCCfrom any initial state ofI.
Fig. 2. Explicit-State Algorithm for Generating Scenario Graphs
In symbolic model checkers, such as NuSMV, the transition relation and sets of states are represented using or-dered binary decision diagrams (BDDs) [3], a compact representation for boolean functions. There are efficient BDD algorithms for all operations used in our algorithm.
2.2 Explicit-State Algorithm
Our second algorithm for producing scenario graphs uses an explicit-state model checking algorithm based onω -automata theory. Model checkers such as SPIN [12] use explicit-state model checking. Our presentation and discussion of the algorithm in this section is taken almost verbatim from [13].
Figure 2 contains a high-level outline of our second algorithm for generating scenario graphs. We model our system as a B¨ucchi automatonM. B¨ucchi automata are finite state machines that accept infinite executions. A B¨ucchi automa-ton specifies a subset of acceptance states. The automaautoma-ton accepts any infinite execution that visits an acceptance state infinitely often. The propertypis specified in Linear Temporal Logic (LTL). The propertypinduces a languageL(p) of executions that are permitted under the property. The executions of the modelM that are not permitted bypthus constitute the languageL(M)\L(p). The scenario graph is the automaton,Mp=M ∩ ¬p, accepting this language. The construction procedure forMpuses Gerth et.al.’s algorithm [11] for converting LTL formulae to B¨ucchi automata (Step 1). The B¨ucchi acceptance condition implies that any scenario accepted byMpmust eventually reach a strongly connected component of the graph that contains at least one acceptance state. Such components are found in Step 3 using Tarjan’s classic strongly connected component algorithm [26]. This step isolates the relevant parts of the graph and prunes states that do not participate in any scenarios.
3
Attack Graphs are Scenario Graphs
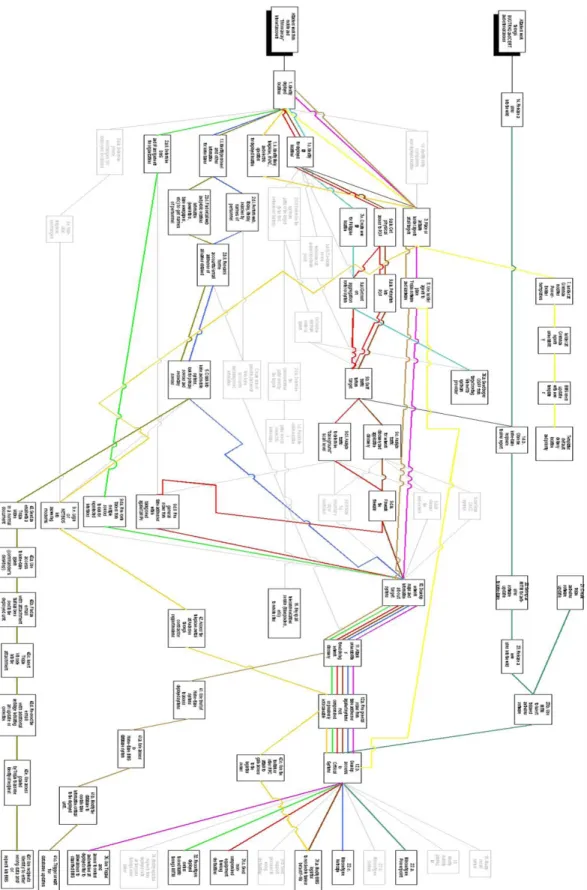
In the security community, Red Teams construct attack graphs to show how a system is vulnerable to attack. Each path in an attack graph shows a way in which an intruder can compromise the security of a system. These graphs are drawn by hand. A typical result of such intensive manual effort is a floor-to-ceiling, wall-to-wall “white board” attack graph, such as the one produced by a Red Team at Sandia National Labs for DARPA’s CC20008 Information battle space preparation experiment and shown in Figure 3. Each box in the graph designates a single intruder action. A path from one of the leftmost boxes in the graph to one of the rightmost boxes is a sequence of actions corresponding to an attack scenario. At the end of any such scenario, the intruder has broken the network security in some way. The graph is included here for illustrative purposes only, so we omit the description of specific details.
Since these attack graphs are drawn by hand, they are prone to error: they might be incomplete (missing attacks), they might have redundant paths or redundant subgraphs, or they might have irrelevant nodes, transitions, or paths.
The correspondence between scenario graphs and attack graphs is simple. For a given desired security property, we generate the scenario graph for a model of the system to be protected. An example security property is that an intruder should never gain root access to a specific host. Since each scenario graph is property-specific, in practice, we might need to generate many scenario graphs to represent the entire attack graph that a Red Team might construct manually. Our main contribution is that we automate the process of producing attack graphs: (1) Our technique scales beyond what humans can do by hand; and (2) since our algorithms guarantee to produce scenario graphs that are sound, exhaustive, and succinct, our attack graphs are not subject to the errors that humans are prone to make.
4
Network Attack Graphs
Network attack graphs represent a collection of possible penetration scenarios in a computer network. Each penetration scenario is a sequence of actions taken by the intruder, typically culminating in a particular goal—administrative access on a particular host, access to a database, service disruption, etc. For appropriately constructed network models, attack graphs give a bird’s-eye view of every scenario that can lead to a serious security breach.
4.1 Network Attack Model
We model a network using either the tuple of inputs,S, R, S0, L, in the first algorithm (Figure 1) or the B¨ucchi automaton,M, of the second algorithm (Figure 2).
To be concrete, for the remainder of this chapter we will work in the context of the second algorithm. Also, rather than use the full B¨ucchi automaton to model attacks on a network, for our application to network security, we use a simpler attack modelM =S, τ, s0, whereSis a finite set of states,τ ⊆S×Sis a transition relation, ands0∈S is an initial state. The state spaceSrepresents a set of three agentsI={E, D, N}. AgentEis the attacker, agentD is the defender, and agentNis the system under attack. Each agenti∈ Ihas its own set of possible statesSi, so that S=×i∈ISi.
With each agenti∈ Iwe associate a set of actionsAi, so that the total set of actions in the model isA=i∈IAi. A state transition in a network attack model corresponds to a single action by the intruder, a defensive action by the system administrator (or security software installed on the network), or a routine network action. The single root state s0represents the initial state of each agent before any action has taken place. In general, the attacker’s actions move
the system “toward” some undesirable (from the system’s point of view) state, and the defender’s actions attempt to counteract that effect. For instance, in a computer network the attacker’s actions would be the steps taken by the intruder to compromise the network, and the defender’s actions would be the steps taken by the system administrator to disrupt the attack.
Real networks consist of a large variety of hardware and software pieces, most of which are not involved in cyber attacks. We have chosen six network components relevant to constructing network attack models. The components were chosen to include enough information to represent a wide variety of networks and attack scenarios, yet keep the model reasonably simple and small. The following is a list of the components:
1. H, a set of hosts connected to the network
2. C, a connectivity relation expressing the network topology and inter-host reachability 3. T, a relation expressing trust between hosts
4. I, a model of the intruder
5. A, a set of individual actions (exploits) that the intruder can use to construct attack scenarios 6. Ids, a model of the intrusion detection system
We construct an attack modelM based on these components. Table 1 defines each agenti’s stateSiand action setAi in terms of the network components. This construction gives the system administrator an entirely passive “detection” role, embodied in the alarm action of the intrusion detection system. For simplicity, regular network activity is omitted entirely.
It remains to make explicit the transition relation of the attack modelM. Each transition(s1, s2)∈τis either an action by the intruder, or an alarm action by the system administrator. An alarm action happens whenever the intrusion detection system is able to flag an intruder action. An actiona∈Arequires that the preconditions ofahold in state s1and the effects ofahold ins2. Action preconditions and effects are explained in Section 4.2.
Agenti∈ I Si Ai
E I A
D Ids {alarm}
N H×C×T Table 1. Network attack model
4.2 Network Components
We now give details about each network component.
Hosts. Hosts are the main hubs of activity on a network. They run services, process network requests, and maintain data. With rare exceptions, every action in an attack scenario will target a host in some way. Typically, an action takes advantage of vulnerable or misconfigured software to gain information or access privileges for the attacker. The main goal in modeling hosts is to capture as much information as possible about components that may contribute to creating an exploitable vulnerability.
A hosth∈H is a tupleid, svcs, sw, vuls, where
– id is a unique host identifier (typically, name and network address)
– svcs is a list of service name/port number pairs describing each service that is active on the host and the port on which the service is listening
– sw is a list of other software operating on the host, including the operating system type and version
– vuls is a list of host-specific vulnerable components. This list may include installed software with exploitable security flaws (example: a setuid program with a buffer overflow problem), or mis-configured environment settings (example: existing user shell for system-only users, such as ftp)
Network Connectivity. Following Ritchey and Ammann [20], connectivity is expressed as a ternary relationC ⊆ H×H×P, whereP is a set of integer port numbers.C(h1, h2, p)means that hosth2is reachable from hosth1on portp. Note that the connectivity relation incorporates firewalls and other elements that restrict the ability of one host to connect to another. Slightly abusing notation, we sayR(h1, h2)when there is a network route fromh1toh2. Trust. We model trust as a binary relationT ⊆H×H, whereT(h1, h2)indicates that a user may log in from host h2to hosth1without authentication (i.e., hosth1“trusts” hosth2).
Services. The set of servicesSis a list of unique service names, one for each service that is present on any host on the network. We distinguish services from other software because network services so often serve as a conduit for exploits. Furthermore, services are tied to the connectivity relation via port numbers, and this information must be included in the model of each host. Every service name in each host’s list of services comes from the setS.
Intrusion Detection System. We associate a boolean variable with each action, abstractly representing whether or not the IDS can detect that particular action. Actions are classified as being either detectable or stealthy with respect to the IDS. If an action is detectable, it will trigger an alarm when executed on a host or network segment monitored by the IDS; if an action is stealthy, the IDS does not see it.
We specify the IDS as a function ids: H×H×A→ {d, s, b}, where ids(h1, h2, a) = d if actionais detectable when executed with source hosth1and target hosth2; ids(h1, h2, a) = s if actionais stealthy when executed with source host h1 and target hosth2; and ids(h1, h2, a) = b if actiona has both detectable and stealthy strains, and success in detecting the action depends on which strain is used. Whenh1andh2refer to the same host, ids(h1, h2, a)
specifies the intrusion detection system component (if any) located on that host. Whenh1 andh2refer to different hosts, ids(h1, h2, a) specifies the intrusion detection system component (if any) monitoring the network path between
Actions. Each action is a tripler, hs, ht, wherehs ∈ H is the host from which the action is launched,ht ∈ H is the host targeted by the action, andr is the rule that describes how the intruder can change the network or add to his knowledge about it. A specification of an action rule has four components: intruder preconditions, network
preconditions, intruder effects, and network effects. The intruder preconditions component places conditions on the
intruder’s store of knowledge and the privilege level required to launch the action. The network preconditions specifies conditions on target host state, network connectivity, trust, services, and vulnerabilities that must hold before launching the action. Finally, the intruder and network effects components list the action’s effects on the intruder and on the network, respectively.
Intruder. The intruder has a store of knowledge about the target network and its users. The intruder’s store of knowl-edge includes host addresses, known vulnerabilities, user passwords, information gathered with port scans, etc. Also associated with the intruder is the function plvl: Hosts→ {none, user, root}, which gives the level of privilege that the intruder has on each host. For simplicity, we model only three privilege levels. There is a strict total order on the privilege levels: none≤user≤root.
Omitted Complications. Although we do not model actions taken by user services for the sake of simplicity, doing so in the future would let us ask questions about effects of intrusions on service quality. A more complex model could include services provided by the network to its regular users and other routine network traffic. These details would reflect more realistically the interaction between intruder actions and regular network activity at the expense of additional complexity.
Another activity worth modeling explicitly is administrative steps taken either to hinder an attack in progress or to repair the damage after an attack has occurred. The former corresponds to transitioning to states of the model that offer less opportunity for further penetration; the latter means “undoing” some of the damage caused by successful attacks.
5
Example Network
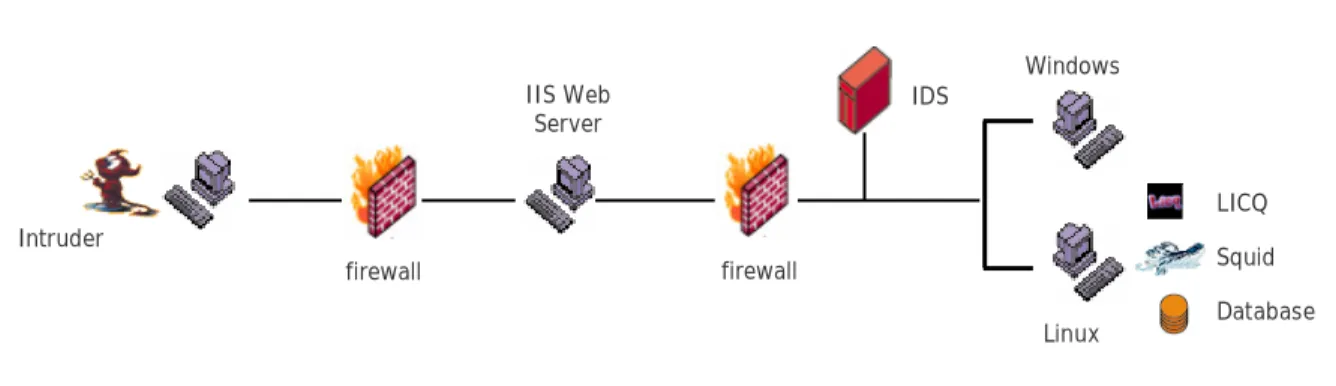
Database Intruder firewall Windows Linux Squid firewall IIS Web Server IDS LICQFig. 4. Example Network
Figure 4 shows an example network. There are two target hosts,WindowsandLinux, on an internal company network, and a Web server on an isolated “demilitarized zone” (DMZ) network. One firewall separates the internal network from the DMZ and another firewall separates the DMZ from the rest of the Internet. An intrusion detection system (IDS) watches the network traffic between the internal network and the outside world.
TheLinuxhost on the internal network is running several services—Linux “I Seek You” (LICQ) chat software,
Squid web proxy, and a Database. The LICQ client lets Linux users exchange text messages over the Internet. The Squid web proxy is a caching server. It stores requested Internet objects on a system closer to the requesting site than
consumption. The host inside the DMZ is running Microsoft’s Internet Information Services (IIS) on a Windows platform.
The intruder launches his attack starting from a single computer, which lies on the outside network. To be concrete, let us assume that his eventual goal is to disrupt the functioning of the database. To achieve this goal, the intruder needs root access on the database hostLinux. The five actions at his disposal are summarized in Table 2.
Each of the five actions corresponds to a real-world vulnerability and has an entry in the Common Vulnerabilities and Exposures (CVE) database. CVE [8] is a standard list of names for vulnerabilities and other information security exposures. A CVE identifier is an eight-digit string prefixed with the letters “CVE” (for accepted vulnerabilities) or “CAN” (for candidate vulnerabilities).
The IIS buffer overflow action exploits a buffer overflow vulnerability in the Microsoft IIS Web Server to gain administrative privileges remotely.
The Squid action lets the attacker scan network ports on machines that would otherwise be inaccessible to him, taking advantage of a misconfigured access control list in the Squid web proxy.
The LICQ action exploits a problem in the URL parsing function of the LICQ software for Unix-flavor systems. An attacker can send a specially-crafted URL to the LICQ client to execute arbitrary commands on the client’s computer, with the same access privileges as the user of the LICQ client.
The scripting action lets the intruder gain user privileges on Windows machines. Microsoft Internet Explorer 5.01 and 6.0 allow remote attackers to execute arbitrary code via malformed Content-Disposition and Content-Type header fields that cause the application for the spoofed file type to pass the file back to the operating system for handling rather than raise an error message. This vulnerability may also be exploited through HTML formatted email. The action requires some social engineering to entice a user to visit a specially-formatted Web page. However, the action can work against firewalled networks, since it requires only that internal users be able to browse the Web through the firewall.
Finally, the local buffer overflow action can exploit a multitude of existing vulnerabilities to let a user without administrative privileges gain them illegitimately. For the CVE number referenced in the table, the action exploits a buffer overflow flaw in the at program. The at program is a Linux utility for queueing shell commands for later execution.
Action Effect Example CVE ID
IIS buffer overflow remotely get root CAN-2002-0364 Squid port scan port scan CVE-2001-1030 LICQ gain user gain user privileges remotely CVE-2001-0439 scripting exploit gain user privileges remotely CAN-2002-0193 local buffer overflow locally get root CVE-2002-0004
Table 2. Intruder actions
Some of the actions that we model have multiple instantiations in the CVE database. For example, the local buffer overflow action exploits a common coding error that occurs in many Linux programs. Each program vulnerable to local buffer overflow has a separate CVE entry, and all such entries correspond to the same action rule. The table lists only one example CVE identifier for each rule.
5.1 Example Network Components
Services, Vulnerabilities, and Connectivity. We specify the state of the network to include services running on each host, existing vulnerabilities, and connectivity between hosts. There are five boolean variables for each host, specifying whether any of the three services are running and whether either of two other vulnerabilities are present on that host (Table 3).
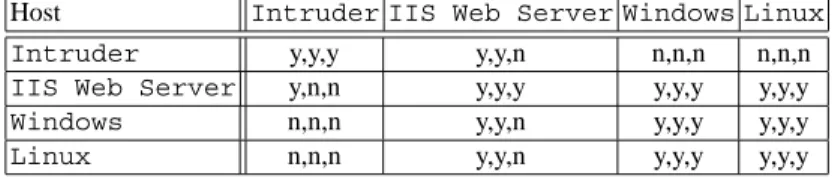
The model of the target network includes connectivity information among the four hosts. The initial value of the connectivity relationR is shown in Table 4. An entry in the table corresponds to a pair of hosts(h1, h2). IIS and
variable meaning
w3svch IIS web service running on hosth squidh Squid proxy running on hosth licqh LICQ running on hosth
scriptingh HTML scripting is enabled on hosth vul-ath at executable vulnerable to overflow on hosth
Table 3. Variables specifying a host
Squid listen on port 80 and the LICQ client listens on port 5190, and the connectivity relation specifies which of these
services can be reached remotely from other hosts. Each entry consists of three boolean values. The first value is ‘y’ ifh1andh2are connected by a physical link, the second value is ‘y’ ifh1can connect toh2on port 80, and the third value is ‘y’ ifh1can connect toh2on port 5190.
Host Intruder IIS Web Server Windows Linux
Intruder y,y,y y,y,n n,n,n n,n,n
IIS Web Server y,n,n y,y,y y,y,y y,y,y
Windows n,n,n y,y,n y,y,y y,y,y
Linux n,n,n y,y,n y,y,y y,y,y
Table 4. Connectivity relation
We use the connectivity relation to reflect the settings of the firewall as well as the existence of physical links. In the example, the intruder machine initially can reach only the Web server on port 80 due to a strict security policy on the external firewall. The internal firewall is initially used to restrict internal user activity by disallowing most outgoing connections. An important exception is that internal users are permitted to contact the Web server on port 80.
In this example the connectivity relation stays unchanged throughout an attack. In general, the connectivity relation can change as a result of intruder actions. For example, an action may enable the intruder to compromise a firewall host and relax the firewall rules.
Intrusion Detection System. A single network-based intrusion detection system protects the internal network. The paths between hostsIntruderandWeband betweenWindowsandLinuxare not monitored; the IDS can see the traffic between any other pair of hosts. There are no host-based intrusion detection components. The IDS always detects the LICQ action, but cannot see any of the other actions. The IDS is represented with a two-dimensional array of bits, shown in Table 5. An entry in the table corresponds to a pair of hosts(h1, h2). The value is ‘y’ if the path betweenh1andh2is monitored by the IDS, and ‘n’ otherwise.
Host Intruder IIS Web Server Windows Linux
Intruder n n y y
IIS Web Server n n y y
Windows y y n n
Linux y y n n
Intruder. The intruder’s store of knowledge consists of a single boolean variable ‘scan’. The variable indicates whether the intruder has successfully performed a port scan on the target network. For simplicity, we do not keep track of specific information gathered by the scan. It would not be difficult to do so, at the cost of increasing the size of the state space.
Initially, the intruder has root access on his own machineIntruder, but no access to the other hosts. The ‘scan’ variable is set to false.
Actions. There are five action rules corresponding to the five actions in the intruder’s arsenal. Throughout the descrip-tion,Sis used to designate the source host andT the target host.R(S, T, p)says that hostT is reachable from hostS on portp. The abbreviation plvl(X)refers to the intruder’s current privilege level on hostX.
Recall that a specification of an action rule has four components: intruder preconditions, network preconditions,
intruder effects, and network effects. The intruder preconditions component places conditions on the intruder’s store
of knowledge and the privilege level required to launch the action. The network preconditions component specifies conditions on target host state, network connectivity, trust, services, and vulnerabilities that must hold before launching the action. Finally, the intruder and network effects components list the effects of the action on the intruder’s state and on the network, respectively.
Sometimes the intruder has no logical reason to execute a specific action, even if all technical preconditions for the action have been met. For instance, if the intruder’s current privileges include root access on the Web Server, the intruder would not need to execute the IIS buffer overflow action against the Web Server host. We have chosen to augment each action’s preconditions with a clause that disables the action in instances when the primary purpose of the action has been achieved by other means. This change is not strictly conservative, as it prevents the intruder from using an action for its secondary side effects. However, we feel that this is a reasonable price to pay for removing unnecessary transitions from the attack graphs.
IIS Buffer Overflow. This remote-to-root action immediately gives a remote user a root shell on the target machine.
action IIS-buffer-overflow is intruder preconditions
plvl(S)≥user User-level privileges on hostS plvl(T)<root No root-level privileges on hostT
network preconditions
w3svcT Host T is running vulnerable IIS server
R(S, T,80) HostTis reachable fromSon port 80
intruder effects
plvl(T) :=root Root-level privileges on hostT
network effects
¬w3svcT Host T is not running IIS
end
Squid Port Scan. The Squid port scan action uses a misconfigured Squid web proxy to conduct a port scan of
neigh-boring machines and report the results to the intruder.
action squid-port-scan is intruder preconditions
plvl(S) =user User-level privileges on hostS
¬scan We have not yet performed a port scan
network preconditions
squidT Host T is running vulnerable Squid proxy
intruder effects
scan We have performed a port scan on the network
network effects
No changes to the network component
end
LICQ Remote to User. This remote-to-user action immediately gives a remote user a user shell on the target machine.
The action rule assumes that a port scan has been performed previously, modeling the fact that such actions typically become apparent to the intruder only after a scan reveals the possibility of exploiting software listening on lesser-known ports.
action LICQ-remote-to-user is intruder preconditions
plvl(S)≥user User-level privileges on hostS plvl(T) =none No user-level privileges on hostT
scan We have performed a port scan on the network
network preconditions
licqT Host T is running vulnerable LICQ software
R(S, T,5190) HostTis reachable fromSon port 5190
intruder effects
plvl(T) :=user User-level privileges on hostT network effects
No changes to the network component
end
Scripting Action. This remote-to-user action immediately gives a remote user a user shell on the target machine. The
action rule does not model the social engineering required to get a user to download a specially-created Web page.
action client-scripting is intruder preconditions
plvl(S)≥user User-level privileges on hostS plvl(T) =none No user-level privileges on hostT
network preconditions
scriptingT HTML scripting is enabled on hostT
R(T, S,80) HostSis reachable fromTon port 80
intruder effects
plvl(T) :=user User-level privileges on hostT network effects
No changes to the network component
end
Local Buffer Overflow. If the intruder has acquired a user shell on the target machine, this action exploits a buffer
overflow vulnerability on a setuid root file (in this case, the at executable) to gain root access.
action local-setuid-buffer-overflow is intruder preconditions
network preconditions
vul-atT There is a vulnerable at executable
intruder effects
plvl(T) :=root Root-level privileges on hostT network effects
No changes to the network component
end
5.2 Sample Attack Graphs
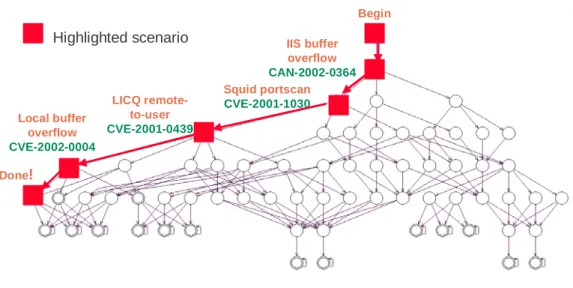
Begin IIS buffer overflow CAN-2002-0364 Squid portscan CVE-2001-1030 LICQ remote-to-user CVE-2001-0439 Local buffer overflow CVE-2002-0004 Done! Highlighted scenario
Fig. 5. Example Attack Graph
Figure 5 shows a screenshot of the attack graph generated with our attack graph toolkit (Section 7.2) for the security property
G(intruder.privilege[lin]<root)
which states that the intruder will never attain root privileges on theLinuxhost. In Figure 5, a sample attack scenario is highlighted with solid square nodes, with each attack step identified by name and CVE number. Since the external firewall restricts most network connections from the outside, the intruder has no choice with respect to the initial step— it must be a buffer overflow action on the IIS Web server. Once the intruder has access to the Web server machine, his options expand. The highlighted scenario is the shortest route to success. The intruder uses the Web server machine to launch a port scan via the vulnerable Squid proxy running on the Linux host. The scan discovers that it is possible to obtain user privileges on the Linux host with the LICQ exploit. After that, a simple local buffer overflow gives the intruder administrative control over theLinuxmachine. The last transition in the action path is a bookkeeping step, signifying the intruder’s success.
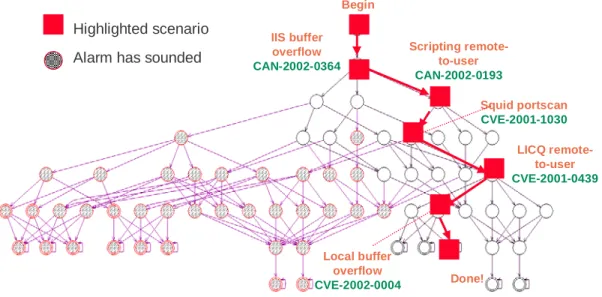
Any information explicitly represented in the model is available for inspection and analysis in the attack graph. For instance, with a few clicks using our graphical user interface tool, we are able to highlight portions of the graph “covered” by the intrusion detection system. Figure 6 shades the nodes where the IDS alarm has been sounded. These nodes lie on paths that use the LICQ action along a network path monitored by the IDS. It is clear that while a substantial portion of the graph is covered by the IDS, the intruder can escape detection and still succeed by taking
one of the paths on the right side of the graph. One such attack scenario is highlighted with square nodes in Figure 6. It is very similar to the attack scenario discussed in the previous paragraph, except that the LICQ action is launched from the internalWindowsmachine, where the intrusion detection system does not see it. To prepare for launching the LICQ action from theWindowsmachine, an additional step is needed to obtain user privileges in the machine. For that, the intruder uses the client scripting exploit on the Windows host immediately after taking over the Web machine.
Begin Squid portscan CVE-2001-1030 LICQ remote-to-user CVE-2001-0439 Local buffer overflow CVE-2002-0004 Done! Scripting remote-to-user CAN-2002-0193 IIS buffer overflow CAN-2002-0364 Highlighted scenario Alarm has sounded
Fig. 6. Alternative Attack Scenario Avoiding the IDS
6
Attack Graph Analysis
Attack graphs serve as the basis of further analysis in several areas of network security, including intrusion detection, defense, and forensic analysis. System administrators use attack graphs for the following reasons:
– To gather information: Attack graphs can answer questions like “What attacks is my system vulnerable to?” and “From an initial configuration, how many different ways can an intruder reach a final state to achieve his goal?” – To make decisions: Attack graphs can answer questions like “ Which set of actions should I prevent to ensure
the intruder cannot achieve his goal?” or “Which set of security measures should I deploy to ensure the intruder cannot achieve his goal?”
Since we can produce attack graphs automatically, we make it convenient for system administrators to do “What if?” analysis. Administrators can look at a graph we produce and determine what would happen if they were to change firewall rules, add an intrusion detection system, install a software patch, or remove a host from the network. Does making a change to the system make the graph smaller and in what way?
In this section we look at two kinds of analyses that we can perform on an attack graph: single action removal and critical action set minimization. The first lets administrators see the effect of removing a single action from the intruder’s arsenal. The second identifies a set of actions that if removed would then prevent the intruder from achieving his goal.
To demonstrate the analyses, we expand the example from Section 5.1 with an extra hostUseron the external network and several new actions. An authorized userW of the internal network owns the new host and uses it as a terminal to work remotely on the internalWindowshost. The new actions permit the intruder to take over the host User, sniff userW’s login credentials, and log in to the internalWindowshost using the stolen credentials. We omit
the details of the new actions, as they are not essential to understanding the examples. Figure 7(a) shows the full graph for the modified example. The graph is significantly larger, reflecting the expanded number of choices available to the intruder.
6.1 Single Action Removal.
A simple kind of analysis determines the impact of removing one action from the intruder’s arsenal. Recall from Section 4 that each action is a tripler, hs, ht, wherehs∈H is the host from which the attack is launched,ht∈H is the host targeted by the attack, andris an action rule. The user specifies a setAremof action triples to be removed from the attack graph. Our toolkit deletes the transitions corresponding to each triple in the setAremfrom the graph and then removes the nodes that have become unreachable from the initial state.
As demonstrated in Figure 7, this procedure can be repeated several times, reducing the size of the attack graph at each step. The full graph in Figure 7(a) has 362 states. Removing one of two ways the intruder can sniff userW’s login credentials produces the graph in Figure 7(b), with 213 states. Removing one of the local buffer overflow actions produces the graph in Figure 7(c), with 66 states. At each step, the user is able to judge visually the impact of removing a single action from the intruder’s arsenal.
6.2 Critical Action Set Minimization
Let’s turn to a more sophisticated analysis, which is a kind of minimization analysis [14]. Suppose the system ad-ministrator must decide among several different firewall configurations, or among several vulnerabilities to patch, or among several intrusion detection systems to set up. Each choice prevents a different subset of actions. What should the system administrator do?
We cast this question in terms of the Minimum Critical Set of Actions (MCSA) Problem: What is a minimum set of actions that must be prevented to guarantee the intruder cannot achieve his goal? The sketch of our solution is:
1. Reduce MCSA to the Minimum Hitting Set (MHS) Problem [14]. 2. Reduce MHS to the Minimum Set Covering (MSC) Problem [2].
3. Use a textbook Greedy Approximation Algorithm to approximate a solution [5].
The first reduction can be briefly understood as follows: Each path in the graph is an attack. Label each edge in the path with the action that causes the state transition. (Note that an action might label more than one edge in the path.) The path thus defines a set of actions used to “realize” an attack. An attack graph is thus a set,R, of “realizable” sets of actions. We need to hit each set inR. If we hit each set inR, then we cut the graph. If we cut the graph, then there is no path from the initial state to any final (success) state in the graph. To find a minimum critical set of actions then reduces to finding a minimum hitting set forR. That is, a minimum hitting set forRwill identify a set of actions that the intruder must have in his arsenal in order for him to succeed (achieve his goal). This set is a critical set of actions. In short, once an attack graph is generated, we can use an approximation algorithm to find an approximately-optimal critical set of actions that will completely disconnect the initial state from states where the intruder has achieved his goals [21]. A related algorithm can find an approximately-optimal set of security measures that ac-complish the same goal. With a single click using our graphical user interface tool, the user can invoke both of these exposure minimization algorithms.
The effect of the critical action set algorithm on the modified example attack graph is shown in Figure 8(a). The algorithm finds a critical action set of size 1, containing the port scan action exploiting the Squid web proxy. The graph nodes and edges corresponding to actions in the critical set computed by the algorithm are highlighted in the toolkit by shading the relevant nodes. The shaded nodes are seen clearly when we zoom in to inspect a part of the graph on a larger scale (Figure 8(b)).
Since the computed action set is always critical, removing every action triple in the set from the intruder’s arsenal is guaranteed to result in an empty attack graph. In the example, we might patch theLinuxmachine with a new version of the Squid proxy, thereby removing every action triple that uses the Squid port scan rule on theLinuxmachine from the intruder’s arsenal.
7
Practical Experience
7.1 Performance
In practice we found that the explicit-state algorithm has good performance: the speed to generate the attack graph is linear in the number of reachable state transitions [21]. We also found that for our limited number of examples, our explicit-state algorithm is better than our symbolic algorithm in terms of time to generate graphs. In all of our examples, our models are large due to their large number of state variables, but at the same time they have a very small reachable state space. Thus we have a double whammy against the symbolic algorithm: Small reachable state spaces are better for explicit-state model checking, and larger numbers of state variables are worse for symbolic model checking.
These performance results, however, are not definitive. For one, we did not try to fine tune the implementation of our symbolic model checking algorithm. But most importantly, our application to security biases our experimental results in favor of our explicit-state algorithm. For other applications, the symbolic algorithm might be the better choice, in particular for general scenario graphs.
7.2 Toolkit
We built a toolkit that allows us to model networked systems [23]. We write XML input specifications that model the following kinds of information of a system: connectivity between hosts on the network, services running on each host, firewall rules, host-based and network-based intrusion detection systems, and most importantly, the actions an intruder might take in attempting to attack a system. We chose XML as our input specification language for modularity: we can plug in any model checker as our attack graph generator and translate our XML input specifications into the input language of the model checker. In our toolkit, we use our modifications of the NuSMV and SPIN model checkers, reflecting our two algorithms, to produce attack graphs.
One of the challenges to using our tools is providing a model of the network. We rely on external data sources to supply information necessary to build a network attack model. Specifically, it is necessary to know the topology of the target network, configuration of the network hosts, and vulnerabilities present on the network. In addition, we require access to a database of action rules to build the transition relation of the attack model.
We could expect the user to specify all of the necessary information manually, but such a task is tedious, error-prone, and unrealistic for networks of more than a few nodes. Thus, we recommend deploying the attack graph toolkit in conjunction with information-gathering systems that supply some of the data automatically and with existing vul-nerability databases. In our work, to give us network topology and host configuration data, we integrated the attack graph generator with two such systems, MITRE Corp’s Outpost and Lockheed Martin’s ANGI [23]. For our action rules, we specified a library of actions based on a vulnerability database provided to us by SEI/CERT. This database has over 150 actions representing many published CVEs. We wrote precondition/effects specifications as in Section 5.
8
Related Work
Generating a set of all counterexamples is a novel addition to the repertoire of model checking techniques. Sheyner’s dissertation [21] gives the most comprehensive description of scenario graphs and algorithms for generating them.
We restrict the remainder of our discussion of related work to attack graphs.
Phillips and Swiler [19] propose the concept of attack graphs that is similar to the one described here. However, they take an “attack-centric” view of the system. Since we work with a general modeling language, we can express in our model both seemingly benign system events (such as failure of a link) and malicious events (such as attacks). Therefore, our attack graphs are more general than the one proposed by Phillips and Swiler. Swiler et al. describe a tool [25] for generating attack graphs based on their previous work. Their tool constructs the attack graph by forward exploration starting from the initial state.
The advantage of using model checking instead of forward search is that the technique can be expanded to include liveness properties, which can model service guarantees in the face of malicious activity. For example, a model of a banking network could have a liveness security property such as
G(CheckDeposited → (F CheckCleared)) which specifies that every check deposited at a bank branch must eventually clear.
Templeton and Levitt [27] propose a requires/provides model for attacks. The model links atomic attacks into scenarios, with earlier atomic attacks supplying the prerequisites for the later ones. Templeton and Levitt point out that relating seemingly innocuous system behavior to known attack scenarios can help discover new atomic attacks. However, they do not consider combining their attack scenarios into attack graphs.
Cuppens and Ortalo [7] propose a declarative language (LAMBDA) for specifying attacks in terms of pre- and post-conditions. LAMBDA is a superset of the simple language we used to model attacks in our work. The language is modular and hierarchical; higher-level attacks can be described using lower-level attacks as components. LAMBDA also includes intrusion detection elements. Attack specifications includes information about the steps needed to detect the attack and the steps needed to verify that the attack has already been carried out. Using a database of attacks spec-ified in LAMBDA, Cuppens and Miege [6] propose a method for alert correlation based on matching post-conditions of some attacks with pre-conditions of other attacks that may follow. In effect, they exploit the fact that alerts about attacks are more likely to be related if the corresponding attacks can be a part of the same attack scenario.
Dacier [9] proposes the concept of privilege graphs. Each node in the privilege graph represents a set of privileges owned by the user; edges represent vulnerabilities. Privilege graphs are then explored to construct attack state graphs, which represents different ways in which an intruder can reach a certain goal, such as root access on a host. He also defines a metric, called the mean effort to failure or METF, based on the attack state graphs. Orlato et al. describe an experimental evaluation of a framework based on these ideas [18]. At the surface, our notion of attack graphs seems similar to the one proposed by Dacier. However, as is the case with Phillips and Swiler, Dacier takes an “attack-centric” view of the world. As pointed out above, our attack graphs are more general. From the experiments conducted by Orlato et al. it appears that even for small examples the space required to construct attack state graphs becomes prohibitive. By basing our algorithm on model checking we take advantage of advances in representing large state spaces and can thus hope to represent large attack graphs.
Ritchey and Ammann [20] also use model checking for vulnerability analysis of networks. They use the (unmod-ified) model checker SMV [24]. They can obtain only one counterexample, i.e., only one attack corresponding to an unsafe state. In contrast, we modified the model checker NuSMV to produce attack graphs, representing all possible attacks. We also described post-facto analyses that can be performed on these attack graphs. These analysis techniques cannot be meaningfully performed on single attacks.
Graph-based data structures have also been used in network intrusion detection systems, such as NetSTAT [28]. There are two major components in NetSTAT: a set of probes placed at different points in the network and an analyzer. The analyzer processes events generated by the probes and generates alarms by consulting a network fact base and a scenario database. The network fact base contains information (such as connectivity) about the network being mon-itored. The scenario database has a directed graph representation of various atomic attacks. For example, the graph corresponding to an IP spoofing attack shows various steps that an intruder takes to mount that specific attack. The authors state that “in the analysis process the most critical operation is the generation of all possible instances of an attack scenario with respect to a given target network.”
Ammann et. al. present a scalable attack graph representation [1]. They encode attack graphs as dependencies among exploits and security conditions, under the assumption of monotonicity. Informally, monotonicity means that no action an intruder can take interferes with the intruder’s ability to take any other actions. The authors treat vul-nerabilities, intruder access privileges, and network connectivity as atomic boolean attributes. Actions are treated as atomic transformations that, given a set of preconditions on the attributes, establish a set of postconditions. In this model, monotonicity means that (1) once a postcondition is satisfied, it can never become “unsatisfied,” and (2) the negation operator cannot be used in expressing action preconditions.
The authors show that under the monotonicity assumption it is possible to construct an efficient (low-order poly-nomial) attack graph representation that scales well. They present an efficient algorithm for extracting minimal attack scenarios from the representation, and suggest that a standard graph algorithm can produce a critical set of actions that disconnects the goal state of the intruder from the initial state.
This approach is less general than our treatment of attack graphs. In addition to the monotonicity requirement, it can handle only simple safety properties. Further, the compact attack graph representation is less explicit, and therefore
harder for a human to read. The advantage of the approach is that it has a worst-case bound on the size of the graph that is polynomial in the number of atomic attributes in the model, and therefore can scale better than full-fledged model checking to large networks.
9
Future Work
We are now producing scenario graphs so large that humans have a hard time interpreting them. We plan to address the problem of size in several ways:
– Apply optimization techniques from the model checking literature to reduce the size of scenario graphs. For exam-ple, we can use symmetry and partial-order reduction techniques. One open problem is what a set of “all counterex-amples” means when using the counterexample-guided-abstraction-and-refinement model checking technique. – Find ways to compress either or both the internal representation of the scenario graph and the external one
dis-played to the user.
• One novel approach we took was to apply the Google PageRank algorithm to the graphs we produce [16]. We use the in-degree and out-degree of a node in the graph as an estimate of how likely an attacker is to visit a state in a given attack, i.e., path in the graph.
• Rather than generate the entire scenario graph, we could do “query-directed” scenario graph generation. An example query might be “What are all paths in the scenario graph that involve a particular action?” For attack graphs, the system administrator might want to see subgraphs involving a particular host, service, or intrusion detection system. We could use such queries to reduce the graph that is then displayed to the user.
– Design and implement new graph-based analyses on scenario graphs. The minimization analysis discussed in 6.2 is only the tip of the iceberg. We would like to explore more such analyses for scenario graphs in general. We are also interested in pursuing further uses of attack graphs, e.g., in using them in conjunction with on-line intrusion detection systems and in using them to help with alert correlation. One potential approach is to use the edit-distance algorithm (e.g., used on DNA sequences) to match an abstraction of a sequence of alerts with a subpath of some attack in an attack graph [10]. The closer the match, the higher the likelihood that the alerts signal a real attack.
Finally, we are interested in exploring applications of scenario graphs to other domains. The model checking al-gorithms we present for producing all counterexamples are both extremely general. Model checkers, which produce a single counterexample, are already used for a broad range of applications, including hardware design, software de-bugging, embedded systems verification, program analysis, e-commerce, authentication protocols, and computational biology. We leave for future work what the analogue of “all counterexamples” means in these and other applications.
Acknowledgments
Oleg Sheyner deserves all the credit for the technical contributions summarized in this chapter. The initial idea of using model checking to produce attack graphs is due to my collaboration with Somesh Jha.
All the ideas in this chapter can be found in greater detail in Oleg Sheyner’s doctoral dissertation [21]. Portions of his dissertation have appeared in conference and journal papers [15, 22, 14, 13, 23, 29]. This chapter draws largely from Wing’s summary paper [29] and Sheyner and Wing’s conference paper [23]; specific sections are reprinted in part from: (1) Jeannette M. Wing, “Scenario Graphs Applied to Security (Extended Abstract),” Verification of
Infinite-State Systems with Applications to Security, E. Clarke, M. Minea, and F.L. Tiplea, editors, IOS Press, copyright 2006,
pp. 229–234, with permission from IOS Press; and (2) Oleg Sheyner and Jeannette M. Wing, “Tools for Generating and Analyzing Attack Graphs,” Formal Methods for Components and Objects, Second International Symposium, FMCO 2003, Leiden, The Netherlands, November 2003, Frank S. de Boer, Marcello M. Bonsangue, Susanne Graf, and Willem-Paul de Roever, editors, Lecture Notes in Computer Science 3188, Springer-Verlag Berlin Heidelberg copyright 2004, pp. 344–371, Figures 2-7, with kind permission of Springer Science and Business Media.
This research is sponsored in part by the Army Research Office under contract no. DAAD190110485 and DAAD19-02-1-0389, the National Science Foundation under grant no. CCR-0121547 and CNS-0433540, and the Software En-gineering Institute through a US government funding appropriation.
The views and conclusions contained herein are those of the authors and should not be interpreted as necessarily representing the official policies or endorsements, either expressed or implied, of the sponsoring institutions, the US Government or any other entity.
References
1. Paul Ammann, Duminda Wijesekera, and Saket Kaushik, “Scalable, Graph-Based Network Vulnerability Analysis,” Proceed-ings of the 9th ACM Conference on Computer and Communications Security, 2002, pp. 217–224.
2. G. Ausiello, A. DAtri, and M. Protasi. “Structure preserving reductions among convex optimization problems,” Journal of Computational System Sciences (JCSS), 21, 1980, pp. 136–153.
3. Randal E. Bryant, “Graph-based algorithms for boolean function manipulation,” IEEE Transactions on Computers, C-35(8):677–691, August 1986.
4. Edmund M. Clarke, Orna Grumberg, and Doron Peled, Model Checking, MIT Press, 2000.
5. Thomas H. Cormen, Charles E. Leiserson, Ronald L. Rivest, and Clifford Stein, Introduction to Algorithms, second edition, MIT Press and McGraw-Hill, 2001.
6. Frederic Cuppens and Alexandre Miege, “Alert Correlation in a Cooperative Intrusion Detection Framework,” Proceedings of the23rdIEEE Symposium on Security and Privacy, May 2002.
7. Frederic Cuppens and Rodolphe Ortalo, “LAMBDA: A Language to Model a Database for Detection of Attacks,” Proceedings of the Third International Workshop on the Recent Advances in Intrusion Detection (RAID), LNCS 1907, Springer-Verlag, 2000, pp. 197–216.
8. Common Vulnerabilities and Exposures, http://www.cve.mitre.org.
9. M. Dacier, “Towards Quantitative Evaluation of Computer Security,” Ph.D. Thesis, Institut National Polytechnique de Toulouse, December 1994.
10. Oren Dobzinski, “Alert Abstraction Using Attack Graphs,” Master’s Project, Department of Electrical and Computer Engineer-ing, Carnegie Mellon University, May 2006.
11. Rob Gerth, Doron Peled, Moshe Y. Vardi, and Pierre Wolper, “Simple on-the-fly automatic verification of linear temporal logic,” Proceedings of the 6th Symposium on Logic in Computer Science, Amsterdam, July 1991, pp. 406–415.
12. Gerald J. Holzmann, The Spin Model Checker: Primer and Reference Manual, Addison-Wesley, 2004. http://www.spinroot.com/spin/whatispin.html.
13. Todd Hughes and Oleg Sheyner, “Attack Scenario Graphs for Computer Network Threat Analysis and Prediction,” Complexity, 9(2):15–18, November/December 2003.
14. Somesh Jha, Oleg Sheyner, and Jeannette M. Wing, “Minimization and Reliability Analysis of Attack Graphs,” Proceedings of the Computer Security Foundations Workshop, Nova Scotia, June 2002, pp. 49–63.
15. Somesh Jha and Jeannette M. Wing, “Survivability Analysis of Networked Systems,” Proceedings of the International Confer-ence on Software Engineering, Toronto, May 2001.
16. V. Mehta, C. Bartzis, H. Zhu, E.M. Clarke, and J.M. Wing, “Ranking Attack Graphs,” Proceedings of Recent Advances in Intrusion Detection, Hamburg Germany, Sept. 20-22, 2006.
17. NuSMV: A New Symbolic Model Checker, http://afrodite.itc.it:1024/ nusmv/.
18. R. Ortalo, Y. Deswarte, and M. Kaaniche, “Experimenting with Quantitative Evaluation Tools for Monitoring Operational Security,” IEEE Transactions on Software Engineering, vol. 25, no. 5, September/October 1999, pp. 633–650.
19. C.A. Phillips and L.P. Swiler, “A Graph-Based System for Network Vulnerability Analysis,” New Security Paradigms Work-shop, 1998, pp. 71–79.
20. R.W. Ritchey and P. Ammann, “Using model checking to analyze network vulnerabilities,” Proceedings of the IEEE Symposium on Security and Privacy, May 2001, pp. 156–165.
21. Oleg Sheyner, “Scenario Graphs and Attack Graphs,” CMU Computer Science Department technical report CMU-CS-04-122, Ph.D. dissertation, April 2004.
22. Oleg Sheyner, Joshua Haines, Somesh Jha, Richard Lippman, and Jeannette M.Wing, “Automated Generation and Analysis of Attack Graphs,” Proceedings of the IEEE Symposium on Security and Privacy, Oakland, CA, May 2002.
23. Oleg Sheyner and Jeannette M. Wing, “Tools for Generating and Analyzing Attack Graphs,” Proceedings of Formal Methods for Components and Objects, Lecture Notes in Computer Science 3188, 2004, pp. 344–371.
24. SMV: A Symbolic Model Checker, http://www.cs.cmu.edu/ modelcheck/.
25. L.P. Swiler, C. Phillips, D. Ellis, and S. Chakerian, “Computer-attack graph generation tool,” Proceedings of the DARPA Information Survivability Conference and Exposition, June 2000.
26. R.E. Tarjan, “Depth first search and linear graph algorithms,” SIAM Journal of Computing, 1(2):146–160, June 1972. 27. Steven Templeton and Karl Levitt, “A Requires/Provides Model for Computer Attacks,” Proceedings of the New Security
28. G. Vigna and R.A. Kemmerer, “NetSTAT: A Network-based Intrusion Detection System,” Journal of Computer Security, vol. 7, no. 1, 1999.
29. Jeannette M. Wing, “Scenario Graphs Applied to Security (Extended Abstract),” Verification of Infinite-State Systems with Applications to Security, editors E. Clarke, M. Minea, and F.L. Tiplea, IOS Press, 2006, pp. 229–234.
Critical Action
Non-Critical Action