Introduction
Breast cancer is the leading cancer diagnosis and second-lead-ing cause of cancer death for women in the United States (1). Patient prognosis is determined largely by stratification based on age, lymph node involvement, tumor grade, and tumor cell-surface expression of estrogen receptor (ER), progesterone receptor (PR), and human epidermal growth factor receptor 2 (HER2) (2–7). Early diagnosis and targeted therapies, both hor-monal and immunologic, are critical for the effective treatment of ER-, PR-, and HER2-positive disease. Given the lack of tar-geted therapies for patients whose tumors do not express ER, PR, and HER2, termed triple-negative breast cancers, the sur-vival benefit from recent therapeutic advances has eluded this group of patients. This is especially important for clinicians and patients, as triple-negative tumors present with higher grade at diagnosis and an increased incidence for disease relapse, early metastasis, and death (8–11).
Transcriptome profiling has defined 5 intrinsic molecular subtypes of breast cancer: luminal A, luminal B, HER2 enriched, basal-like, and claudin-low (12, 13). The basal-like and claudin-low
subtypes are distinguished by increased expression of genes asso-ciated with tumor cell proliferation and adaptive and innate immu-nity (14, 15). Claudin-low tumors are further separated from bas-al-like tumors by their decreased expression of cell-cell adhesion claudin proteins, increased expression of genes associated with epidermal-to-mesenchymal transition, and stem cell–like charac-teristics (16). Importantly, basal-like and claudin-low tumors make up the majority of triple-negative tumors and have a significantly poorer prognosis than luminal and HER2-enriched tumors (17).
In addition to tumor-intrinsic genetic features, tumor growth is dependent on tumor-extrinsic factors, which include the tumor stroma and the local immune response (14, 18). Tumor-infiltrating lymphocytes (TILs)can have divergent effects in the tumor micro-environment (TME). Whereas the presence of multiple immune cell types may herald productive antitumor immunity (15), TILs may also contribute to tumor progression through immune sup-pression or the production of soluble factors that regulate cell pro-liferation, migration, and angiogenesis (19).
While the presence of TILs is associated with an improvement in the survival of patients with multiple different tumor subtypes, this has not been found for specific subtypes of breast cancer. The luminal A subtype, which exhibits no appreciable immune infiltra-tion, carries the best prognosis, whereas the basal-like and clau-din-low subtypes exhibit a marked immune infiltrate with worse clinical outcomes (20). In this study, we sought to understand the mechanism by which immune infiltration is associated with poor clinical outcomes for patients with claudin-low tumors.
Claudin-low breast cancer is an aggressive subtype that confers poor prognosis and is found largely within the clinical triple-negative group of breast cancer patients. Here, we have shown that intrinsic and immune cell gene signatures distinguish the claudin-low subtype clinically as well as in mouse models of other breast cancer subtypes. Despite adaptive immune cell infiltration in claudin-low tumors, treatment with immune checkpoint inhibitory antibodies against cytotoxic T lymphocyte– associated protein 4 (CTLA-4) and programmed death receptor 1 (PD-1) were ineffective in controlling tumor growth. CD4+FoxP3+ Tregs represented a large proportion of the tumor-infiltrating lymphocytes (TILs) in claudin-low tumors, and Tregs isolated from tumor-bearing mice were able to suppress effector T cell responses. Tregs in the tumor microenvironment highly expressed PD-1 and were recruited partly through tumor generation of the chemokine CXCL12. Antitumor efficacy required stringent Treg depletion combined with checkpoint inhibition; delays in tumor growth were not observed using therapies that modestly diminished the number of Tregs in the tumor microenvironment. This study provides evidence that the recruitment of Tregs to the tumor microenvironment inhibits an effective antitumor immune response and highlights early Treg recruitment as a possible mechanism for the lack of response to immune checkpoint blockade antibodies in specific subtypes of cancer that are heavily infiltrated with adaptive immune cells.
Treg depletion potentiates checkpoint inhibition
in claudin-low breast cancer
Nicholas A. Taylor,1 Sarah C. Vick,1,2 Michael D. Iglesia,3 W. June Brickey,1,2 Bentley R. Midkiff,1 Karen P. McKinnon,1,2 Shannon Reisdorf,1 Carey K. Anders,1,4 Lisa A. Carey,1,4 Joel S. Parker,1,3 Charles M. Perou,1,3
Benjamin G. Vincent,1,4,5 and Jonathan S. Serody1,2,4
1Lineberger Comprehensive Cancer Center, 2Department of Microbiology and Immunology, 3Department of Genetics, 4Department of Medicine, and 5Curriculum in Bioinformatics and Computational Biology, University of North Carolina (UNC), Chapel Hill, North Carolina, USA.
Authorship note: N.A. Taylor and S.C. Vick are co–first authors. B.G. Vincent and J.S. Serody are co–senior authors.
Conflict of interest: The authors have declared that no conflict of interest exists.
Submitted: September 6, 2016; Accepted: July 11, 2017.
Results
Claudin-low tumors show increased expression of immune genes rela-tive to other intrinsic subtypes of breast cancer. The original
microar-ray used to classify the intrinsic subtypes of breast cancer includ-ed over 1,700 genes (21, 22), with an emphasis on cell-intrinsic transcriptional characteristics. We were interested in determining whether there were cell-extrinsic transcriptional differences that could be used to classify breast cancer subtypes. For this analysis, we evaluated the expression of 102 immune genes that encom-pass downstream effector molecules, chemokines and chemok-ine receptors, immune response signal mediators, cell-specific markers, and markers of oxidative stress, termed the intrinsic immune genes (IIGs) (Supplemental Table 1; supplemental mate-rial available online with this article; https://doi.org/10.1172/ We show that patients with claudin-low tumors have an increased
number of CD4+ T cells with focal increases in Tregs in the TME
com-pared with other intrinsic subtypes. To understand the mechanism for this, the p53–/– T11 and T12 genetically engineered mouse models
(GEMMs) were used, which closely recapitulated the cell-intrinsic and -extrinsic characteristics of human claudin-low breast cancer. In human and mouse studies, gene expression profiling revealed increased expression of immune genes and Treg-associated genes in the claudin-low subtype. Importantly, checkpoint inhibition was found to be effective for claudin-low tumors only when combined with stringent Treg depletion. Taken together, these experiments highlight the role of Tregs in suppressing the immune response in claudin-low breast tumors and provide an understanding of the dif-ferential response to immune checkpoint inhibition in breast cancer.
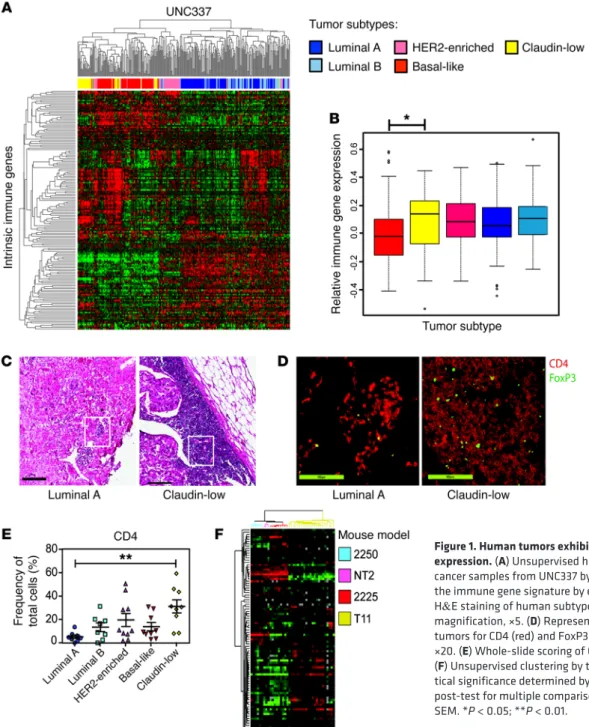
Figure 1. Human tumors exhibit differential immune gene expression. (A) Unsupervised hierarchical clustering of breast cancer samples from UNC337 by IIG list. (B) Overall expression of the immune gene signature by each subtype. (C) Representative H&E staining of human subtype–specific breast cancer. Original magnification, ×5. (D) Representative IF staining of human tumors for CD4 (red) and FoxP3 (green). Original magnification, ×20. (E) Whole-slide scoring of CD4+ infiltrate for each subtype.
very high expression in T11 tumors (claudin-low). We generated a cell line from T11 tumors to standardize claudin-low tumor growth in vivo. Gene expression profiling of these tumors showed that the parental T11 tumor and tumors derived from injection of the T11 cell line clustered tightly together within the claudin-low subtype, demonstrating that the T11 cell line is genetically quite similar to T11 tumor cells (Supplemental Figure 2).
Claudin-low tumors recruit increased numbers of immune cells to the tumor. Tumors representing the subtypes luminal A, HER2/Neu,
and claudin-low were studied in GEMMs to evaluate the immune response during tumor progression. In order to evaluate both ear-ly and late time points, tumors were harvested at approximateear-ly 20 mm2 (Figure 2, A–D) or 100 mm2 (Figure 2, E–H), respectively, and
analyzed by flow cytometry to determine the composition of TILs over time. FACS analysis work flows are shown in Supplemental Figure 3, and representative FACS plots are shown in Supplemen-tal Figure 4. The toSupplemen-tal number of immune cells was significantly increased in T11 claudin-low tumors (Figure 2, A–H). Specifical-ly, the number, but not the frequency, of CD4+FoxP3– T cells was
increased in the TME in both 20-mm2 and 100-mm2 tumors (Figure
2, A and E). Interestingly, we found an increase in the number of Tregs both at 20 mm2 and 100 mm2 in the T11 claudin-low model.
There was a statistically significant increase in the number of CD19+
B cells in mice, with 20 mm2 T11 claudin-low compared with Neu
tumors, and a significant increase in B cells in mice with 100 mm2
T11 tumors compared with luminal A tumors (Figure 2, C and G). Additionally, we found very few CD8+ T cells in the TME of mice
with either luminal A– or Neu-expressing tumors. There was a sta-tistically significant increase in the number and frequency of CD8+
T cells in mice with 20-mm2 and 100-mm2 claudin-low tumors
(Figure 2, B and F). There was an inverse correlation between the presence of Tregs and diminished number of both CD8+ T cells and
CD19+ B cells (Figure 2, I and J). To confirm our results were not
specific to the T11 cell line, we utilized an additional claudin-low tumor cell termed T12 to examine immune infiltration into the TME at late-stage tumor growth. We found an increase in Tregs in mice with 100 mm2 tumors in the T12 model, although the increase
was not significant. We investigated the activation status of the cells migrating into the TME by looking at naive and memory T cell pop-ulations (Supplemental Figure 5). Compared with luminal A– and Neu-expressing tumors, the T11 and T12 claudin-low tumors had increased effector memory cells in both the CD4+FoxP3– and CD8+
T cell populations. (Supplemental Figure 5, B and D). Thus, these data indicated that there was a significant difference in the popula-tion of immune cells in the TME in mouse luminal A, Neu-express-ing, or claudin-low tumors. Additionally, our data suggest that the early presence of Tregs was associated with diminished numbers of CD8+ T cells and B cells in mice with claudin-low tumors.
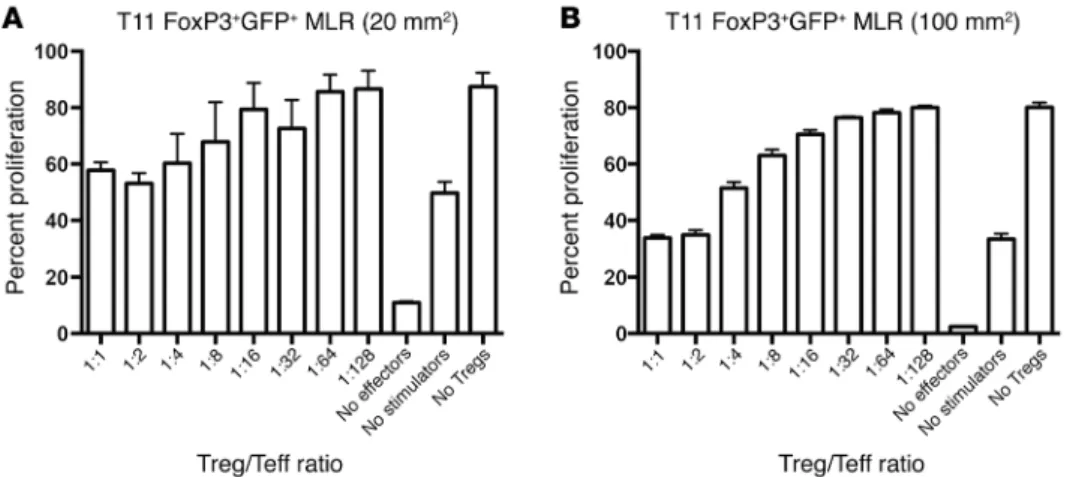
Tregs in mice with tumors show enhanced suppression and chemok-ine production. Next, we evaluated whether the Tregs isolated from
tumor-bearing mice were efficient at suppressing T cell responses. As shown (Figure 3, A and B), Tregs were capable of suppressing T cell proliferation in a mixed lymphocyte reaction assay. At high ratios of Treg/T effector cells (Teffs), Tregs were more effective when isolated from mice with 100-mm2 compared with 20-mm2
tumors. Thus, tumor-bearing mice have functional Tregs that dis-play enhanced suppression in mice with larger tumors.
JCI90499DS1). Gene expression profiling by microarray analysis was done on 337 breast tumors as previously described (23). Unsu-pervised hierarchical clustering of UNC337 by only those genes in the IIG list divided patients into 3 clusters: low-expressing lumi-nal, moderate-expressing HER2 enriched, and high-expressing basal-like and claudin-low tumors (Figure 1A). By gene expression signature quantification, HER2-expressing tumors had signifi-cantly lower immune gene expression than claudin-low tumors (P < 0.05) (Figure 1B). Furthermore, claudin-low tumors showed significantly increased expression of a gene signature associated with Treg activity (P = 0.001, data not shown).
To confirm these findings, we performed transcriptome eval-uation using the IIG classifier from a previous published breast cancer database (Molecular Taxonomy of Breast Cancer Inter-national Consortium [METABRIC]; http://www.cbioportal.org/ study?id=brca_metabric#summary), as the stringency filter for tumor purity eliminated the inclusion of claudin-low tumors from the TCGA database (https://cancergenome.nih.gov/). Unsu-pervised hierarchical clustering of the METABRIC data by only those genes in the IIG list revealed that clinical breast cancer sam-ples divided into 3 clusters: low-expressing luminal, moderate- expressing HER2 enriched, and high-expressing basal-like and claudin-low tumors similar to what was shown in the UNC337 data (Supplemental Figure 1). The claudin-low subtype had a sig-nificantly increased immune gene expression compared with the other subtypes in the METABRIC data set (P < 0.0001).
Claudin-low breast tumors show increased infiltration by CD4+
cells. In order to determine whether IIG expression was associated
with differences in Th cells, Tregs, or cytotoxic T cells (Tc cells), patient biopsy samples were studied by histology and immunoflu-orescence (IF). Figure 1C shows H&E stains of the greatest area of immune infiltration of a representative luminal A and claudin-low tumor. Tumor tissue slides were analyzed for Tc cells (CD8+),
Th cells (CD4+FoxP3-), and Tregs (CD4+FoxP3+). Representative
images of CD4 and FoxP3 IF staining from the highlighted areas shown in Figure 1C demonstrate CD4+FoxP3+ cell infiltration
into the tumor (Figure 1D). Claudin-low tumors recruited signifi-cantly more CD4+ T cells to the tumor site than luminal A tumors
(P = 0.002; Figure 1E), with areas of focally increased num-bers of Tregs (Figure 1D). No differences in the number of CD8+
T cells were found across the different intrinsic subtypes (data not shown). These data indicate the heterogeneity of the immune response in breast cancer subtypes, with claudin-low tumors hav-ing a significantly increased T cell infiltrate (P < 0.01) with focally increased numbers of Tregs. In contrast, luminal tumors showed an extremely limited number of CD8+ and/or CD4+ T cells.
Claudin-low GEMMs closely recapitulate human claudin-low breast cancer. Given the difficulties with standardizing tumor
Figure 2. T11 and T12 (claudin-low) tumors recruit elevated numbers of immune cells to the tumor site. WT mice were injected with 1 × 10⁶ 2250 tumor
cells or 1 × 10⁴ T11 or T12 cells. Neu-N mice were injected with 5 × 10⁴ NT2 cells. Tumors were harvested at 20 mm2 (2250, n = 9; NT2, n = 10; T11, n = 12) (A–D)
or 100 mm2 (2250, n = 10; NT2, n = 5; T11, n = 10; T12, n = 6) (E–H), digested, enriched for lymphocytes, and analyzed by FACS. (A) CD4+ TILs, 20 mm2. (B)
CD8+ TILs, 20 mm2. (C) CD19+ TILs, 20 mm2 (2250, n = 4). (D) CD4+FoxP3+ TILs, 20 mm2. (E) CD4+ TILs, 100 mm2. (F) CD8+ TILs, 100 mm2. (G) CD19+ TILs, 100
mm2. (H) CD4+FoxP3+ TILs, 100 mm2. (I) Correlation between the percentage of CD8+ T cells and FoxP3+CD4+ T cells in mice with 20 mm2 T11 tumors. n = 16
mice. (J) Correlation between CD19+ B cells and FoxP3+CD4+ T cells in T11 mice with 20 mm2 tumors. n = 16 (taken from the same group as evaluated in I).
However, and unexpectedly, FACS analysis of the immune cells infiltrating the tumor showed that Tregs had the highest levels of PD-1 and CTLA-4 expression, as measured by FACS mean fluores-cence intensity (MFI) (Figure 6, A–D).
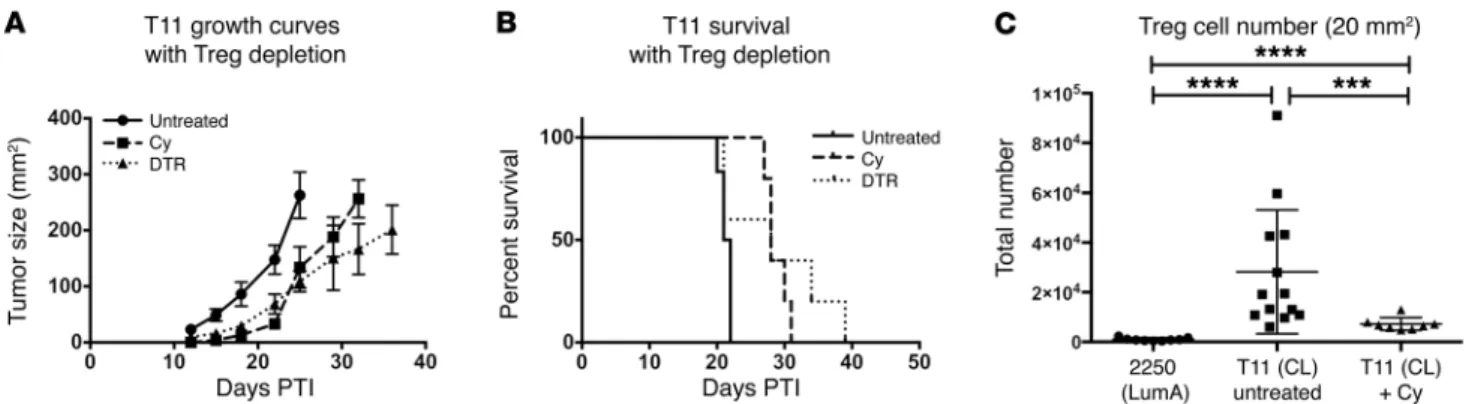
Depletion of Tregs delays T11 tumor growth. The inverse
correla-tion between the presence of Tregs and the absence of CD8+ T cells
and CD19+ B cells in the TME (Figure 2, I and J) led us to
hypoth-esize that approaches that target Tregs would enhance the antitu-mor immune response. To deplete Tregs, we made use of mice in which the diphtheria toxin (DT) receptor had been knocked in to the FoxP3 locus (DEREG mice) and treated with DT to specifically deplete Tregs in vivo. DEREG mice given DT exhibited a signifi-cant delay in tumor growth and a nonsignifisignifi-cant improvement in survival (Figure 7, A and B), with all mice eventually succumbing to either autoimmunity or tumor. As an alternative nongenetic approach to treatment, tumor-bearing WT mice received a single treatment of low-dose (100 mg/kg) cyclophosphamide (Cy) to selectively deplete Tregs (25). As with DT treatment of DEREG mice, a single injection of low-dose Cy significantly delayed tumor growth (Figure 7, A and B), but again, all mice eventually succumbed to death upon tumor administration. While Treg num-bers were decreased compared with those in untreated T11 tumors after Cy, they had increased to above baseline by the time tumors reached 20 mm2 (Figure 7C). Thus, Treg depletion alone appeared
to modestly affect tumor growth.
Depletion of Tregs plus checkpoint inhibition improved survival and increased cytokine production by CD8+ T cells. While depleting Tregs delayed tumor growth, we evaluated whether addition of checkpoint inhibition therapy would enhance the benefit. Giv-en the finding that blocking CXCR4 had a modest effect on the recruitment of Tregs in T11 tumors, we initially evaluated wheth-er combining checkpoint inhibition with AMD3100 would have an impact on tumor growth. There were no synergistic effects between CXCR4 inhibition and checkpoint inhibition, as we found no difference in tumor growth using combined checkpoint inhibi-tion and control treatment or AMD3100 (Supplemental Figure 7, A and B). Mice receiving AMD3100 had a reduction in Tregs 12 days after the onset of treatment (Supplemental Figure 7, C and D), but by day 16, the reduction in infiltrating immune cells was no longer specific to Tregs, as we saw a reduction in CD4+ and CD8+ T cells
(Supplemental Figure 7, E and F). When combined with check-point inhibition, all cell subsets were significantly reduced in the To determine what mediators were responsible for recruiting
Tregs to the claudin-low tumor site, we compared gene expres-sion differences between Neu-expressing and claudin-low tumors (Figure 4A). T11 tumors expressed significantly higher levels of multiple chemokines, with CXCL12 being 22-fold higher in these tumors compared with Neu-expressing tumors (95% CI: 17.1 – 28.3;
P < 0.001). ELISA of tumor homogenate for CXCL12 confirmed the
array findings, with claudin-low tumors expressing higher levels of CXCL12 protein than Neu-overexpressing tumors (Figure 4B). Elevated levels of CXCL12 protein were also found in the serum of claudin-low tumor-bearing mice (Figure 4C). Tregs that infiltrate T11 tumors demonstrated higher expression levels of CXCR4, a receptor for CXCL12, compared with conventional CD4+ T cells
(P = 0.03) or CD8+ T cells (P = 0.003; Figure 4, D and E).
To evaluate whether the CXCL12/CXCR4 axis was critical to the recruitment of Tregs in mice with claudin-low tumors, mice were treated with the CXCR4 inhibitor AMD3100. There was a trend toward decreased Treg numbers in AMD3100-treated mice (Figure 5A), which was greater when comparing the number of FoxP3+PD-1+ Tregs, where PD-1 indicates programmed death
receptor 1 (P = 0.07) (Figure 5B). To further evaluate whether the CXCL12/CXCR4 axis was critical to the recruitment of Tregs, shRNA knockdown of CXCL12 was achieved by lentiviral expres-sion of CXCL12-targeted shRNA into T11 tumor cells. (Figure 5, C and D). We generated 2 cell lines, one with a 55% knockdown of CXCL12 (KD1) and one with an 85% knockdown (KD5). There was a nonsignificant reduction in both Tregs and PD-1+ Tregs in
the TME using the more robust knockdown of CXCL12 at day 13 post tumor implantation (PTI) (Figure 5, E and F). Thus, these data indicate that inhibition of the CXCL12/CXCR4 axis in vivo had a modest but not significant effect on Treg accumulation in claudin-low tumors.
Checkpoint inhibition therapy does not alter T11 tumor growth.
Because of the increased number of immune cells infiltrating the tumor, we hypothesized that the T11 claudin-low model would be responsive to checkpoint inhibition therapy with blocking antibodies against the inhibitory receptors PD-1 and cytotoxic T lymphocyte–associated protein 4 (CTLA-4). Surprisingly, check-point inhibition therapy conferred no benefit on tumor growth or survival in the T11 claudin-low model (Figure 6, E and F), despite expression of PD-1 on CD8+ T cells (Figure 6A). This result was
confirmed in the T12 claudin-low model (Supplemental Figure 6).
Figure 3. FoxP3+ cells from T11 tumor– bearing mice are functionally suppres-sive. FoxP3GFP mice were injected with 5
× 104 T11 cells. GFP+FoxP3+ splenocytes
were sorted from tumor-bearing mice at (A) 20 mm2 or (B) 100 mm2 and plated
TME (Supplemental Figure 7, C–E). As a more rigorous test, Tregs were depleted using DT treatment in DEREG mice in combination with anti–CTLA-4 and anti–PD-1 monoclonal antibody treatment. Tregs were depleted from approximately 20% to 5% after DT treat-ment (Figure 8F). T11 tumor–bearing mice were followed for 25 days PTI until tumor growth reached 170 mm2 or mice developed
significant autoimmunity from Treg depletion. Treg depletion in combination with anti–PD-1 and anti–CTLA-4 therapy resulted in decreased tumor growth and significantly improved survival (P = 0.03) (Figure 8, A and B). Unfortunately, because mice treat-ed with DT developtreat-ed severe autoimmunity, we were unable to extend the tumor growth curves past 25 days PTI per institutional IACUC guidelines. We then sought to determine whether delayed tumor growth was correlated with increased cytokine production by T cells. We analyzed IFN-γ production by CD8+ T cells in both
the tumor and the spleen by FACS as a measure of productive CD8+ T cell responses. While this evaluation was limited greatly
by the significant occurrence of autoimmunity in mice treated with DT, there was a nonsignificant increase in the percentage of
CD8+ T cells that generated IFN-γ, but not in total CD8+ T cells,
in mice treated with DT that also received checkpoint inhibition therapy (Figure 8, C–E).
To circumvent the issues with autoimmunity in mice given DT treatment prior to tumor implantation, we treated a small group of mice with DT PTI. While we were limited again in the ability to generate significant numbers of DEREG mice to evaluate, there was prolonged survival until day 40 for half of the mice given DT therapy PTI (Supplemental Figure 8). Because of the autoimmu-nity associated with the use of DEREG mice, we sought a phar-macological approach to suppress Treg function in vivo. Previous work has shown that selective inhibition of the p110δ isoform of PIK3 using a small molecule inhibitor delayed 4T1 tumor growth in mice and reduced Treg suppression (26). We used the small molecule inhibitor PI-3065 in addition to checkpoint inhibition in our T11 claudin-low model. Treatment with PI-3065 was associat-ed with a statistically significant improvement in survival, with a period of tumor stability in half of the treated mice (Supplemental Figure 9, A and B). However, we were not able to mediate tumor
Figure 4. T11 tumors express high levels of CXCL12. (A) Whole-tumor RNA was isolated and analyzed using the PAMM-011 RT2 Profiler PCR Array. Gene expression is
presented relative to NT2 tumor controls. (B) Tumors were harvested on day 21 PTI, homogenized, and analyzed by CXCL12 ELISA (n = 3–4 per group). (C) Serum was har-vested on day 21 PTI and analyzed for CXCL12 ELISA (n = 3 per group). (D) Representa-tive overlay of CXCR4 expression by CD4+FoxP3+ Tregs (Treg CD4), CD4+FoxP3– T cells
(Non-Treg CD4), and CD8+ T cells. (E) MFI values for the expression of CXCR4 from TILs
isolated from mice with 20 mm2 T11 tumors (n = 6). Statistical significance was
regression or affect overall survival. Treatment with PI-3065 and checkpoint therapy did significantly reduce the number of Tregs infiltrating into the tumor (Supplemental Figure 8C). However, it also led to a reduction in the number of CD4+ FoxP3-negative
T cells accumulating in the TME.
Discussion
Triple-negative breast cancer has the worst prognosis of the his-tologic subtypes due to presenting at higher grade at diagnosis, increased recurrence risk following treatment, and shortened time to metastasis (27). The paradoxical observation that the molecular subtypes comprising these tumors also exhibit high
lev-els of immune cell infiltration suggests that these infiltrating cells may have a deleterious impact on patient outcome. Our study sup-ports this conclusion for claudin-low breast cancer. Clustering by the IIG alone was sufficient to separate triple-negative basal-like and claudin-low tumors from luminal tumors and HER2- enriched tumors. This finding was not due to aberrant gene expression by tumor cells, but to increased immune cell infiltration into the tumor, especially CD4+ T cells. These results are in contrast
with those in prior studies where numbers of TILs were found to be favorably prognostic in breast cancer (5). Importantly, these studies did not stratify breast tumors by molecular subtype, high-lighting that the significance of the immune infiltrate may vary
Figure 5. Role of CXCL12/CXCR4 path-way in Treg infiltration into claudin-low tumors. (A and B) WT mice were implanted on day –2 with osmotic pumps loaded with PBS or 10 mg AMD3100 in PBS (n = 7 per group) and challenged with 1 × 10⁴ T11 cells.
Tumors were harvested on day 12 PTI and FACS analyzed. (A) Percentage and number of CD4+FoxP3+ TILs. (B) Percentage and
number of CD4+FoxP3+PD-1+ TILs. (C) T11
cell line was transfected with lentiviral-ex-pressing CXCL12-targeted shRNA, and (D) CXCL12 knockdown was confirmed using CXCL12 ELISA. (E and F) WT mice were injected with 1 × 10⁴ cells of WT, scramble,
or knockdown (KD) lines (n = 5 per group). Tumors were harvested on day 13 PTI and FACS analyzed. (E) Percentage and number of CD4+FoxP3+ TILs. (F)
Percent-age and number of CD4+FoxP3+PD-1+ TILs.
Tregs dominated the immune response, which was associated with diminished numbers of CD19+ B cells and CD8+ T cells. Thus, there
may be a critical early period when tumors can recruit sufficient numbers of Tregs to abrogate a functional adaptive immune response.
We sought to determine the mechanism that accounts for the preferential recruitment of Tregs to claudin-low tumors. CXCL12, a chemokine critical for the homing of hemato-poietic stem cells (32), was expressed in mice 22-fold more with claudin-low compared with Neu tumors. Further, Tregs that infiltrated claudin-low tumors expressed high levels of CXCR4, one of the receptors for CXCL12. Inhi-bition of CXCR4 with AMD3100 demonstrat-ed a modest role for this axis in Treg recruit-ment. AMD3100-treated mice demonstrated a trend for decreased Treg numbers in the tumor compared with controls, which contained elevated PD-1+ Tregs.
However, the modest decrease in the recruitment of Tregs found using AMD3100 was not sufficient to augment the antitumor immune response using checkpoint inhibitor therapy, in part because exposure to AMD3100 also diminished the recruitment of CD4+ non-Tregs and CD8+ T cells to the TME. Similarly,
selec-tive inhibition of p110δ isoform of PI3K using a small molecule inhibitor plus checkpoint inhibition reduced the number of Tregs, which was associated with a significant (P < 0.05) improvement in tumor growth compared with that in control mice receiving checkpoint inhibition alone. Unfortunately, this combination did not result in tumor regression or enhanced overall survival. Our data suggest that robust and specific Treg depletion is necessary to engender an effective antitumor response. This level of depletion in our mouse studies was associated with profound autoimmunity. Thus, it is not clear whether prolonged, robust Treg depletion in patients could be tolerated to enhance checkpoint inhibitor thera-py for the treatment of claudin-low tumors.
The function of PD-1 on the surface of Tregs is not entirely known (33, 34). PD-1hi Tregs in the TME in glioma patients have
been found to be exhausted, yet capable of generating proinflam-matory cytokines, such as IFN-γ (35). This suggests that one mech-anism for the impaired function of anti–PD-1 antibody therapy is the presence of PD-1–expressing Tregs that can (a) bind antibody widely by subtype. The use of mouse models that mimic human
tumor biology is critical for finding pathways important for tumor pathogenesis and potential. The GEMMs utilized by our laborato-ry are derived from and studied in immunocompetent mice that recapitulate tumor biology at the genetic and whole tumor level. As expected by similarity to the human patient samples, murine tumors exhibited substantial differences in immune cell infiltra-tion based on intrinsic subtype.
Recently, there has been intense interest in biomarkers of response to checkpoint inhibitor therapy. One stratification that has been proposed for patients with melanoma is immune- excluded versus immune-infiltrated tumors, with data suggesting that checkpoint inhibition is not effective in immune-excluded tumors (28). Our data would suggest that a third group of tumors, those that are actively immune suppressed, may also not respond to checkpoint inhibition. The presence of Tregs as a biomarker for antitumor response has been confusing, with data indicating both negative and positive clinical benefits (29–31). This may be due to the critical issue of timing in the evaluation of Tregs from the TME. In claudin-low murine tumors, Tregs made up as much as 60% of all CD4+ cells in the tumor and were present in substantial
numbers prior to the expansion of other adaptive immune cells. These cells were both functional and durable, with continued presence as the tumors grew. In many of the T11 and T12 tumors,
Figure 6. Tumor-infiltrating Tregs express increased levels of PD-1 and CTLA-4; however, PD-1 and CTLA-4 inhibition does not increase survival in T11 tumor–bearing mice. (A) Representative FACS overlay and (B) total MFI values of PD-1 expression by T11 TILs at 20 mm2. n = 4. (C) Representative FACS
overlay and (D) total MFI values of CTLA-4 expres-sion by T11 TILs at 20 mm2. n = 5. (E) Growth curves
microarrays (Agilent Technologies) (18, 19). We used the microarray data set previously published as the UNC337 data set in the NCBI’s Gene Expression Omnibus (GEO GSE18229) (4). All microarray and patient clinical data are available in the University of North Carolina Microarray Database (ref. 20; https://genome.unc.edu/cgi-bin/SMD/ publication/viewPublication.pl?pub_no=81). The probes for all analy-ses were filtered by requiring the lowest normalized intensity values in both sample and control to be greater than 10. The normalized
log2 ratios cyanine-5 (Cy5) dye intensity for experimental sample/
cyanine-3 (Cy3) dye intensity for reference of probes mapping to the same gene (EntrezGene ID as defined by the manufacturer) were averaged to generate independent expression estimates. The META-BRIC data set contains 1,981 samples derived from breast tumors of patients participating in the METABRIC trial (39). Gene expression data were acquired by Illumina HT-12.
Mouse breast tumor microarray data sets. All mouse samples from
fresh-frozen invasive breast carcinomas were analyzed as described previously, using Agilent mouse oligo microarrays (18). Data normal-ization and preprocessing were identical to those described for the UNC337 data set. We used 2 samples obtained from the combined data set previously published (GEO GSE3165, GSE8516, GSE9343, GSE14457, GSE15263, GSE17916, GSE27101, and GSE42640) (21). The remaining 57 samples represent newly obtained tumor sam-ples using methods approved by IACUC guidelines. Total RNA was purified from 20 to 30 mg of mouse mammary tumor using the QIA-GEN RNeasy Mini Kit following the manufacturer’s protocols. RNA quantity and quality were determined using the Nanodrop spectro-photometer and Agilent Bioanalyzer, respectively. Total RNA was reverse transcribed and labeled with Cy5 dye for experimental sam-ples and Cy3 dye for mouse reference samsam-ples using the Agilent Low RNA Input Fluorescent Linear Amplification Kit (18). Equal quanti-ties of labeled mouse reference RNA and tumor RNA were cohybrid-ized overnight to Agilent microarrays, washed, and scanned; signal intensities were then determined.
Microarray data analysis. Hierarchical clustering of the UNC337
data set to group samples by intrinsic subtype was performed using the intrinsic gene list as described. (22). Centroid linkage hierarchical clustering was performed using Cluster v3.0 (23). Student’s t tests for gene expression data were performed using R (24).
if PD-1 is preferentially expressed on these cells and (b) become activated in the presence of anti–PD-1 antibody. Our data requir-ing depletion of Tregs to mediate the antitumor activity of anti– PD-1 antibody therapy would be consistent with this mechanism.
In summary, we have found that claudin-low tumors are high-ly enriched with Tregs. Enhancing the immune response to these tumors by depleting Tregs in addition to immune checkpoint inhi-bition impaired tumor growth and prolonged survival, but was insufficient to mediate tumor regression. Generation of CXCL12 by the tumor cells played a modest role in the recruitment of Tregs to the tumor site. These studies suggest that future clinical trials for patients with triple-negative breast cancer should target the immunosuppressive environment generated by the tumor in com-bination with checkpoint inhibition.
Methods
Mice and cell lines. BALB/cJ and C57BL/6J (B6) females and
C.B6-Tg(-Foxp3-DTR/EGFP)23.2Spar/Mmjax (DEREG) females were purchased
from The Jackson Laboratory. Neu-N mice were purchased from Charles River Laboratory. Female mice (8 to 14 weeks) were used for all experiments. Rat Neu-expressing NT2 cells (HER2/Neu) and the 2250 (luminal A), 2225 (basal-like), and T11 (claudin-low) tumor models have been described (36–38). T12 cells were prepared by harvesting a T12 tumor from a tumor-bearing mouse, followed by manual digestion with razor blades and chemical digestion with Liberase TM (Roche) and DNase I (Sigma-Aldrich). Digestion was stopped by the addition of EDTA. The 2250 cells were prepared by harvesting a 2250 tumor from a tumor-bearing mouse, followed by manual digestion with razor blades and chemical digestion as described above. BALB/c mice were injected
with 1 × 10⁶ 2250 cells (luminal A) in Matrigel HC low-growth factor, 1 ×
104 or 1 × 10⁵ T12 (claudin-low) cells in Matrigel HC low-growth factor,
or 1 × 10⁴ T11 (claudin-low) cells in PBS. Neu-N mice were injected with
5 × 10⁴ NT2 cells (Neu) in PBS. Tumors were orthotopically
transplant-ed by intradermal injection into a mammary fat pad and measurtransplant-ed as previously described (11). Blood and serum samples were harvested by cardiac puncture at the termination of the experiment.
Human breast tumor microarray data sets. All human tumor and
normal tissue samples were obtained from fresh-frozen invasive breast carcinomas that were profiled, as described previously, using oligo
Figure 7. Treg depletion delays tumor growth in the absence of adoptive transfer. WT untreated, Cy-treated, and DEREG mice were injected with 1 × 10⁴
the Bond Polymer Refine Detection Kit (DS9800, Leica Microsys-tems). Slides were deparaffinized in Bond Dewax Solution (AR9222) and hydrated in Bond Wash Solution (AR9590). Antigen retrieval was done at 100°C either in Bond Epitope Retrieval Solution 1, pH 6.0 (AR9661), or in Solution 2, pH 9.0 (AR9640). IHC slides were
H&E and IF analyses of patient samples. Staining was performed
on tumor-infiltrating lymphocytes in 85 breast cancer whole tissue sections (WTS) obtained from UNC hospitals surgical pathology archive. IHC and dual IF on WTS with immune infiltrates were per-formed with the Bond fully automated slide-staining system using
Figure 8. Treg depletion with anti–PD-1 and anti–CTLA-4 immune checkpoint inhibition significantly delays T11 tumor growth. WT or FoxP3-DTR mice were injected with 1 × 10⁴ T11 cells. DEREG mice received 1 μg DT on days –1,
0, 6, and 7 PTI. DT + PD-1 + CTLA-4 mice received 1 μg DT on days –1, 0, 6, and 7 PTI and anti–PD-1 and anti– CTLA-4 antibody on day –1, then every other day for the duration of the experiment. Tumor growth evaluation was terminated at day 25 PTI due to autoimmune manifes-tations and tumor growth reaching an end point of 170 mm2. (A) Mice depleted of Tregs and receiving anti–PD-1
and anti–CTLA-4 (n = 3) had a significant survival benefit compared with untreated mice (n = 4) or those treated with anti–PD-1 and anti–CTLA-4 alone (n = 3) (CLTLA4 + PD-1 vs. DT + CLTLA4 + PD-1: P = 0.03; log-rank test). (B) Individual replicates of tumor growth curves. (C–E) Mice treated with anti–PD-1 and anti–CTLA-4 alone (Treg+) (n
= 3) or anti–PD-1 and anti–CTLA-4 with DT (Treg–) (n = 3).
Mice were sacrificed 25 days PTI and FACS analyzed for percentage of CD8+ T cells and IFN-γ production by CD8+
T cells in tumor and spleen. (C) Representative FACS plot of IFN-γ production by CD8+ T cells from tumor or spleen
of tumor-bearing mice. (D) Percentage of CD8+ T cells and
IFN-γ production by CD8+ T cells from tumor. (E)
Percent-age CD8+ T cells and IFN-γ production by CD8+ T cells in
spleen. (F) Percentage and total number of CD4+FoxP3+
Tregs from tumors in mice treated with anti–PD-1 and anti–CTLA-4 alone (Treg+) (n = 3) or anti–PD-1 and anti–
CTLA-4 with DT (Treg–) (n = 3). Analysis of T cell TILs was
immune checkpoint inhibition received i.p. injection of 100 μg anti–
CTLA-4 (9D9), 200 μg anti–PD-1 (J43), or isotype antibody on day –1
PTI and then every other day throughout the experiment (40, 41). Mice undergoing Treg depletion (DEREG mice) received i.p.
injec-tions of 1 μg DT in PBS on days –1, +1, +6, and +7 (27). Mice undergoing
specific inhibition of p110δ PI3K were given drug (75 mg/kg PI-3065,
once daily) or vehicle (0.5% methylcellulose with 0.2% Tween 80) by oral gavage from day +1 through the duration of the experiment (26).
Treg-suppression assay. For the Treg-suppression assays, we
eval-uated splenic Tregs. FoxP3+GFP+ cells were sorted using a MoFlo
Cell Sorter (Beckman Coulter). Stimulator cells were isolated from WT B6 splenocytes following CD90 microbead depletion (Miltenyi Biotec) and irradiation at 2,100 centigray (cGy). Responder cells were isolated from WT BALB/c mice using the Cedarlane T Recovery Column Kit. Isolated cells were then B220 and CD25 depleted using phycoerythrin-conjugated (PE-conjugated) antibodies and anti-PE magnetic bead sorting (Miltenyi Biotec). Responder cells were stained with the Cell Proliferation Dye eFluor 670 (eBioscience) and plated at varying Treg/Teff ratios. Cells were cocultured for 3 days, stained, and FACS analyzed.
Real-time PCR array. Whole tumor RNA was isolated using the
RNEasy Kit (QIAGEN) and reverse transcribed. Real-time PCR was performed on the ABI 7300 (Applied Biosystems Inc.), using Mas-ter Mix from the Mouse Inflammatory Cytokines and Receptors (PAMM-011) RT2 Profiler PCR Array System (QIAGEN). Ct values were determined by ABI software. Data analysis was performed using the web-based RT2 Profiler PCR Array Data Analysis version 3.5 (QIAGEN).
AMD3100 and Cy. Alzet osmotic pumps, model 2002 (Alza), were
loaded with 10 mg AMD3100 (Tocris) dissolved in PBS. Control mice received pumps loaded with PBS without AMD3100 (28). Pumps were subcutaneously implanted dorsally on day –2. Mice were then
chal-lenged with 1 × 10⁴ T11 cells, and tumors were harvested 12 days later
at approximately 20 mm2 in accordance with IACUC guidelines. For
low-dose Cy studies, a single dose of 100 mg/kg Cy was given PTI. This dose was sufficient to deplete 60% of the Tregs for approximately 8 days with rebound increases above baseline at day 12 after therapy (data not shown).
CXCL12 knockdown. T11 cells were treated with 4 μg/ml Polybrene and cultured overnight with Mission shRNA Lentiviral Transduction Particles (Sigma-Aldrich) containing shRNA specific for CXCL12 or a nontarget control (scramble) at an MOI of 10. Lentiviral particles were removed the next morning and new medium was added. The following
day, cells were cultured in medium containing 6 μg /ml puromycin and
expanded to select for transduced cells. Cells were tested for CXCL12 production by real-time PCR and ELISA. Two different knockdown cell lines with different levels of knockdown of CXCL12, as evaluated by ELISA assay, were characterized. Knockdown of CXCL12 had no impact on the growth of T11 cells in vitro (data not shown).
Statistics. Data are presented as mean ± SEM. Statistical
differ-ences were determined using Student’s t test, Mann-Whitney U test, or Kruskal-Wallis test, with Dunn’s post-test for multiple comparisons where appropriate. Survival data are presented using Kaplan-Meier survival analysis. Survival results were analyzed using the log-rank test. Statistical analyses were conducted using GraphPad Prism 6 soft-ware, unless otherwise noted. Results were considered statistically significant at P ≤ 0.05.
visualized with DAB and counterstained with hematoxylin using Bond Polymer Refine Detection. Stained slides were dehydrated. IF slides were counterstained with Hoechst 33258 (Invitrogen) and mounted with ProLong Gold antifade reagent (P36934, Life Tech-nologies). Tumor tissue slides (n = 10 per subtype) were stained for CD8, CD4, and FoxP3 and analyzed for coexpression at the cellu-lar level using TissueStudio on-slide cytometry to measure tumor
infiltration by Tc cells (CD8+), Th cells (CD4+FoxP3-), and Tregs
(CD4+FoxP3+). All samples were evaluated by pathologists blinded
to the tumor subtype.
Imaging and digital image analysis. H&E and IF–stained slides (CD4, CD8, CD19, and FoxP3) were digitally imaged at 20× magnifi-cation using the Aperio ScanScopes XT and FL (Aperio Technologies). The hematoxylin and DAB OD parameters were adjusted for both algorithms. The nuclear segmentation factor and the weak positive threshold were tuned for the cytoplasmic v2 and the color deconvo-lution v9 algorithms, respectively. High-resodeconvo-lution acquisition (20× objective) of the stained slides in the DAPI, Cy3, and Cy5 channels was performed in the Aperio ScanScope FL (Aperio Technologies). Cell nuclei were visualized in the DAPI channel; CD8, CD19, and FoxP3 were visualized in the Cy3 channel; CD4 was visualized in the Cy5 channel. To determine the number of cells coexpressing FoxP3/ CD4, slides were analyzed using Definiens Tissue Studio image analy-sis software (Architect XD v 2.0.4, Tissue Studio v 3.5).
Antibodies and flow cytometry reagents: human antibodies. Mouse
monoclonal antibodies against human CD4 (clone 4B12), CD8 (clone 4B11), and CD19 (clone BT51E) were purchased from Leica Microsys-tems. FoxP3 (clone 236A/E7) was purchased from Abcam. CD279 (PD-1, clone J105) was purchased from eBioscience.
Antibodies and flow cytometry reagents: mouse antibodies. Flow
cytometry monoclonal antibodies against murine CD4 (GK1.5 or RM4-5), CD8 (53-6.7), PD-1 (J43 or RMP1-30), CD45 (30-F11), CD62L (MEL-14), and CXCR4 (2B11) were purchased from eBiosci-ence. CD19 (6D5) and CD44 (IM7) were purchased from BioLegend.
Intracellular antibodies FoxP3 (FJK-16s), TNF (MP6-XT22), IFN-γ
(XMG1.2), and Helios (22F6) were purchased from eBioscience. Cell viability was determined using Blue or Aqua Fluorescence Reactive Dye (Life Technologies).
Flow cytometry. Cells were surface stained, fixed, and
permeabi-lized overnight using the Foxp3/Transcription Factor Staining Buffer Set (eBioscience), and intracellular staining was performed the fol-lowing day according to the manufacturer’s instructions. Data were acquired using MACSQuant (Miltenyi Biotec), BD Canto, or LSR II (BD Biosciences). Acquired data were analyzed using FlowJo Flow Cytome-try Analysis Software (Tree Star Inc.).
Isolation of murine TILs. Murine tumors were resected and
digested in Liberase TM (Roche), DNase I (Sigma-Aldrich), hyalu-ronidase (Sigma-Aldrich), and collagenase XI (Sigma-Aldrich), as previously described (25). Single-cell suspensions were enriched for lymphocytes by isolating cells at the interface of 44% Percoll (Sigma- Aldrich) in media and Lympholyte-M (Cedarlane) gradient. Isolated cells were stimulated for 4 hours in PMA/ionomycin prior to intra-cellular cytokine staining.
In vivo cell inhibition and depletion. Monoclonal antibodies used for
Acknowledgments
The UNC Flow Cytometry Core Facility is supported in part by a P30 CA016086 Cancer Center Core Support grant to the UNC Lineberg-er Comprehensive CancLineberg-er CentLineberg-er. This work is supported by Breast Cancer SPORE (P50CA058223 CMP to JSS), the UNC Oncology Clinical Translational Research Training Program (5K12CA120780 to BGV), and the University Cancer Research Fund (to JSS and BGV).
Address correspondence to: Jonathan Serody, Lineberger Com-prehensive Cancer Center, 450 West Drive, CB7295, University of North Carolina, Chapel Hill, North Carolina 27599, USA. Phone: 919.445.4175; Email: [email protected].
Study approval. All animal experiments were conducted in
accor-dance with protocols approved by the UNC IACUC. All human tumor and normal tissue samples were collected using IRB-approved protocols.
Author contributions
NAT and SCV designed and performed experiments, analyzed data, and wrote the manuscript. MDI and BRM performed exper-iments and analyzed data. WJB, KPM, SR, and JSP analyzed data. CKA and LAC provided clinical samples for analysis. BGV designed experiments, analyzed data, and wrote and edited the manuscript. CMP and JSS conceived of the project, analyzed data, and edited the manuscript.
1. Cancer Facts & Figures. American Cancer Society. https://www.cancer.org/content/dam/cancer-org/ research/cancer-facts-and-statistics/annual-can-cer-facts-and-figures/2016/cancer-facts-and- figures-2016.pdf. Accessed August 1, 2017. 2. Bianchini G, Balko JM, Mayer IA, Sanders ME,
Gianni L. Triple-negative breast cancer: chal-lenges and opportunities of a heterogeneous dis-ease. Nat Rev Clin Oncol. 2016;13(11):674–690. 3. Nottegar A, et al. Extra-nodal extension of sen-tinel lymph node metastasis is a marker of poor prognosis in breast cancer patients: A systematic review and an exploratory meta-analysis. Eur J
Surg Oncol. 2016;42(7):919–925.
4. Kos Z, Dabbs DJ. Biomarker assessment and molecular testing for prognostication in breast cancer. Histopathology. 2016;68(1):70–85. 5. Savas P, et al. Clinical relevance of host immunity
in breast cancer: from TILs to the clinic. Nat Rev
Clin Oncol. 2016;13(4):228–241.
6. Campbell JB. Breast cancer-race, ethnicity, and survival: a literature review. Breast Cancer Res
Treat. 2002;74(2):187–192.
7. Baum M. The changing face of breast cancer — past, present and future perspectives. Breast
Cancer Res Treat. 2002;75(Suppl 1):S1–S5;
discussion S33.
8. Anders CK, Zagar TM, Carey LA. The manage-ment of early-stage and metastatic triple-nega-tive breast cancer: a review. Hematol Oncol Clin
North Am. 2013;27(4):737–749, viii.
9. Prat A, Adamo B, Cheang MC, Anders CK, Carey LA, Perou CM. Molecular characterization of basal-like and non-basal-like triple-negative breast cancer. Oncologist. 2013;18(2):123–133. 10. Carey L. Old drugs, new tricks for triple-negative
breast cancer. Lancet Oncol. 2015;16(4):357–359. 11. Newman LA, Reis-Filho JS, Morrow M, Carey LA, King TA. The 2014 Society of Surgical Oncology Susan G. Komen for the Cure Symposium: triple-negative breast cancer. Ann Surg Oncol. 2015;22(3):874–882.
12. Wallden B, et al. Development and verification of the PAM50-based Prosigna breast cancer gene signature assay. BMC Med Genomics. 2015;8:54. 13. Prat A, Ellis MJ, Perou CM. Practical
implica-tions of gene-expression-based assays for breast oncologists. Nat Rev Clin Oncol. 2011;9(1):48–57. 14. Iglesia MD, Parker JS, Hoadley KA, Serody JS,
Perou CM, Vincent BG. Genomic analysis of immune cell infiltrates across 11 tumor types.
J Natl Cancer Inst. 2016;108(11):djw144.
15. Iglesia MD, et al. Prognostic B-cell signatures using mRNA-seq in patients with subtype-spe-cific breast and ovarian cancer. Clin Cancer Res. 2014;20(14):3818–3829.
16. Prat A, et al. Phenotypic and molecular charac-terization of the claudin-low intrinsic subtype of breast cancer. Breast Cancer Res. 2010;12(5):R68. 17. Purrington KS, et al. Genes associated with
his-topathologic features of triple negative breast tumors predict molecular subtypes. Breast Cancer
Res Treat. 2016;157(1):117–131.
18. Stanton SE, Adams S, Disis ML. Variation in the incidence and magnitude of tumor-infiltrating lymphocytes in breast cancer subtypes: a system-atic review. JAMA Oncol. 2016;2(10):1354–1360. 19. Rody A, et al. A clinically relevant gene signature
in triple negative and basal-like breast cancer.
Breast Cancer Res. 2011;13(5):R97.
20. Gatza ML, Silva GO, Parker JS, Fan C, Perou CM. An integrated genomics approach identifies drivers of proliferation in luminal- subtype human breast cancer. Nat Genet. 2014;46(10):1051–1059.
21. Sørlie T, et al. Gene expression patterns of breast carcinomas distinguish tumor subclasses with clinical implications. Proc Natl Acad Sci U S A. 2001;98(19):10869–10874.
22. Perou CM, et al. Molecular portraits of human breast tumours. Nature. 2000;406(6797):747–752. 23. Hu Z, et al. The molecular portraits of breast
tumors are conserved across microarray plat-forms. BMC Genomics. 2006;7:96.
24. Herschkowitz JI, et al. Comparative oncogenom-ics identifies breast tumors enriched in function-al tumor-initiating cells. Proc Natl Acad Sci
U S A. 2012;109(8):2778–2783.
25. Burgents JE, Moran TP, West ML, Davis NL, Johnston RE, Serody JS. The immunosuppressive tumor environment is the major impediment to successful therapeutic vaccination in Neu trans-genic mice. J Immunother. 2010;33(5):482–491. 26. Ali K, et al. Inactivation of PI(3)K p110δ breaks regulatory T-cell-mediated immune tolerance to cancer. Nature. 2014;510(7505):407–411. 27. Sharma P. Biology and management of patients
with triple-negative breast cancer. Oncologist. 2016;21(9):1050–1062.
28. Spranger S, Gajewski TF. Tumor-intrinsic onco-gene pathways mediating immune avoidance.
Oncoimmunology. 2016;5(3):e1086862.
29. Liu S, et al. Prognostic significance of FOXP3+ tumor-infiltrating lymphocytes in breast cancer
depends on estrogen receptor and human epider-mal growth factor receptor-2 expression status and concurrent cytotoxic T-cell infiltration.
Breast Cancer Res. 2014;16(5):432.
30. Andre F, et al. Molecular pathways: involvement of immune pathways in the therapeutic response and outcome in breast cancer. Clin Cancer Res. 2013;19(1):28–33.
31. West NR, et al. Tumour-infiltrating FOXP3(+) lymphocytes are associated with cytotoxic immune responses and good clinical outcome in oestrogen receptor-negative breast cancer. Br J
Cancer. 2013;108(1):155–162.
32. Ugarte F, Forsberg EC. Haematopoietic stem cell niches: new insights inspire new questions.
EMBO J. 2013;32(19):2535–2547.
33. Park HJ, et al. PD-1 upregulated on regulatory T cells during chronic virus infection enhances the suppression of CD8+ T cell immune response via the interaction with PD-L1 expressed on CD8+ T cells. J Immunol. 2015;194(12):5801–5811. 34. Zhou Q, et al. Program death-1 signaling and
regulatory T cells collaborate to resist the func-tion of adoptively transferred cytotoxic T lym-phocytes in advanced acute myeloid leukemia.
Blood. 2010;116(14):2484–2493.
35. Lowther DE, et al. PD-1 marks dysfunctional reg-ulatory T cells in malignant gliomas. JCI Insight. 2016;1(5):e85935.
36. Roberts PJ, et al. Combined PI3K/mTOR and MEK inhibition provides broad antitumor activ-ity in faithful murine cancer models. Clin Cancer
Res. 2012;18(19):5290–5303.
37. Usary J, Darr DB, Pfefferle AD, Perou CM. Over-view of genetically engineered mouse models of distinct breast cancer subtypes. Curr Protoc
Pharmacol. 2016;72:14.38.1–14.3811.
38. Moran TP, et al. Alphaviral vector-transduced dendritic cells are successful therapeutic vac-cines against neu-overexpressing tumors in wild-type mice. Vaccine. 2007;25(36):6604–6612. 39. Curtis C, et al. The genomic and transcriptomic
architecture of 2,000 breast tumours reveals novel subgroups. Nature. 2012;486(7403):346–352. 40. Dai M, Yip YY, Hellstrom I, Hellstrom KE. Curing
mice with large tumors by locally delivering com-binations of immunomodulatory antibodies. Clin
Cancer Res. 2015;21(5):1127–1138.