i
REDUCING MALARIA TRANSMISSION: THE EPIDEMIOLOGY AND TREATMENT OF PLASMODIUM FALCIPARUM GAMETOCYTEMIA
Naman Kirit Shah
A dissertation submitted to the faculty of the University of North Carolina at Chapel Hill in partial fulfillment of the requirements for the degree of Doctor of Philosophy in the
Department of Epidemiology.
Chapel Hill 2012
Approved by:
Steven R. Meshnick, MD, PhD Jonanthan J Juliano, MD, MSPH Pia D.M. MacDonald, PhD, MPH Charles Poole, ScD
ii
This work by Naman Kirit Shah is licensed under a Creative Commons Attribution-NonCommercial-ShareAlike 3.0 Unported License.
iii ABSTRACT
NAMAN KIRIT SHAH: Reducing Malaria Transmission: The Epidemiology and Treatment of Plasmodium falciparum Gametocytemia
(Under the direction of Steven R Meshnick, MD, PhD, and Neena Valecha, MD)
Gametocytes are the sexual stage of the Plasmodia life cycle which render malaria cases infectious to mosquitoes. The proportion of P. falciparum malaria cases with
gametocytemia and the duration of gametocytemia are varied. Interventions for detecting and treating gametocytemia also differ from those used against asexual parasitemia. In areas of low transmission, such as most of India, the size of the infectious reservoir drives
iv
effect of primaquine. AS+SP with primaquine increased the rate of gametocyte clearance, prevented the development of new gametocytemia, and reduced the area under the
v
“Now it is to these gametocytes that an extreme interest attaches,
because it is to them, and to Manson's study of them, that we owe the solution
of the malaria problem.”
vi
ACKNOWLEDGEMENTS
I cannot fully express the gratitude I feel for all the help and support I have received during my doctoral work. The debts I owe are many and I fear, can never be fully repaid - the best I can hope for is to start paying them forward.
First and foremost, I must thank my committee. Steve has guided my academic career since I started working with him in 2005 while in college. His support for students and their work internationally is inspiring – he sent me to both Phnom Penh (my first international malaria work) and to Jabalpur (my first India malaria work). Steve gave me the independence I needed to seek out my own projects, and my own growth, but I may have abused that freedom occasionally with my hard headed nature. Seven years of mentoring me can only be a labor of love! Charlie is the best teacher I have ever come across. If wisdom is the ability to balance then he is indeed wise always finding the appropriate mix of methods and public health, of science and ideology. He is a credit to, and I would say foundational for, our school. I could not imagine my training without him. In the oft, isolated world of academia, Pia was a respite with her rootedness in the practice of public health. She understood the PhD was just a means to larger ends and helped me navigate the gap I perceived between those two worlds. Every student needs such a champion. Jon, as the youngest member of the group, has in turn reminded me that serious work is compatible with serious humor. As importantly, his deep clinical knowledge and careful readings improved the work. Jon has been a
vii
physician-scientists can achieve. Allan is a rare breed, one of the handful of remaining malariologists in the world. To top it off he has intimate knowledge of India and all her complexities without which I could not have built my assessments of the policy and program operation implications that I strived for in my work. I am lucky to have had his active
participation during his well-earned retirement which included calls at 2am from the
Philippines for him. Finally, Neena warmly welcomed me into her institute and by extension the arena of national research and decision-making. The amazing part is she did so without any precedent for such action, deliberately taking a risk on me with a bigger vision in mind. She is a true leader and has taught me both science and administration well.
My work has been split between two continents and in fact, two homes. India has been the key to my professional and personal learning, mostly as a product of the people I‟ve been fortunate to interact with. A previous remark bears repeating, “I would also like to acknowledge other colleagues in India, with whom I have learned, and continue to learn, the difficult task of improving malaria control”. Neeru Singh invited and supported me, sight unseen, to a terrific conference in Jabalpur which opened subsequent doors. I am happy to have had the chance to return there and see her several times since. Krongthong Thimasarn allowed me to intern with her at WHO-SEARO, sharing the joys and pains of her office, as well as instructive stories and her considerable experience. This platform allowed me to learn about international cooperation and inserted me into the midst of the close knit malaria community in India. GPS Dhillon, GS Sonal, Usha Arora and AC Dhariwal have over the years hosted me in the NVBDCP directorate, given me meaningful work, and in doing so explained and demonstrated the hard work and tough decisions national programme
viii
scientists, who while much senior to me were always kind enough to treat me as a colleague. Bina Srivastava and Jai Prakash Singh provided invaluable and kind technical support. Jagannath Sarkar, SK Sharma, PK Tyagi, and HC Srivastava not only received me in their offices, joined me in field work, and developed my abilities but took care of me also - we broke bread together.
The doctoral process is much more than the dissertation. Yvan Hutin is my role model for how to conduct oneself as a public health worker. He is responsible for my
trajectory and my broad exposure to different institutions. He stepped out of the way to bring me to learn from his work in Beijing and Stockholm. Since our chance meeting many years ago, Yvan has been an incredible mentor and friend. Kevin Baird has generously
corresponded with me about malaria for many years even though we had never met until last fall. His replies were always long, funny, instructive, and always encouraging. I took Steve Wing‟s seminar and which pushed my understanding of our field farther than any other experience. He has since continued to help me think about ethics and justice in public health through my writings and personal experiences. Joseph Cook took a great interest in my progress and always lent a kind ear. He introduced me to T Jacob John, an inspiring pioneer of public health in India who critically, has helped me crystallize many nebulous sentiments into a concrete goal for the future. Science should be marked by collaboration and sharing and Brooke Hoots reinforced this culture by providing me with an invaluable copy of her work prior to its publication.
ix
UNC has been a terrific home. It profits from its dedicated directors, Gene Orringer and David Siderovski, to whom I am deeply obliged. Dr O especially, has blessed my choices where others may have balked. He has always placed the dreams of students first. Since education is an expensive proposition, with frequent trips across continents making it all the more so, I could not have completed my work without substantial financial support. The principal among these have been the UNC NIH MSTP grant GM008719 and the fellowship from the Paul and Daisy Soros Foundation. I am honored to have received the Soros support which in addition to the funding introduced me to many new friends. I want to thank Paul and Daisy for their generosity and foresight and Warren and Stan for their leadership. I am also thankful for support from the Indian Council of Medical Research, NIH infectious disease epidemiology training grant 5-T32-AI070114-03, Mahatma Gandhi Fellowship, UCIS international internship award, IDSA medical student summer research grant, Office of Global Health, OSA travel award, ASTMH travel award, and the GPSF travel award.
x TABLE OF CONTENTS
LIST OF TABLES ... xii
LIST OF FIGURES ... xiv
LIST OF ABBREVIATIONS ... xvi
CHAPTER ONE: SPECIFIC AIMS ...1
CHAPTER TWO: BACKGROUND AND SIGNIFICANCE ...4
MALARIA AS A PUBLIC HEALTH PROBLEM ... 4
STAGES IN THE MALARIA LIFE CYCLE ... 5
EPIDEMIOLOGY OF GAMETOCYTEMIA ... 6
CONTROL OF GAMETOCYTES ... 7
DIAGNOSIS OF GAMETOCYTEMIA ... 7
TREATMENT OF GAMETOCYTEMIA ... 8
MALARIA IN INDIA ... 9
GAMETOCYTES IN INDIA ... 10
SUMMARY ... 13
CHAPTER THREE: DESCRIPTION OF DATA SOURCES ...18
STUDY DESIGN ... 18
STUDY SITES ... 19
STUDY POPULATION ... 19
DATA COLLECTION ... 20
xi
CHAPTER FOUR: METHODS ...23
SPECIFIC AIM 1 ... 23
SPECIFIC AIM 2 ... 27
LIMITATIONS ... 32
CHAPTER FIVE: THE EPIDEMIOLOGY OF PLASMODIUM FALCIPARUM GAMETOCYTEMIA IN INDIA: PREVALENCE, AGE-STRUCTURE, RISK FACTORS AND THE ROLE OF A PREDICTIVE SCORE FOR DETECTION ...39
INTRODUCTION ... 39
METHODS ... 41
RESULTS ... 46
DISCUSSION ... 48
CHAPTER SIX: A NON-RANDOMIZED CONTROLLED TRIAL OF ARTESUNATE PLUS SULFADOXINE-PYRIMETHAMINE WITH OR WITHOUT PRIMAQUINE FOR PREVENTING THE POST-TREATMENT TRANSMISSION OF PLASMODIUM FALCIPARUM ...60
INTRODUCTION ... 60
METHODS ... 62
RESULTS ... 68
DISCUSSION ... 70
CHAPTER SEVEN: DISCUSSION ...82
APPENDIX A: CASE RECORD FORM ...88
APPENDIX B: NEW SYSTEM FOR MONITORING ANTIMALARIAL DRUG RESISTANCE IN INDIA ...89
APPENDIX C: REVIEW OF ANTIMALARIAL DRUG RESISTANCE IN INDIA...115
APPENDIX D: OTHER PUBLICATIONS ...139
xii LIST OF TABLES
TABLE 2.1. Summary of table of previous published studies on: A. Gametocyte epidemiology in India. B. Trials of primaquine as a gametocytocidal
agent in India...18 TABLE 4.1. Potential variables, coding structure, and notes for use in data analysis ...35 TABLE 5.1. Prevalence and association of gametocytemia in relation to
demographic and clinical factors of patients from the National
Antimalarial Drug Resistance Monitoring System, India, 2009-2010 ...53 TABLE 5.2. The contribution of age groups to the reservoir for potential
transmission using the maximum or mean day zero to three
gametocyte density in patients from the National Antimalarial Drug
Resistance Monitoring System, India, 2009-2010 ...54 TABLE 5.3. Adjusted prevalence odds ratios in the reference and final models,
regression coefficients, and risk scores for predicting gametocytemia in patients from the National Antimalarial Drug Resistance Monitoring
System, India, 2009-2010 ...55 TABLE 5.4. Performance of different risk score cut-offs for detecting
gametocytemia in patients from the National Antimalarial Drug
Resistance Monitoring System, India, 2009-2010 ...56 TABLE 5.S1. Cross-tabulation according to predictors identified in the reduced
model of patients from the National Antimalarial Drug Resistance
Monitoring System, India, 2009-2010 ...57 TABLE 6.1. Demographics, clinical characteristics, and primary outcomes by
primaquine receipt status of patients from the National Antimalarial
Drug Resistance Monitoring System, India, 2009-2010 ...74 TABLE 6.2. Post-treatment gametocyte circulation by primaquine group among
patients from the National Antimalarial Drug Resistance Monitoring
System, India, 2009-2010 ...75 TABLE 6.S1. Crude and adjusted measures of effect for primaquine on
post-treatment gametocyte clearance rates and post-post-treatment gametocyte circulation using different modeling and coding options among patients from the National Antimalarial Drug Resistance Monitoring
xiii
TABLE 6.S2. Sensitivity analysis of crude and adjusted measure of effect for primaquine on treatment gametocyte clearance rates and post-treatment gametocyte circulation assuming 50% faster interval-clearance for primaquine recipients among patients from the National Antimalarial Drug Resistance Monitoring System, India,
2009-2010 ...77 TABLE B.1. Clinical and demographic characteristics of eligible patients in studies
of the National Antimalarial Drug Resistance Monitoring System,
India, 2009-2010 ...109 TABLE B.2. Primary and secondary outcomes over 28 days of follow-up among
eligible patients in studies of the National Antimalarial Drug
Resistance Monitoring System, India, 2009-2010 ...110 TABLE B.2S. Risk of P. falciparum treatment failure among patients in studies of
the National Antimalarial Drug Resistance Monitoring System,
India, 2009-2010 ...111 TABLE B.3. Multivariate predictors of P. falciparum PCR-corrected treatment
failure among patients in studies of the National Antimalarial Drug
Resistance Monitoring System, India, 2009-2010 ...112 TABLE B.1S. Site-wise results of therapeutic efficacy and parasite clearance in
studies of the National Antimalarial Drug Resistance Monitoring
System, India, 2009-2010 ...113 TABLE B.3S. Molecular markers of anti-folate resistance in P. falciparum isolates
collected through the National Antimalarial Drug Resistance
Monitoring System, India, 2009-2010 ...114 TABLE C.1. Results of chloroquine efficacy studies conducted in India between
1978 and 2007 by area, year and duration of follow-up ...137 TABLE C.2. Results of 28-day SP efficacy studies conducted in India between
xiv
LIST OF FIGURES
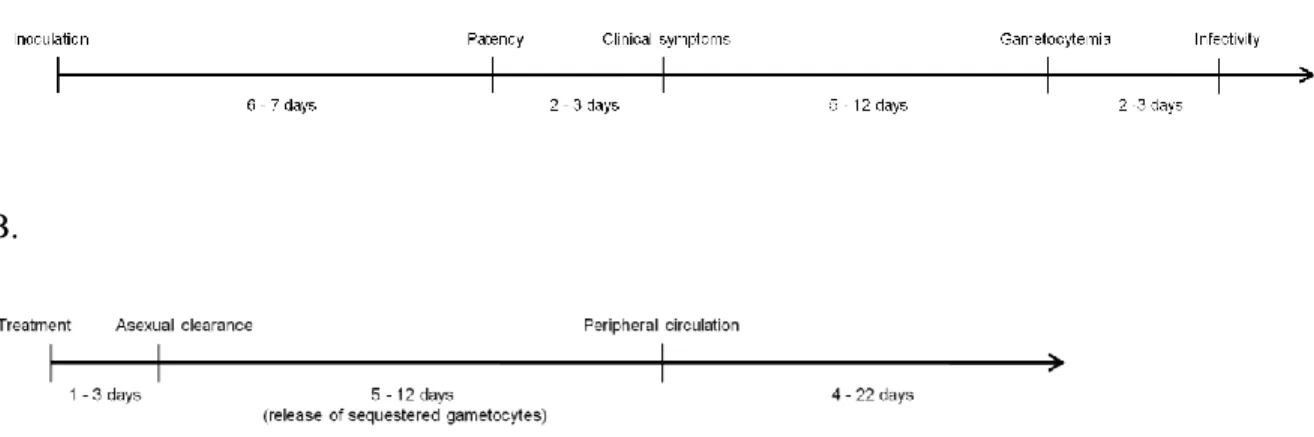
FIGURE 2.1. The life cycle of malaria parasites ...14 FIGURE 2.2. The timing and duration of P. falciparum gametocytemia in relation
to the host life-cycle: A. Natural history. B. Treated infection. ...15 FIGURE 2.3. Malaria endemicity in India by spleen rate, 1941 ...16 FIGURE 2.4. Reported malaria incidence and P. falciparum proportion in India by
NVBDCP 1961-2009 ...17 FIGURE 3.1. Map of India with P. falciparum trial districts (in red), and P. vivax
trial districts (in blue) conducted through the National Antimalarial
Drug Resistance Monitoring System, 2009-2010 ...22 FIGURE 4.1. Causal diagram of the relationship between primaquine use and
post-treatment gametocytemia ...37 FIGURE 4.2. Power available for detecting associations with or effects on
gametocytemia. A. Odds ratio (lines), different exposure prevalence, and power. B. Incidence rate ratios, given assumptions, and power. C.
Hazard ratio, given assumptions, and power ...38 FIGURE 4.3. Tests to ensure appropriate fit of the Cox proportion hazards model.
A. Proportional hazards assumptions. B. Comparison with
Kaplan-Meir function. ...39 FIGURE 5.1. Prevalence of gametocytemia and the percent of total parasites that
were gametocytes by age category of patients from the National
Antimalarial Drug Resistance Monitoring System, India, 2009-2010 ...58 FIGURE 5.2. Receiver operator characteristics curve with risk score cut-points for
predicting gametocytemia in patients from the National Antimalarial
Drug Resistance Monitoring System, India, 2009-2010 ...59 FIGURE 6.1. Flow-chart of patients eligible for treatment with primaquine from the
National Antimalarial Drug Resistance Monitoring System, India,
2009-2010 ...78 FIGURE 6.2. Prevalence of gametocytemia by treatment arm at each study visit
among patients from the National Antimalarial Drug Resistance
xv
FIGURE 6.3. Clearance of gametocytes by treatment arm among patients with pre-treatment gametocytemia from the National Antimalarial Drug
Resistance Monitoring System, India, 2009-2010 ...80 FIGURE 6.4. Area under the curve for the mean gametocyte density by treatment
arm at each study visit among patients from the National
Antimalarial Drug Resistance Monitoring System, India, 2009-2010 ...81 FIGURE B.1. Sentinel sites of the National Antimalarial Drug Resistance
Monitoring System by year, parasite species, and state (district),
India, 2009-2010 ...106 FIGURE B.2. Patient cohort from the National Antimalarial Drug Resistance
Monitoring System, India, 2009-2010 ...107 FIGURE B.3A. Kaplan-Meir survival of crude and PCR-corrected outcomes for P.
falciparum in patients among eligible patients in studies of the National Antimalarial Drug Resistance Monitoring System, India,
2009-2010 ...108 FIGURE B.3B. Kaplan-Meir survival of parasite clearance for P. falciparum and P.
vivax by 24 hour intervals among eligible patients in studies of the National Antimalarial Drug Resistance Monitoring System, India,
2009-2010 ...108 FIGURE C.1. The incidence of and proportion of P. falciparum malaria cases in
India between 1961-2007. Source: NVBDCP ...132 FIGURE C.2. Search strategy and selection criteria ...133 FIGURE C.3. Chloroquine resistance studies with 28-day follow-up by the
proportion of treatment failures in India between 1978 and 2007 ...134 FIGURE C.4. Number of 28-day chloroquine resistance studies in India between
1978 and 2007 by the proportion of treatment failures exceeding
10% ...135 FIGURE C.5. Districts in India with chloroquine treatment failure >10% (red) in
any study between 1978 and 2007 and present P. falciparum
xvi
LIST OF ABBREVIATIONS
ACT Artemisinin Combination Therapy
AS Artesunate
AUC Area Under the Curve
BQ Bulaquine
CI Confidence Interval
CQ Chloroquine
DDT Dichloro-Diphenyl-Trichloroethane EMM Effect Measure Modification
FN False Negative
FP False Positive
GEE Generalized Estimating Equations GoI Government of India
HR Hazard Ratio
IQR Interquartile Range IRR Incidence Rate Ratio
MoHFW Ministry of Health and Family Welfare MPO Modified Plan of Operations
NAMP National Anti-Malaria Programme NIMR National Institute of Malaria Research NMCP National Malaria Control Programme NMEP National Malaria Eradication Programme
xvii POR Prevalence Odds Ratio
PQ Primaquine
RNA Ribonucleic Acid
ROC Receiver Operating Characteristic
RS Risk Score
SD Standard Deviation
SE Standard Error
SEARO Southeast Asia Regional Office SP Sulfadoxine-pyrimethamine WBC White blood cell
1
CHAPTER ONE: SPECIFIC AIMS
Gametocytes are the sexual stage of Plasmodia life cycle which render malaria cases infectious to mosquitoes and propagate transmission. The proportion of P. falciparum malaria cases with gametocytemia and the duration and density of that gametocytemia are varied. In areas of low transmission, such as most of India, the number of infective hosts, as opposed to vectorial capacity, determines transmission. Thus, studies of the epidemiology of gametocytemia are needed to better define this key reservoir. Interventions for detecting and treating gametocytemia also differ from those used against asexual parasitemia. So an improved understanding of gametocytes opens the possibility of distinct transmission-blocking control strategies for the nation.
First, which case-patients carry gametocytes? Universal application of
2
Second, how should we treat gametocytemia? Artemisinin combination therapies (ACT), the first-line treatment in most countries including India, eliminate immature gametocytes but not mature gametocytes which may persist for up to one month post-treatment. The key operational question is whether a single dose of primaquine, which is inexpensive and effective against mature gametocytes, should be added to artemisinin combination therapies to reduce the potential post-treatment transmission of the infection. Currently, we have little data regarding the safety or effectiveness of doing so.
This dissertation aims to describe the epidemiology of gametocytemia in India, including its prevalence, age-structure, and risk factors, as well as estimate the effect of primaquine in addition to an ACT for improving the control of malaria in the country by reducing potential transmission. We used data from the National Antimalarial Drug Resistance Monitoring System, run by the National Institute of Malaria Research (NIMR) and the National Vector Borne Disease Control Programme (NVBDCP), which conducted therapeutic efficacy trials at 21 sentinel sites during 2009 and 2010, where 9 sites used primaquine in addition to artesunate plus sulfadoxine-pyrimethamine (AS+SP) while 12 used AS+SP alone.
Specific Aim 1
3 Rationale:
Identifying the type of person likely to carry gametocytes may enable us to target individuals for screening and/or treatment without the need for diagnostic equipment. Conversely, an inability to target accurately would suggest the need for universal application of interventions.
Specific Aim 2
Estimate the effect of adding primaquine to artemisinin combination therapy on post-treatment clearance (gametocyte survival) and post-post-treatment carriage (gametocyte incidence) during 28 days of follow-up
Rationale:
4
CHAPTER TWO: BACKGROUND AND SIGNIFICANCE
MALARIA AS A PUBLIC HEALTH PROBLEM
Malaria is the resultant febrile illness from an infection by a parasite of the
5 STAGES IN THE MALARIA LIFE CYCLE
The malaria parasite has a complex life cycle traversing through both mosquito and human hosts (Figure 2.1). Within persons there is the liver stage of infection
(exo-erythrocytic) where the infection begins, and in the case of P. vivax and P. ovale dormancy may persist, and a blood stage (erythrocytic cycle) which produces clinical symptoms (2). Gametocytes are the sexual stage of Plasmodia life cycle which render malaria cases infectious to mosquitoes and propagate transmission (9).
In P. vivax gametocytes appear in most cases and shortly after the emergence of asexual parasites from the exo-erythrocytic cycle (10). In P. falciparum however, the proportion of malaria cases with gametocytemia and the duration and density of that
gametocytemia are varied (11). Furthermore, infective gametocytes1 do not appear until later in the blood-stage infection nearly several days after patency (the first appearance of
parasites in the blood stream) and multiple cycles of asexual parasitemia (12). The mean duration of survival for a mature gametocyte is between 4-6 days (13,14) (Figure 2.2 A). Coupled with the maturation and progressive release of sequestered gametocytes,
gametocytemia may persist for three to six weeks after the elimination of its precursor asexual stages (by successful treatment for example) however the viability of gametocytes towards the end of this period, that is their ability to infect mosquitoes, is less certain (13,15,16) (Figure 2.2 B).
6 EPIDEMIOLOGY OF GAMETOCYTEMIA
Although gametocytes are central to understanding transmission, few studies in the past 50 years have tried to demarcate the infectious reservoir (15). This may be because in high transmission areas of interest, namely sub-Saharan Africa which has long dominated the donor perspective given its high burden and generally poor health systems, the infectious reservoir is not an important determinant of the intensity of transmission relative to high vector competence (17). However, in low transmission areas, where the vector is not as efficient, the proportion of infectious hosts is more critical to the maintenance of endemicity (17). With recent reductions in malaria transmission due to intervention scale-up, and increased focus on malaria elimination worldwide, interest in the epidemiology of
gametocytes is gaining traction with the hopes that a better understand will help reduce the remaining infectious reservoir (18–20).
Microscopically detected gametocytemia is typically present in less than 50% of cases (21) though the proportion rises greatly using molecular techniques, albeit at lower densities (13). The overall density of gametocytes among the total parasite population tends to be low, typically less than 5% of parasites (22,23). A key aspect of gametocyte
7
duration of clinical symptoms (30,35,36), being afebrile at the time of presentation (37), and previous antimalarial drug intake (38), and epidemic situations are associated with a higher prevalence of gametocytemia (39,40).
CONTROL OF GAMETOCYTES
The control of gametocytes is largely achieved through general malaria control. Treatment of parasitemia prevents the generation of new gametocytes and limits infectivity, while vector control measures, in addition to protecting individuals from new infections, prevents mosquito uptake of existing infections. Gametocyte-specific interventions are, at present, limited to its diagnosis and treatment which we discuss in more detail. In the future, preventative interventions such as transmission-blocking vaccines, which induce immunity against gametocytes or the mosquito stage gamete, may be available (41,42).
DIAGNOSIS OF GAMETOCYTEMIA
Typically gametocytes are diagnosed through light microscopy using the same methods as those for screening parasitemia. P. falciparum gametocytes, with their large crescents shape, are distinctive and easy to recognize. The detection limit for thick film microscopy of approximately 8-40 parasites per microliter (depending on whether 200-1000 WBC counted) poses a challenge though as gametocyte density is substantially lower than that of asexual parasites (typically <5% of the total population). Thus, microscopy is a specific tool but its sensitivity may vary. Coupled with poor training and heavy workloads, the diagnosis of gametocytemia in routine settings is difficult.
8
2-4 times that detected by microscopy (46–51). However, not all gametocytemia is the same. While sub-microscopic density infections can infect mosquitoes, the probability of infection, the proportion of mosquitoes infected, and the density of infection in mosquitoes increases with increased gametocyte density (48,52). Comparisons of host infectivity must account for both the frequency and magnitude of gametocytemia.
TREATMENT OF GAMETOCYTEMIA
Most antimalarial drugs target blood-stage schizonts, responsible for clinical symptoms, and have varying activity against gametocytes. Chloroquine, quinine, and sulfadoxine-pyrimethamine are active against newly differentiated gametocytes but lose potency as gametocyte development progresses (53–57). In fact, with some of these drugs post-treatment increases in gametocytemia are often observed, attributed to increased “stress” acting through some unknown mechanism, inducing gametocytogenesis among remaining parasites to ensure survival. Artemisinin is a potent gametocytocidal drug against all stages except for those already fully mature (i.e. in peripheral circulation) and this characteristic contributed to the impressive declines in transmission following the widespread
implementation of combination therapy in several countries, notably Thailand (58).
However, remaining mature gametocytes (present in 10-30% of patients), remain infectious and persist for up to a month post-treatment and can therefore contribute to transmission (51,59–62).
9
challenge with primaquine is the concern over its safety in G6PD deficient patients and others where the drug can precipitate mild to severe hemolysis (71–73). However, the safety of a single dose, rapidly eliminated, is thought to be greater than the 14 day anti-relapse treatment provided in P. vivax treatment which was the principal cause of safety concerns (74). The ethics for single-dose primaquine have been questioned in light of these risks and the community rather than individual level benefit conferred (74).Studies of artemisinin combination therapies (ACT) with primaquine indicate reductions in gametocyte carriage, area under the curve, clearance time, and infectivity, whether assessed microscopically or by molecular techniques, relative to ACT alone (66–70). The magnitude of the effect appears to vary though with reduction in post-treatment gametocyte carriage of 25-75% among African children, 60% in Colombian adults, and 92% in Burmese patients of all ages (47,75,76).
MALARIA IN INDIA
The Republic of India represents the largest national population at risk for malaria in the world with 85% of the populace residing in malarious zone (77,78) (Figure 2.3). Both major Plasmodium species, six primary malaria vectors, several ecotypes including urban malaria, and transmission intensities ranging from unstable to hyper endemic highlight the challenging malaria epidemiology in the nation (79). At the time of independence in 1947, the Indian people were suffering from an estimated 75 million cases and 800,000 deaths per year (80).After independence health care was prioritized and the control of malaria was one of the key aims of the Government of India (GoI). In 1953, the National Malaria Control Programme (NMCP) was launched under the Ministry of Health and Family Welfare
10
The control programme evolved into the National Malaria Eradication Programme (NMEP) in 1958 (82). Reliable surveillance gradually developed during the eradication period (83) and the programme seemed to be highly effective with only 99,667 malaria cases and zero deaths reported in 1965 (84).
However, the long-term success of malaria control could not be sustained (85). Increasing insecticide resistance in mosquitoes, urbanization, population migration, integration with the general health services, financial difficulties and other operational challenges laid the foundation for a resurgence of malaria (84,86). In 1976, malaria cases reached a post-eradication peak of 6.47 million cases (87). A new strategy, the Modified Plan of Operation (MPO), was introduced in 1977 (88) after which there has been a steady decline in malaria cases in the country (Figure 2.4) (89). In 1998 the NMEP was re-christened the National Anti-Malaria Programme (NAMP) and in 2003 it became the National Vector Borne Disease Control Programme (NVBDCP) (90). In 2010, 1.4 million malaria cases were reported by routine surveillance of which half were due to P. falciparum (91).
GAMETOCYTES IN INDIA
History
Much of the early literature on gametocytemia, and indeed much of all malaria research itself, from India. In part four of a series of paper on malaria treatment, Major JA Sinton of the Indian Medical Service and the director of the Malaria Survey of India, draws the following conclusions in “The occurrence of sexual forms of Plasmodium falciparum in the peripheral circulation” (92):
11
2) The recorded variations in the incidence of crescent carriers in different localities are influenced by various factors.
3) The development of crescents appears to be associated with a lowered immunity of the body.
4) The duration of the life of a crescent may be as long as 40 to 50 days but the great majority disappears within three weeks after the asexual cycle has been destroyed. 5) The reduction of crescent carriers by efficient treatment and the prevention of
such carriers conveying the infection to mosquitoes are important factors in all anti-malaria campaigns.
Most of his observations, and the work of that time, remains relevant today and their work would help establish the primary role of the 8-aminoquinoline compounds in
gametocytocidal therapy.
Epidemiology
A Medline search of “gametocyte India” (Oct, 2011) returned 20 results of which 7 articles were relevant. Of these four studies (Table 2.1 A) provided limited useful
information with most suffering from problems of small samples, non-specific goals, being outdated, and limited area coverage (93–96). Additionally, diagnosis of gametocytes was not validated and studies did not specify the laboratory protocol for microscopy used to assess gametocytemia. Most importantly, none of the studies attempted to characterize individuals who have gametocytes by examining key covariates including age, gender, asexual parasite density, etc. The remaining studies were clinical trials of gametocytocidal agents
12
knowledge regarding the distribution and determinants of gametocytes in India is quite limited.
Treatment
Before the switch to ACT, the use of primaquine for gametocytocidal effect was part of the national drug policy for P. falciparum treatment in India (0.75mg/kg, usual adult dose of 45mg) (100). Notably, serious side-effects to single dose primaquine remain unreported after decades of use in millions of patients though this matter has not been the focus of careful study and pharmacovigilance is poor (74). Recent studies have also challenged this picture (71). Given the vulnerable nature of malaria endemic populations, Baird and Surjadjaja have argued for a higher bar of demonstrating safety to ethically use primaquine noting the current evidence is deficient by any modern medical standard let alone sufficient to achieve the approval of drug regulatory agencies today (74).
13
low transmission areas (106). Yet, no studies have been conducted in India and evidence of its implementation, in both public and private facilities is lacking (110).
SUMMARY
Knowledge about the epidemiology of gametocytes and efficacy of gametocytocidal treatment is important, yet they remain largely unknown in India, which is the highest burden country outside sub-Saharan Africa. The transmission setting in India is quite different from that of sub-Saharan Africa and local data is needed. Low natural immunity, more adult malaria, generally better access to drugs, and mixed malaria species (111) all affect the risk of gametocytemia and thus we could expect a different epidemiological scenario than described elsewhere. All previous trials of primaquine were conducted in high transmission areas with greater immunity and most of these areas were also primaquine “naïve”
15
FIGURE 2.2. The timing and duration of P. falciparum gametocytemia in relation to the host life-cycle: A. Natural history. B. Treated infection.
A.
16
17
18
TABLE 2.1. Summary of table of previous published studies on: A. Gametocyte epidemiology in India. B. Trials of primaquine as a gametocytocidal agent in India.
A.
Reference District, State Sample size Gametocytes Key Results
Rajagopalan et al., 1990 (95)
Koraput, Odisha 714 127 Point
prevalence
Mohapatra et al., 1992 (94)
Koraput, Odisha 22 22 Circulation
time estimates
Mohapatra et al., 1998 (96)
Nalbari, Assam -- -- High
occurrence in children Kar et al.,
2009 (93) Laskar, Uttaranchal -- 568 Epidemic and resistance
marker
B.
Reference District, State Comparator First-line Key Results
Gogtay et al., 1999 (113)
Mumbai, Maharashtra None CQ 4/15 CQ
sensitive infections remained gametocytemic on day 28 Kamtekar et
al., 2004 (97)
Mumbai, Maharashtra No
primaquine
Quinine 4% (PQ)
gametocytemic day 28 vs 27% Gogtay et
al., 2006 (98)
Mumbai, Maharashtra Bulaquine CQ Clearance of
gametocytes by day 28, faster in BQ
18
CHAPTER THREE: DESCRIPTION OF DATA SOURCES
STUDY DESIGN
The study used existing data from the National Antimalarial Drug Resistance
Monitoring System which conducted 22 P. falciparum efficacy trials in different sites across India in 2009 and 2010 (Appendix A) (114). However, the use of primaquine as an adjunct therapy was not specified leading to 9 trial sites using it, while 13 sites did not.
Aim 1 used a cross section of the trial population, consisting of data available during the treatment phase (day zero to day two). Aim 2 was a cohort study of 28 days of follow-up among all patients from the efficacy trials who received the full course of treatment. Our study design provided a large sample size from multiple settings across India which assisted with the generalizablity of the findings. Additionally, since we used data from a trial setting using expert staff, the data quality was high.
19 STUDY SITES
A total of 11 states were selected: Andhra Pradesh, Assam, Chhattisgarh, Gujarat, Jharkhand, Madhya Pradesh, Maharashtra, Meghalaya, Odisha, Rajasthan, and West Bengal were selected. Among these states 21 districts were selected: Angul, Baran, Betul, Bilaspur, Chhindwara, Dhenkanal, Dumka, Jalpaiguri, Kanker, Kolkata, Latehar, Mumbai, Nagaon, Pratapgarh, Ranchi, Sambalpur, Silvasa, Simdega, Surat, Vishakhapatnam, and West Garo Hills (Figure 3.1). We could not obtain data from one site (Gadcharoli) because
gametocytemia was not recorded in case record forms and slides could not be re-examined. NVBDCP and NIMR purposively selected the study areas to represent P. falciparum transmission settings across the country. Geographic clusters were associated with different malaria ecotypes: Western India as Gujarat, Mumbai, and Rajasthan, Central India as Andhra Pradesh, Chhattisgarh, Gadcharoli, Jharkhand, Madhya Pradesh, and Orissa, and Eastern India as the Assam, Meghalaya, and West Bengal sites (85,115). While the ecotype of malaria within clusters may vary, for example urban Western India compared to rural
Western India, finer resolution was not possible with the available information. The ecotypes of the clusters was as follows: Western – unstable rural or urban transmission driven by Anopheles culicifacies and A. stephensi, Central – stable forest-related transmission driven by A. fluviatilis, and Northeastern – stable de-forestation and forest-related transmission driven by A. minimus and A. dirus (116).
STUDY POPULATION
20
severe malaria, non-pregnant, and willing to consent to follow-up. Some patients ineligible on parasite density (either wrong species, out of range, only rapid test used, etc) were
enrolled, but withdrawn from the study at a later date. Patients were enrolled through routine fever screening at clinics or through active case detection in the surrounding community by the study team. The main advantages of the study population were its size, representativeness of different malaria transmission settings and ecotypes, and quality of monitoring.
DATA COLLECTION
21 DATA MANAGEMENT
Existing therapeutic efficacy data was consolidated into a single database from its previous composition of multiple Microsoft Excel workbooks. We incorporated range checks to investigate plausible values for each data field. The cleaned data was imported
22
23
CHAPTER FOUR: METHODS
SPECIFIC AIM 1
Exposure and outcome assessment
Risk factors for gametocytemia that would be easily identifiable in field settings to ensure programmatic relevance were the exposures of interest: age, region, gender, previous antimalarial drug intake, current fever, history of fever, and asexual parasite density.
Exposures were assessed record review of surveyed demographic or clinical information except for current fever used a digital thermometer to take the axillary temperature and asexual parasitemia which was assessed by microscopy as described below. The outcomes of interest were gametocytemia and gametocyte density.
Diagnosis of gametocytes was by light microscopy. Briefly, routine oil immersion reading at 1,000X on Giemsa stained thick smears was used. Slides were counted until 200 white blood cells (WBC) if gametocytes were detected by then or until 1,000 WBCs to declare a slide negative. We assumed 8,000 WBC per µL of blood to obtain a final density per microliter of blood. All treatment failures and 10% of slides were randomly
24 Case and covariate definitions
We defined gametocytemia as the presence of gametocytes, in any day between enrollment and day two of follow-up, in a patient eligible for the therapeutic efficacy study in 2009 or 2010. The half-life of mature gametocytes is estimated at four to six days once in peripheral blood (13). Thus, patients with gametocytemia on the first day of follow-up may have been gametocytemic at enrollment. At the least, they would have benefited from a gametocytocidal intervention. Gametocytemia detected later in follow-up however, may have different origins and may not benefit from a gametocytocidal intervention given during treatment. For example, gametocytogenesis from persisting asexual stages, re-infection, or the release of sequestered developing gametocytes could explain any later onset
gametocytemia.
We categorized age using cutoffs used in age-wise treatment blister packs (<1, 1-4, 5-9, 10-14, and ≥15 years categories) and asexual parasite density using cut-offs used in
25 Complete case analysis
We conducted a complete case analysis using all patients completing two follow-up visits after enrollment. None of the predictors had missing data. Missing gametocytemia data, due to withdrawal and loss to follow-up during the three-day treatment phase, was less than 3% of the overall sample. We made the assumption that missing data on gametocytemia was missing at random within the levels of covariates. Given these assumptions complete case analysis will lead to some loss of power but not appreciable bias. The missing data is less than 5% of the overall sample suggesting such censoring is unlikely to be informative.
Data analysis
26
We used unconditional multivariate logistic regression to build a reference predictive model between the demographic and clinical factors and gametocytemia. To account for the clustering of data in each trial, we used cluster robust error with district as the unit. We estimated the crude prevalence odds ratio and its 95% confidence interval between predictors and gametocytemia. We included all predictors associated with gametocytemia (p<0.25) in the bivariate analysis. We assessed collinearity between each pair of predictive factors and selected among collinear variables based on their operational utility. We evaluated two-way interactions of each effect measure and retained all product terms with p values <0.25. To simplify field use of the algorithm, we examined reduced models which had adequate fit and similar predictive power to the reference model. We used backwards elimination using the Wald test to remove predictors with p<0.10 starting with interaction terms and proceeding to the variable with the highest p value. We assessed changes in the performance of the reduced model due to removing variables or collapsing across categories using the area under the receiver operating characteristic (ROC) curve. We evaluated model fit using the Hosmer-Lemeshow test.
27
classified and the percent of the population which would be treated if scores were used to target gametocytocidal therapy. False positive and false negatives were not formally
weighted but considerations around each will be discussed in light of program goals (control or elimination).
Power
Assuming a control:case ratio of 9:1 we have more than 80% power to detect any risk factors with an POR of 2 and a prevalence among control of 7.5% or greater (Figure 4.2 A). Multivariate analysis may decrease power but using these conservative assumptions, this study has sufficient power to accomplish its aims.
Ethical clearance
The Scientific Advisory Committee of the National Institute of Malaria Research, and the Institutional Review Board of the University of North Carolina approved the secondary analysis.
SPECIFIC AIM 2
Exposure and outcome assessment
Primaquine therapy was the main exposure. We obtained primaquine use information from the site physician. While site wise practices differed, physicians indicated they
administered primaquine uniformly, i.e. to all patients or none on the same day and at the standard dose, within sites so group exposure was used. The main outcome was
28
assessed through history taking at each study follow-up visit through patient complaint or recall.
Case and covariate definitions
We defined pre-treatment gametocytemia as the presence of gametocytes on or before day two in a patient a patient eligible for the therapeutic efficacy study in 2009 or 2010.We defined post-treatment gametocyte clearance as the first day without gametocytemia after day two in a patient with pre-treatment gametocytemia. We defined an event of post-treatment gametocytemia as the presence of gametocytes on any follow-up day after day two in a patient eligible for the therapeutic efficacy study in 2009 or 2010. We excluded
gametocytemia at the time of failure for patients with recrudescence or re-infection.
For measuring exposure time in days we censored at the midpoint of the interval and for measuring exposure time in weeks we censored at the end of the interval. We reported the week time data to enable comparison with previous literature. For the measurement of post-treatment gametocyte circulation, patients who completed follow-up accrued an additional week of exposure in order to incorporate the contribution of individuals who remained positive at the end of day 28. Thus, the total post-treatment exposure time of 32 days is congruent with biological estimates of the maximum circulation time of gametocytes (13). We used the covariates and coding strategies described in Aim 1. (Table 4.1)
Causal diagram
We constructed a causal diagram of the effect of primaquine on gametocytemia using substantive knowledge from literature and experience. We used the DAG program
29
other sufficient adjustment sets (in which case the adjustment is unbiased but precision is lost compared to minimally sufficient adjustment if the diagram is correctly specified and the other sets are correctly measured).
Complete case analysis
We conducted a complete case analysis using all patients who completed treatment. None of the predictors had missing data. Missing gametocytemia data, due to withdrawal and loss to follow-up during the treatment phase, was less than 3% of the overall sample. We made the assumption that missing data on gametocytemia was missing at random within the levels of covariates.. Given these assumptions complete case analysis will lead to some loss of power but not appreciable bias. The missing data is less than 5% of the overall sample suggesting such censoring is unlikely to be informative.
Data analysis
We tabulated the clinical and demographic characteristics, as well as the primary and secondary study outcomes, of patients who received and did not receive primaquine. We collapsed categories of continuous variables where the prevalence of gametocytemia was similar among adjoining groups. We calculated the mean and median gametocyte clearance times by treatment group and compared them using the t-test and ranksum tests. We
calculated the incidence, incidence rate ratios, and incidence rate differences over follow-up time among the primaquine and no primaquine groups.
We modeled the effect of primaquine by estimating the post-treatment clearance rates of gametocytes among patients with gametocytes at enrollment and by comparing the
30
crude and adjusted relative measures of effect, hazard ratios and incidence rate ratios respectively, as these were readily interpretable and generalizable across our diverse study sites. We used Cox regression with the Efron method for ties (119) with clustered (on site) robust standard error and Poisson regression using general estimating equations with unstructured correlation matrixes and robust clustered (on patient) standard error respectively.
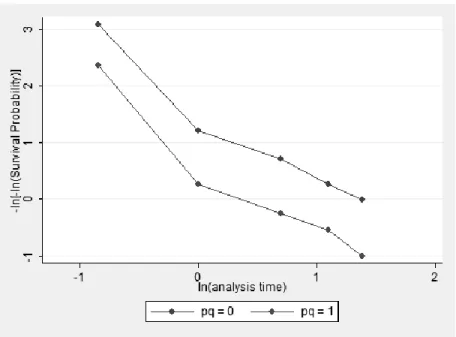
Based on our diagram, adjustment on district was sufficient to control confounding bias. However, we controlled for region instead since the exposure, primaquine, did not vary by district. To assess the robustness of the measure of effect to uncontrolled confounding, we also produced estimates adjusted for age and parasite density, variables strongly associated with gametocytemia, as well as adjusted for all covariates whose distribution differed between the two arms in bivariate analysis using t-tests, chi-square, or fisher‟s exact test as appropriate (p value<0.10). We included an interaction term between region and primaquine and assessed effect measure modification if the Wald test for the interaction term was p<0.2. We used a backwards elimination strategy to retain confounders which changed the estimate by at least 10%. In the Cox model we compared the model with and without discrete time (marginal) due to the large number of tied events and assessed the proportional hazards assumption by examining the -log(log(survival)) over time for parallel trends between the groups (Table 4.3). We compared the Poisson model to a negative binomial model, using a generalized linear model, using a likelihood ratio test with criteria p<0.05 to ensure
appropriate fit with outcome dispersion.
31
time. We used the same time within the interval to censor for both groups which assumed no difference in inter-interval clearance and could underestimate the measure of effect. The inter-interval time likely differs by primaquine status since the drug accelerates gametocyte clearance. Based on previous studies, we conducted a sensitivity analysis assuming 50% reduction in time at risk in a given interval among primaquine exposed patients. We plotted the mean area under the curve (AUC) for gametocyte density for each group by study visit. We excluded outliers of high pre-treatment gametocytemia (maximum density >2,000/µL, n=5) which disproportionally influenced the AUC. We calculated the AUC per day using the formula of Mendez et al. with the addition of the area for gametocytemia remaining at the end of follow-up (120). We compared the median AUC per day for each arm using the ranksum test and described differences using percentile cut-offs.
Sensitivity analysis
32 Power and ethics
The no primaquine to primaquine ratio is approximately 2:1. The prevalence of gametocytemia among the exposed is assumed at 5% (approximately the day 28 prevalence in the primaquine arm) and we have more than 90% power to detect an IRR >2 (Figure 4.2 B). With our sample size of 156 we have more than 90% power to detect a HR of 0.5 assuming 10% withdrawal and 80% of patients failing during the follow-up period, and nearly 80% power to detect a HR of 0.6. (Figure 4.2 C). Multivariate analysis may slightly decrease power but using these conservative assumptions, this study has sufficient power to accomplish its aims.
The Ministry of Health and Family Welfare, the Scientific Advisory Committee of the National Institute of Malaria Research approved the trials and the Institutional Review Board of the University of North Carolina approved the secondary analysis.
LIMITATIONS
33
sensitivity of microscopy could be considered adequate as well as non-differential in respect to functional gametocytemia. Similar estimates of the effect of primaquine, in one study which used two outcomes – binary microscopic gametocytemia or area under the curve for molecular gametocytemia – suggests that bias due to outcome misclassification may be minimal (47,70). Other studies which sought to describe the association of gametocytemia with age and as a portion of the total parasite population by QT-NASBA and by microscopy or estimate the circulation times of gametocytes demonstrated no difference in trends by technique (13,121).
Second, we completed enrollment at each site over one to two months preventing the analysis of seasonal trends for gametocytemia.
Third, our population cross-section is not representative of the population at-risk. It represented individuals attending the public sector health clinic for their fever treatment or those in communities which were accessible to active case detection. However, it is
representative of the population encountered by the national control programme through their active and passive case detection. This also means that all individuals were symptomatic. We did not assess the contribution of asymptomatic carriers to transmission but, at present, there may not be valid means to do so (122). The population thus fitted our goal - to observe the population amenable to current and future interventions through the control programme.
Fourth, primaquine use was not randomized. While we controlled for several sets of covariates and assessed effect measure modification, confounding due to unmeasured causes may bias our estimated effect and the possibility of heterogeneity of the effect cannot be excluded with the available power (123).
34
35
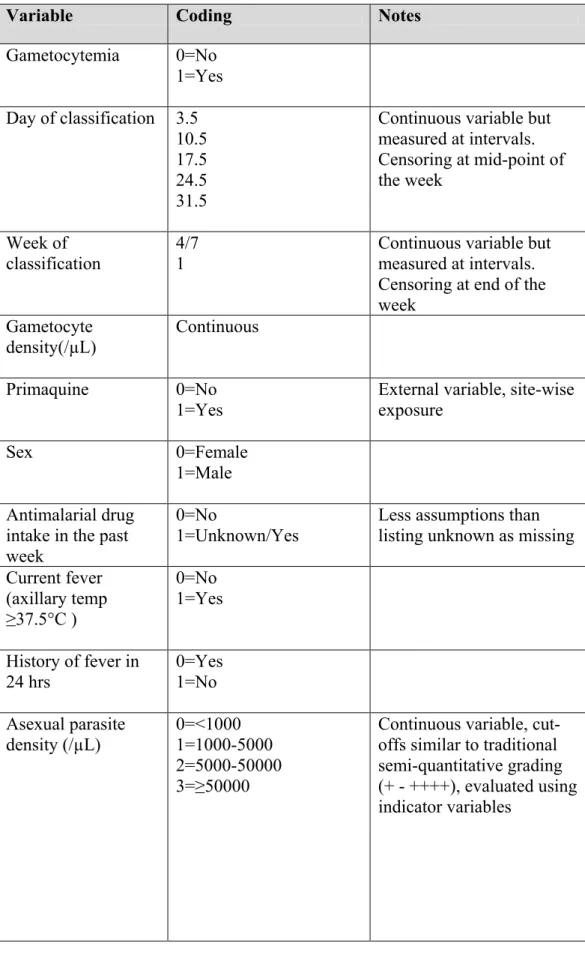
TABLE 4.1. Potential variables, coding structure, and notes for use in data analysis
Variable Coding Notes
Gametocytemia 0=No 1=Yes Day of classification 3.5
10.5 17.5 24.5 31.5
Continuous variable but measured at intervals. Censoring at mid-point of the week
Week of
classification 4/7 1 Continuous variable but measured at intervals. Censoring at end of the week
Gametocyte density(/µL)
Continuous
Primaquine 0=No
1=Yes
External variable, site-wise exposure
Sex 0=Female
1=Male Antimalarial drug
intake in the past week
0=No
1=Unknown/Yes Less assumptions than listing unknown as missing Current fever
(axillary temp ≥37.5°C )
0=No 1=Yes
History of fever in 24 hrs 0=Yes 1=No Asexual parasite density (/µL) 0=<1000 1=1000-5000 2=5000-50000 3=≥50000
36
Variable Coding Notes
Age (years) 0=0-4
1=5-9 2=10-14 3=15-49 4=≥50
Continuous variable, cut-offs used age-blister packs and correspond to malaria immunity / exposure risks, evaluated using indicator variables
Classification 0=Withdrawal 1=Lost to follow-up 2=ACPR
3=ETF 4=LCF 5=LPF
Categorical based on WHO protocol, evaluated using indicator variables
District 22 districts Categorical variable,
evaluated using indicator variables
Region 0=Western
1=Central 2=Northeast
37
38
FIGURE 4.2. Power available for detecting associations with or effects on gametocytemia. A. Odds ratio (lines), different exposure prevalence, and power. B. Incidence rate ratios, given assumptions, and power. C. Hazard ratio, given assumptions, and power
A. B.
C.
* two sided
39
FIGURE 4.3. Tests to ensure appropriate fit of the Cox proportion hazards model. A. Proportional hazards assumptions. B. Comparison with Kaplan-Meir function.
A.
B.
39
CHAPTER FIVE: THE EPIDEMIOLOGY OF PLASMODIUM FALCIPARUM GAMETOCYTEMIA IN INDIA: PREVALENCE, AGE-STRUCTURE, RISK FACTORS AND THE ROLE OF A PREDICTIVE SCORE FOR DETECTION
INTRODUCTION
Gametocytes are the sexual stage of Plasmodia life cycle that render malaria patients infectious to mosquitoes and propagate transmission. The proportion of patients infected by P. falciparum with gametocytemia and the duration and density of that gametocytemia vary. Although gametocytes are central to understanding transmission, few studies have tried to demarcate the infectious reservoir (15). This may be because the infectious reservoir is not an important determinant of the intensity of transmission relative to high vectorial capacity in high transmission areas (17). However, in low and moderate transmission areas, the
proportion of infectious hosts is critical to the maintenance of endemicity (17). Interventions for detecting and treating gametocytemia also differ from those used for asexual parasitemia. So an improved understanding of the epidemiology of gametocytemia opens the possibility of distinct transmission-blocking control strategies. With recent reductions in malaria transmission in many countries and increased focus on elimination worldwide, interest in gametocytemia is gaining traction.
40
laboratory standards and the heavy workloads of technicians makes the diagnosis of gametocytemia difficult in routine settings. Recently, molecular methods that detect
gametocyte-stage specific RNA transcripts have been employed in research (43–45) but these may not be feasible for routine public health use. Associations of gametocytemia with easily discerned factors including age, season, and symptoms such as fever at the time of
presentation could provide an alternative strategy for targeting gametocytocidal
interventions. Clinical algorithms for predicting gametocytemia among diagnosed malaria patients could help improve its detection.
The control of malaria is a key challenge for India which reported 1.5 million cases in 2010 (126). The reduction of transmission is a priority; most of the country consists of low and moderate malaria endemicity. The transmission of malaria in India is arguably the most complex in the world given the large geographic area, the presence of both major parasite species, a wide range of ecotypes and vectors, and the enormous population (89). In addition, lower acquired immunity, more adult malaria, better access to drugs, and mixed species infections alter the epidemiology of gametocytemia in India compared to sub-Saharan Africa (111). Pre-independence Sinton and others studied the crescents of malignant tertian malaria primarily with respect to treatment and spleen size (92). Since 1990, only 4 published studies have described gametocytemia in India but these suffer from small sample sizes and limited area coverage (93–96). Most importantly, no study characterized the subpopulation with gametocytemia.
The goal of this study was to describe the epidemiology of P. falciparum
41
to clinical and demographic factors to understand its distribution among subpopulations of our study. Third, we calculated the contribution of different age groups to the reservoir for potential transmission using gametocyte density. Last, we created predictive scores for gametocytemia and calculated the sensitivity and specificity of different cut-points to determine the utility of an algorithmic approach for detection.
METHODS
Study sites and population
We utilized data from 22 P. falciparum therapeutic efficacy trials conducted through the National Antimalarial Drug Resistance Monitoring Network of India in 2009 and 2010 (114). The National Vector Borne Disease Control Programme and the National Institute of Malaria Research purposively selected the study sites to represent P. falciparum transmission settings across the country. We could not obtain data from 1 site (Gadcharoli) because
42 Data collection
The data collection methods have been previously described (114). Briefly, clinical and demographic information were recorded from each patient at enrollment. Patients were followed during the first 3 days of treatment (artesunate plus sulfadoxine-pyrimethamine, 4mg/kg for three days + 25/1.25mg/kg as per national guidelines) and then at weekly intervals from enrollment until day 28. At each follow-up visit a physical exam was conducted and thick and thin blood smears were prepared. Using routine oil immersion reading at 1,000X on Giemsa-stained thick smears, slides were counted until 200 white blood cells (WBC) if gametocytes and asexual stages were present or until 1,000 WBC to declare a slide negative for both. A count of 8,000 WBC/μL of blood was assumed to obtain a final density for asexual and sexual parasites. The data were double-entered into the WHO therapeutic efficacy database and blood slides were cross-checked by expert microscopists. Existing therapeutic efficacy data was consolidated into a single database after range checks to investigate plausible values for each data field.
Case and predictor definitions
We defined gametocytemia as the presence of gametocytes in the peripheral blood smear, in any visit between day 0 and day 2 of follow-up, in a patient eligible for a
therapeutic efficacy study in 2009 or 2010. The half-life of mature gametocytes is estimated at 4 to 6 days once in peripheral blood (13). Thus, patients with gametocytemia on the first day of follow-up may have been gametocytemic at enrollment. At the least, they would have benefited from a gametocytocidal intervention. Gametocytemia detected later in follow-up however, may have different origins and may not benefit from a gametocytocidal
43
stages, re-infection, or the release of sequestered developing gametocytes could explain any later onset gametocytemia.
We selected predictors associated with gametocytemia in prior literature that could be feasibly identified during routine curative care: age, sex, region, previous antimalarial drug intake, current fever, history of fever, season, and asexual parasite density (15). We
categorized age with cutoffs used in age-wise treatment blister packs (<1, 1-4, 5-9, 10-14, and ≥15 years categories) and asexual parasite density with cut-offs used in previous studies (<5,000, 5,000-9,999, 10,000-49,999, and ≥50,000 parasites/μL). The recall period for history of fever was the past 48 hours and for taking an antimalarial drug was the past week. We defined current fever as an axillary temperature ≥37.5°C at the time of enrollment. We designated region using geographic clusters associated with different malaria ecotypes: western India as Gujarat, Mumbai, and Rajasthan, central India as Andhra Pradesh,
Chhattisgarh, Gadcharoli, Jharkhand, Madhya Pradesh, and Orissa, and northeast India as the Assam, Meghalaya, and West Bengal sites (85,115). Multiple ecotypes, each with different implications for both transmission intensity and malaria control strategy, exist within each of these broad regions (127). However, the categorization captures the dominant ecotype, e.g. forest malaria in central India, or agglomerates overlapping ecotypes of not so dissimilar transmission intensity as with rural, agricultural malaria and urban, migrant malaria in western India. Finer resolution was not possible without a loss of power. We classified season by month of enrollment: monsoon – June-August, post-monsoon – September-November, and winter – December and January.
Data analysis
44
fever, season, and asexual parasite density, had missing data. Missing gametocytemia data, due to withdrawal and loss to follow-up during the three-day treatment phase, was less than 3% of the overall sample. We calculated the prevalence of gametocytemia among levels of predictors and in the overall population. We collapsed categories of age and parasite density where the prevalence of gametocytemia was similar among adjoining groups. We also calculated the proportion of parasites that were gametocytes by dividing the enrollment gametocytemia by the sum of the enrollment gametocyte and asexual parasite densities. To calculate the proportion of the reservoir for potential transmission in each age category we first multiplied the mean geometric density of the maximum or the mean gametocytemia during day 0 through day 2 in the age category by the number of gametocytemic individuals in the age category. Conceptually, the result can be considered the gametocyte load of the age category. Second, we summed the gametocyte load of each age category to obtain the population gametocyte load. Third, we divided the gametocyte load of each age category by the total gametocyte load leading to the proportion of the reservoir for potential transmission represented by the age category. The use of transmission is qualified with the term
“potential” as our approach ignores differences in gametocyte infectivity (due to immunity) and vector biting rates (due to uncovered surface area, etc) between the age groups.
45
calculating the odds ratio. We selected among collinear variables (odds ratio > 3) based on their substantive value. We evaluated two-way interactions between all pairs of predictors and retained all product terms with P value < .25.
46 Study power
Assuming a gametocytemia prevalence of at least 10% and α = .25, we estimated more than 95% power in the study to detect risk factors prevalent among at least 7.5% of controls with a prevalence odds ratio of 2 or more.
Ethical clearance
The Scientific Advisory Committee of the National Institute of Malaria Research approved the original trials and the Institutional Review Board of the University of North Carolina approved the secondary analysis study.
RESULTS
During 2009 and 2010, 1,372 patients with P. falciparum malaria were recruited into therapeutic efficacy trials of antimalarial drugs. Among these patients, 19 voluntarily
withdrew, 3 received outside treatment, 2 contracted other illnesses, and 9 were lost to follow-up. After removing 4 patients who were missing gametocytemia data our complete case population was 1,335. The majority of the study population was, independently, adult, male, from central India, and enrolled in the post-monsoon (Table 1). The proportion of patients with gametocytemia on day 0, day 1, and day 2 was 13% (n=179), 15% (n=201), and 15% (n=203) respectively. Overall, the prevalence of gametocytemia, i.e. gametocytes
detected in blood films on any day from day 0 through day 2, was 19% (n=248) and this varied in relation to demographic and clinical classifications (Table 1). In the unadjusted bivariate associations, gametocytemia decreased with both increasing age and parasite density categories, while it increased among those without fever at enrollment or a history of fever prior to enrollment. Men and patients who reported yes or unknown previous
47
patients with gametocytemia varied by region and decreased along a western to eastern India axis.
The unadjusted prevalence of gametocytemia decreased from 26% (n=103) among ages 1-4 years to 14% (n=96) in those 50 years old or greater (Figure 1). Inversely, the proportion of the total parasite population consisting of gametocytes increased with age from 3% in 1-4 year olds to 8% in ages 50 or more years respectively. The average density,
represented by the geometric mean, of the maximum gametocytemia and mean
gametocytemia during days 0 through day 2 were 117 and 66 gametocytes/µL respectively. The density of gametocytes was higher in children compared to adults (Table 2) which was similar to the trend observed with enrollment asexual parasite density (data not shown). In unadjusted analysis, gametocyte densities were similar in western and central India but higher in northeast India in all age categories (Table 2). Adults (age 15 years or more), who were 54% of the study population and among whom 16% carried gametocytes, constituted approximately 44% of the reservoir for potential transmission. School-age children (age 5-15 years), who were 38% of the study population and among whom 20% carried gametocytes, constituted approximately 44% of the reservoir for potential transmission. Young children (age less than 5 years), who were 8% of the study population and among who 27% carried gametocytes, constituted approximately 12% of the reservoir for potential transmission. These estimates did not differ by region except for northeast India where the relative contributions of school-age children and younger children were reversed compared to other regions. These estimates also did not differ whether the maximum or mean gametocyte density was used.
48
simplified model age, sex, region, and previous antimalarial intake alone provided similar predictive ability and model fit (P value = .32) (Table S1). Possible risk scores ranged from 0 to 65 although the minimum and maximum observed score were 0 and 45 respectively. The median risk score was 14 (interquartile range: 10, 28). Residing in the western region was the highest scoring predictor with 28 points while age 5-14 years and male sex were the lowest scoring predictors receiving 4 points each. No cut-point yielded a sensitivity greater than 75% and a specificity lower than 75%. For example, if the goal of a control programme was to treat at least 90% of gametocyte carriers, a risk score of 14 or more provided 91% (95%CI: 88, 95) sensitivity and 33% (95%CI: 31, 36) specificity (Table 4). Applied in our study population of 1,335 patients of whom 248 were gametocytemic, 71% of the population would receive treatment with 22 false negatives and 723 false positives. The area under the ROC curve for predicting gametocytemia was 0.76 (95%CI: 0.73, 0.80) (Figure 2). For comparison, the AUC of the model using all predictors was 0.79 with 2-way interactions and 0.82 with all possible interactions.
DISCUSSION
We observed a high prevalence of gametocytemia in India and adults constituted a substantial proportion of the reservoir for potential transmission in our sampled population. While a predictive model for gametocytemia identified several easily screened risk factors, the ability of the clinical algorithm to sensitively and specifically detect gametocytemia was low.
We observed a higher prevalence of gametocytemia than previously reported