NEUROCOGNITIVE INVESTIGATION OF IMMEDIATE REWARD SELECTION BIAS, A PUTATIVE INTERMEDIATE PHENOTYPE FOR ALCOHOL USE DISORDERS
Christopher T. Smith
A dissertation submitted to the faculty of the University of North Carolina at Chapel Hill in partial fulfillment of the requirements for the degree of Doctor of Philosophy in the Curriculum of Neurobiology.
Chapel Hill 2014
Approved by:
ii
©2014
iii ABSTRACT
CHRISTOPHER T. SMITH: Neurocognitive Investigation of Immediate Reward Selection Bias, A Putative Intermediate Phenotype for Alcohol Use Disorders
(Under the direction of Charlotte A. Boettiger)
Immediate reward selection (or “Now”) bias is defined as the tendency for individuals to preferentially select a smaller, sooner reward over a larger, later reward in a delay discounting task. This behavior has been suggested as an intermediate behavioral phenotype for alcohol use disorders (AUDs). While Now bias has been shown to be elevated in individuals with AUDs, we provide additional support for Now bias as an intermediate phenotype for AUDs by showing it is enhanced in heavy drinking adults (ages 26-40) with no reported AUDs. Furthermore, we found that Now bias is elevated in light drinking adults with at least one first degree relative with an AUD, a key criterion in categorizing a behavior as an intermediate phenotype.
iv
v
ACKNOWLEDGEMENTS
vi
I also need to extend my appreciation to my dissertation committee for offering useful insights into my work. Drs. Gabriel Dichter, Fulton Crews, Regina Carelli, and Weili Lin have all offered encouragement and advice to me over the years and helped me shape the current format of this dissertation work. My thanks also must be extended to the many UNC undergraduate students who assisted with my work over the years. I need to also acknowledge the undergraduate research experience I received as a student at Furman University. Specifically, Dr. Judith E. Grisel (now at Bucknell University) was instrumental in inspiring me to pursue graduate school and a career in neuroscience. All the faculty of Furman University’s psychology department and neuroscience program, including Drs. Onarae Rice, John Batson, Charles Brewer, Gilles Einstein, and William Blaker, promoted the development of the critical thinking and analytical skills that have served me well in the pursuit of my PhD and will continue to aid me in my academic career.
vii PREFACE
Chapter 2 of this work has been previously published as follows:
Smith CT, Boettiger CA (2012). Age modulates the effect of COMT genotype on delay discounting behavior. Psychopharmacology, 222 (4), 609-617.
Permission to include the article in its entirety in a PhD dissertation was retained from Springer Science+Business Media. License Number 3357090601487 for use of this material was secured through Copyright Clearance Center as detailed by Springer at
viii
TABLE OF CONTENTS
LIST OF TABLES ...x
LIST OF FIGURES ... xi
LIST OF ABBREVIATIONS ... xii
CHAPTER 1: GENERAL INTRODUCTION ... 1
CHAPTER 2: AGE MODULATES THE EFFECT OF COMT GENOTYPE ON DELAY DISCOUNTING BEHAVIOR ...15
Introduction ... 15
Methods... 17
Results ... 20
Discussion ... 25
CHAPTER 3: INTERTEMPORAL CHOICE BEHAVIOR IN EMERGING ADULTS AND ADULTS: EFFECTS OF AGE INTERACT WITH ALCOHOL USE AND FAMILY HISTORY STATUS ...32
Introduction ... 32
Methods... 34
Results ... 39
Discussion ... 56
CHAPTER 4: OVARIAN CYCLE EFFECTS ON IMMEDIATE REWARD BIAS IN HUMANS: A ROLE FOR ESTRADIOL ...63
Introduction ... 63
Methods... 64
ix
x
LIST OF TABLES
Table 2.1: Demographic data by age group ... 21 Table 2.2: COMT genotype groups: demographics and task performance ... 22 Table 3.1: Demographic, substance use, and psychometric data by age recruitment group ... 40 Table 3.2: Demographic, substance use, and psychometric data by AUDIT recruitment group . 41 Table 3.3: Demographic, Substance Use Related, and Psychometrics Measures Across Age and AUDIT groups ...42 Table 3.4: Demographic, Substance Use Related, and Psychometrics Measures Across Age and High/Low AUDIT groups ... 44 Table 3.5: Delay Discounting Task Behavioral Measures Across Age and
xi
LIST OF FIGURES
Figure 1.1: Overview of Delay Discounting (DD) Task... 8
Figure 1.2: Expected versus invalid DD task reaction time patterns. ... 9
Figure 2.1: Age interacts with COMT genotype to influence impulsive decision-making. ... 23
Figure 2.2: Comparison of reward magnitude discounting functions... 25
Figure 2.3: Model depicting hypothetical regulation of impulsive choice by frontal dopamine. . 27
Figure 3.1: Systematic analysis of adult age cutoff on ICR age group effects among moderate drinkers. ... 38
Figure 3.2: Interacting effects of age and alcohol use on delay discounting behavior. ... 43
Figure 3.3: Interacting effects of age and alcohol consumption on delay discounting behavior.. 50
Figure 3.4: Family history of alcohol use disorders is associated with greater Now bias in light/moderate drinking adults but not emerging adults. ... 54
Figure 4.1: Immediate reward (Now) bias declines from early to mid-cycle. ... 70
Figure 4.2: Now bias declines at mid-cycle when estradiol (E+) rises at mid cycle... 71
Figure 4.3: Change in ICR from early to mid-cycle is proportional to the change in E+ and driven by low putatively lower tonic frontal dopamine COMTVal carriers. ... 72
Figure 5.1: Low levels of DA synthesis capacity in bilateral putamen are associated with high ICR when controlling for COMT genotype. ... 87
Figure 5.2: In late adolescents, high ICR is associated with the DAT 10/10 repeat allele, not COMT genotype. ... 88
xii
LIST OF ABBREVIATIONS
ADHD attention deficit hyperactivity disorder
ALLO allopregnanolone
AUC area under the curve
AUD alcohol use disorder
AUDIT alcohol use disorders identification test
AUDIT-c alcohol use disorders identification test consumption subscale
BIS Barratt impulsivity scale
BOLD blood oxygenation level-dependent COMT catechol-O-methyltransferase enzyme COMT catechol-O-methyltransferase gene
CON control (SOONER, LARGER) trial types in delay discounting task
d′ d-prime
DA dopamine
DAST drug abuse screening test
DAT dopamine transporter
DD delay discounting
dPFC dorsal prefrontal cortex dlPFC dorsolateral prefrontal cortex DRD1 D1-type dopamine receptor DRD2 D2-type dopamine receptor DRD3 D3-type dopamine receptor DRD4 D4-type dopamine receptor
DSM Diagnostic and Statistical Manual of Mental Disorders DUSI drug use screening inventory
DW DON’T WANT trial type in delay discounting task
E+ estradiol
FH family history
FHN family history positive for alcohol use disorder FHP family history positive for alcohol use disorder fMRI functional magnetic resonance imaging
xiii
FP follicular phase of menstrual cycle FTPI future time perspective inventory FTQ family tree questionnaire
iICR inferred ICR
ICR impulsive choice ratio
LOC Rotter’s locus of control scale LP luteal phase of menstrual cycle
MM motor mismatch
MP menstrual phase of menstrual cycle MRI magnetic resonance imaging
NAS neuroactive steroid
OFC orbitofrontal cortex
PET positron emission tomography
PFC prefrontal cortex
PROG progesterone
RAPI Rutger’s alcohol problem index
RT reaction time
SES socioeconomic status
SNP single nucleotide polymorphism
SPM statistical parametric mapping SUD substance use disorder
TMS transcranial magnetic stimulation VNTR variable number of tandem repeat
W WANT trial type in delay discounting task
1
CHAPTER 1: GENERAL INTRODUCTION
Intermediate phenotypes and the study of complex psychiatric disorders
2
(SUDs) are also complex disorders with heritability estimates ranging from 40 to 60% (Heath et al., 2001; Verweij et al., 2010; Bierut, 2011; Agrawal et al., 2012), the identification of intermediate phenotypes associated with risk for these disorders is a growing focus of recent research (Karoly et al., 2013). Behavioral candidates for SUD intermediate phenotypes include reduced response inhibition (Acheson et al., 2011a; Norman et al., 2011), increased risk taking behavior (Cservenka and Nagel, 2012; Schneider et al., 2012), aberrant reward responsivity (Wrase et al., 2007; Andrews et al., 2011), and increased discounting of delayed monetary rewards (Mitchell et al., 2005; Boettiger et al., 2007; Claus et al., 2011; MacKillop et al., 2011; MacKillop, 2013).
Criteria for categorizing a behavior as an intermediate phenotype
3
should have good psychometric properties as it must be reliably measurable to be a useful diagnostic. Third, the phenotype needs to be related to the disorder and its symptoms in the general population (i.e., cognitive deficits associated with dlPFC function and schizophrenia). Fourth, the phenotype should be stable over time in that it can be measured consistently with repeated testing, potentially to assess treatment effects. Fifth, the behavior should show increased expression in unaffected relatives of those with the disorder as highlighted by Egan et al. (2001), above. Sixth, the phenotype should co-segregate with the disorder in families in that a family member with the disorder should show the behavior or trait to a greater degree than an unaffected sibling and that this unaffected sibling should display the trait to a greater degree than a distant unaffected relative. Finally, the phenotype should have common genetic influences with the disorder. For example, as schizophrenia is associated with poor performance (and dlPFC hyperactivity) on executive function tasks, genes affecting dlPFC activity and executive functions such as COMT should explain variation in schizophrenia risk ( see Egan et al., 2001). A common factor in many of the criteria for categorizing a behavior or trait as an intermediate phenotype is that the trait or behavior itself be partially heritable and genetically mediated.
Immediate reward selection bias as an intermediate phenotype for alcohol use disorders
4
supersedes waiting for a larger, delayed reward in the future (Rachlin and Green, 1972; Mazur, 1987). This behavior has been suggested to display many of the necessary criteria of an intermediate phenotype for a variety of neurobehavioral disorders including substance use disorders (SUDs) (Becker and Murphy, 1988; Reynolds, 2006; Perry and Carroll, 2008; Rogers et al., 2010), attention deficit hyperactivity disorder (Barkley et al., 2001; Sonuga-Barke et al., 2008; Paloyelis et al., 2010), and pathological gambling (Alessi and Petry, 2003; Leeman and Potenza, 2012). As these behaviors often co-occur, they may share similar biological and genetic components (Wilens, 2007; Leeman and Potenza, 2012).
5
Under-investigated criteria for Now bias as an intermediate phenotype for AUDs
As Now bias is elevated in those with AUDs, we might expect to see this behavior heightened in those on a trajectory toward an AUD as well. Such demonstrations between elevated Now bias and AUD risk would add greatly to the utility of Now bias as an intermediate phenotype. As problematic alcohol use during the emerging adulthood may predict development of an AUD later in life (O'Neill et al., 2001; Merline et al., 2008; Dick et al., 2011), though many individuals mature out of problematic use (Bartholow et al., 2003; Costanzo et al., 2007; Lee et al., 2013), one might expect Now bias is enriched in problematic drinking emerging adults. Only one relatively small behavior study has looked at such a relationship with Now bias observed to be heightened among heavy versus lighter social drinking college students (Vuchinich and Simpson, 1998). This finding requires replication in a larger, more diverse sample as Vuchinich and Simpson (1998) focused on students with an average age of 19 to 20.
6
2010). In these previous studies, the effects of family history on Now bias was either only observed in females (Petry et al., 2002), was not found at all (Crean et al., 2002; Herting et al., 2010), or was not present when controlling for group differences in IQ and antisocial behavior (Acheson et al., 2011b). Measuring Now bias behavior in individuals with any first degree relatives with AUDs expands the classic family history positive AUD definition to include siblings, who display greater genetic concordance with a particular individual than their parents. To our knowledge, though, this definition of first degree family member positive or negative for AUDs has not been applied to the study of Now bias. Thus, while Now bias possesses many properties that suggest it could be a good intermediate phenotype for AUDs, further investigation of this possibility is warranted, particularly work focusing on examining whether Now bias is elevated in unaffected individuals with first degree relatives with AUDs.
Biological basis of Now bias – role of genetics and frontal dopamine
7
al., 1998; Kaenmaki et al., 2010) and humans (Chen et al., 2004; Slifstein et al., 2008; Wu et al., 2012). A single nucleotide polymorphism (Val158Met SNP) in the gene encoding the COMT enzyme results in higher tonic PFC but not striatal DA levels in those with the COMT Met/Met SNP (Wu et al., 2012). Recently, Kelm and Boettiger (2013) found that accounting for COMT Val158Met genotype (hence referred to as COMT genotype) explained substantial variance in the effects of DA depletion on Now bias, emphasizing the critical role of this SNP in mediating dopaminergic modulation of Now bias. Earlier investigations of the role of COMT genotype in Now bias behavior have produced conflicting results, however (Boettiger et al., 2007; Paloyelis et al., 2010). Paloyelis et al. (2010) found greater Now bias in Met/Met individuals, and Boettiger et al. (2007) found that COMT Val/Val individuals displayed greater Now bias. Further exploration of the role of COMT genotype is needed to resolve these seemingly divergent findings.
Quantifying Now bias behavior using Impulsive choice ratio
8
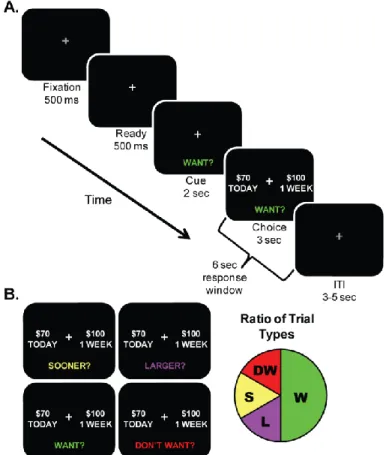
Figure 1.1: Overview of Delay Discounting (DD) Task. A. Order of events presented to participants during our delayed-discounting task. Participants are instructed to choose between two hypothetical monetary amounts: a smaller amount available Today (NOW) or a larger amount available at a delay in the future (LATER) based on the question prompt presented at the bottom of the screen. B. Question prompt types: SOONER?, LARGER?, WANT?, DON’T WANT? The proportion of question prompts presented over the course of the task is illustrated in the pie chart with WANT? trials occurring 50% of the time. From participants’ WANT? trial responses, we calculate impulsive choice ration (ICR), the main dependent measure of Now bias in our studies. ICR is the ratio of Today WANT responses selected over the total WANT responses selected by each participant.
9
This task has several methodological advantages to more common adjusting amount procedures (Madden et al., 1997; Richards et al., 1999) used to calculate individual indifference points for each participant. First, our task’s control conditions allow us to remove participants not performing our task as instructed. Most discounting tasks employing only WANT choice prompts have no way to identify participants failing to follow task instructions. Using the discounting task employed here, each individual’s reaction times (RTs) for all trial types can be plotted to determine whether they are actively evaluating the two choices during our W condition (Figure 1.2).
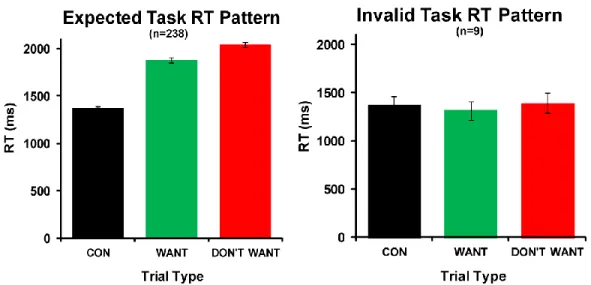
Figure 1.2: Expected versus invalid DD task reaction time patterns. Plots of expected and improper reaction time (RT) patterns from 247 participants completing the delay-discounting task used in our studies. RT for control trials are expected to be faster than for WANT and DON’T WANT trials. In addition, WANT RT is expected to be faster than DON’T WANT RT. Of the 247 participants data depicted here, ~96.4% (n=238) performed the task as expected with the remaining ~3.8% (n=9) not performing the task as expected. Participants with the invalid task RT pattern are excluded from our analyses. RT, reaction time; CON, Control (SOONER/LARGER) Trials
10
task as intended versus those responding reflexively and inconsistently during the task. Also, by randomly varying the delayed amount, time, and question trial types, this task allows participants to make their choices with less interference from previous choices. This differs from adjusting amount procedures where choices are titrated based on participants choices in such a way as to push them to more likely select the option they did not select previously (switching from Now to Later choices or vice versa by increasing the delayed amount or decreasing the delay time, for example). Thus, the task employed in the following studies allows for a more robust and consistent measurement of Now bias behavior by identifying participants not following task instructions and reduces biasing participants responses in the WANT condition by intermixing it with other choice conditions. As this task is also compatible with neuroimaging techniques (Boettiger et al., 2007; Boettiger et al., 2009), it easily also allows for investigation of the neural correlates of discounting behavior, an important future direction of the currently presented work. Importantly, ICR is highly correlated with a more traditional measure of delay discounting, k (Mitchell et al., 2005). In Mitchell et al. (2005), k was derived from the cumulative dollar ratio (CDR) for each delay time (D) according to the following equation (Mazur, 1987): CDR = 1/(1+kD) and taking the mean k across delay times. The model-free nature of ICR allows for the measurement of Now bias across a range of individuals whose subjective choice patterns may not conform to the selected discounting function, of which several have been proposed (Takahashi et al., 2008).
Rational for aims of current studies
11
2). We hypothesized that due to age related declines in DA signaling (Mukherjee et al., 2002; Wahlstrom et al., 2010) and increases in COMT expression with age (Tunbridge et al., 2007) that COMT-related effects on Now bias may vary as a function of age. As the age range in Paloyelis et al. (2010) was 11 to 20 (average age 15.4±2) while Boettiger et al.’s (2007) average participant’s age was 28.3±5.8, we reasoned age-related changes in tonic DA were the most parsimonious explanation for the divergent findings across these two studies. We recruited equal numbers of 18-21 and 22-40 year olds, determined their COMT genotype, and measured their Now bias behavior. We expected to find that Now bias was elevated in COMT Met/Met 18-21 year olds close in age to Paloyelis et al. (2010) and elevated in COMT Val/Val 22-40 year olds with a similar average age to Boettiger et al. (2007). We expected that taking into account age-related differences in DA tone across our groups, we could explain Now bias behavior across age and COMT groups via an inverted-U model.
12
across a group of 18-40 year old social drinkers not reporting any AUD. We hypothesized that Now bias would be elevated in high but not low AUDIT emerging adults (defined as 18-21 or 18-24). Furthermore, we sought to test whether Now bias was elevated in those otherwise unaffected individuals (light/moderate social drinkers; low AUDIT) with a first degree relative with an AUD. We used the intermediate phenotype criteria of first degree biological relative status (father, mother, or sibling with AUD), excluding those with mothers with an AUD to rule out potential fetal alcohol effects. We hypothesized that Now bias would be elevated in low AUDIT individuals with a first degree relative with an AUD but not in those with no first degree AUD relative.
Proposed inverted-U function explaining role of PFC DA on Now bias
13
2005) and show heightened activity with increasing task difficulty (Braver et al., 1997; Manoach et al., 1997). At least one study has suggested that working memory is negatively correlated with Now bias (Shamosh et al., 2008) and depletion of DA effects on working memory performance correlated with its effects on Now bias (Kelm and Boettiger, 2013). Thus, examining the role of PFC DA on Now bias according to models from the working memory literature seemed to be an important concept to probe further. Specifically, we hypothesized that the elevated Now bias associated with inefficient PFC function (Boettiger et al., 2007) could be partially explained by PFC DA levels according to an inverted-U model with insufficient or excess PFC DA resulting in elevated Now bias.
Testing the inverted-U model as a predictor of Now bias behavior change
14
15
CHAPTER 2: AGE MODULATES THE EFFECT OF COMT GENOTYPE ON DELAY
DISCOUNTING BEHAVIOR1
INTRODUCTION
Humans and other animals tend to discount the value of delayed, relative to immediate rewards, a phenomenon known as delay-discounting (Ainslie, 1975; Mazur, 1987; Frederick et al., 2002; Green and Myerson, 2004). Delay-discounting is heightened among individuals with a history of substance use disorders (Bickel and Marsch, 2001; Reynolds, 2006), as well as other impulse control disorders, such as attention deficit/hyperactivity disorder (ADHD) (Sagvolden and Sergeant, 1998; Winstanley et al., 2006; Paloyelis et al., 2009). Such immediate reward bias represents one facet of the multi-dimensional construct of impulsivity (Evenden, 1999). A variety of evidence links delay-discounting to dopamine (DA) and DA-modulated frontostriatal circuits (Boettiger et al., 2007; Doya, 2008; Kobayashi and Schultz, 2008; Lee et al., 2009; Paloyelis et al., 2010; Pine et al., 2010; Altamirano et al., 2011; Adriani et al., 2012). Such evidence includes data showing that variation in the gene encoding catechol-O-methyltransferase (COMT) is associated with differences in the tendency to choose immediate over delayed rewards (Boettiger et al., 2007; Paloyelis et al., 2010). COMT is an enzyme that regulates DA levels in the prefrontal cortex (Gogos et al., 1998; Tunbridge et al., 2004; Yavich et al., 2007;
1 The data and text for this chapter are published as: Smith and Boettiger (2012). Age modulates
the effect of COMT genotype on delay discounting behavior. Psychopharmacology, 222 (4), 609-617. Erratum of originally-reported CON and WANT RT can be found in
16
Kaenmaki et al., 2010), where it is the primary regulator of DA levels (Karoum et al., 1994; Kaenmaki et al., 2010). A polymorphism in the COMT gene (COMT Val158Met; rs4680) causing a valine (Val)-to-methionine (Met) substitution at codon 158 results in a 4-fold reduction of COMT enzymatic activity (Lachman et al., 1996), which is presumed to result in reduced cortical DA in Val/Val homozygotes relative to the Met/Met genotype (Chen et al., 2004).
17
declines. Specifically, we hypothesized that the effects of genetically determined variation in COMT function on delay-discounting behavior are oppositely modulated by age, specifically from late adolescence to young adulthood. To test this hypothesis, we genotyped late adolescent and adult participants for the COMT Val158Met polymorphism, measured their delay-discounting behavior, and tested for interacting effects of age group and COMT genotype on discounting behavior. As cognitive studies commonly consider participants 18 and over to be adults, we were particularly interested in testing this hypothesis in late adolescents that are frequently assumed to be adults (ages 18-21 years).
METHODS
Subjects
18
was collected via a questionnaire and quantified as Hollingshead socioeconomic status SES scores (Hollingshead, 1975). Participants gave written informed consent, as approved by the UNC Office of Human Research Ethics. Subjects received monetary compensation for participating.
Delay Discounting Task
19
concern if such effects varied with age or genotype. These concerns can be dismissed on the basis of the following analyses. First, a repeated measures ANOVA found no significant effect of block number on ICR (F(7, 917) = 0.49, p = 0.84), nor any significant ICR by block interaction with age (F(7, 917) = 0.31, p = 0.95) or genotype (F(14, 917) = 0.22, p = 1). Second, when we calculated the split-half ICR for odd and even blocks, the correlation across all subjects was r = 0.98 (p < 0.001). Similarly, the correlation between first half ICR and second half ICR was r=0.96 (p < 0.001). Finally, for the sample as a whole, Cronbach’s 0.99. Furthermore, Cronbach’s was also 0.99 when calculated separately for each age group and each genotype. We note that these reliability measures are well above the standard criterion for adequate reliability of 0.70 (Kline, 2000).
Genotyping
COMT Val158Met (rs4680) genotyping was performed on DNA extracted from saliva samples (DNA Genotek, Kanata, Ontario, Canada) using TaqMan technology (Applied Biosystems, Foster City, CA), as described previously (Boettiger et al., 2007). Genotyping was performed by the UNC Mammalian Genotyping Core and/or the Duke Center for Human Genetics. Genotyping was performed in duplicate for n=42 samples and compared to ensure validity of the data. The genotype concordance rate was 100% both within (n = 42) and across (n = 32) genotyping facilities. Allele frequencies in this sample did not deviate from Hardy– Weinberg equilibrium (2 = 0.098, df = 2, p = 0.95).
Data Analysis
20
separately according to delay time and delayed amount, here we focus on the ratio collapsed across all W trials.
To test the significance of across group comparisons, we used unpaired two-tailed t-tests for continuous measures and tests for categorical measures. For multi-factorial comparisons, we used regular or mixed repeated measures ANOVA in SPSS (SPSS Inc., Chicago, IL), with age group and genotype as between subjects factors. When necessary, a Greenhouse-Geisser non-sphericity correction was applied. Post-hoc paired comparisons were performed where indicated using two-tailed t-tests. When data were not normally distributed, appropriate arcsine-root transformations were applied in Excel (Microsoft Corp., Redmond, WA) prior to making statistical comparisons to ensure the validity of parametric statistical tests. Simple regression analyses were performed in SPSS.
RESULTS
Demographic and psychometric data
21 Table 2.1: Demographic data by age group
Late Adolescent (ages 18-21)
(n = 72)
Adult (ages 22-40)
(n = 70)
t(140) p value
Age (yrs) 20 ± 1 27 ± 5 11.53 <0.001
Education (yrs) 14 ± 1 17 ± 2 11.90 <0.001
Subject Hollingshead SES Parent Hollingshead SES
40 ± 3 54 ± 9
47 ± 7 54 ± 11
7.49 <0.001 0.13 ns
Sex (% female) 53 54 ns†
Ethnicity (% white) 62 66 ns†
Black (%) 13 19 ns†
Hispanic (%) 4 4 ns†
Asian (%) 14 7 ns†
Other/mixed (%) 7 4 ns†
AUDIT score 8.9 ± 6.3 7.2 ± 4.1 1.99 0.049
Values are reported as mean ± standard deviation. Reported p-values reflect the results of unpaired two-tailed comparisons between groups. Exact p-values reported unless p < 0.001. AUDIT, Alcohol Use Disorders Identification Test; SES, socioeconomic status. †p-value represents results of χ2
test.
Interaction between age and COMT genotype on frequency of impulsive choices
22
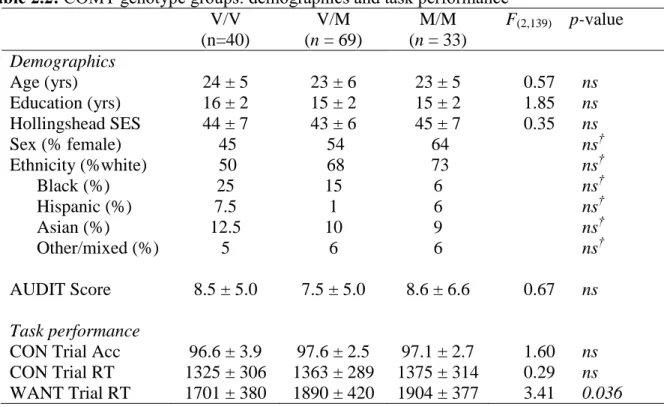
delay discounting, as sex-dependent effects on COMT enzyme activity have been reported (Chen et al., 2004). We included SES, alcohol use (AUDIT score), and WANT trial reaction time as covariates due to the fact that we observed significant differences in SES and AUDIT scores between our age groups (Table 2.1) and WANT trial RT between our COMT groups (Table 2.2).
Table 2.2: COMT genotype groups: demographics and task performance
V/V (n=40)
V/M (n = 69)
M/M (n = 33)
F(2,139) p-value Demographics
Age (yrs) 24 ± 5 23 ± 6 23 ± 5 0.57 ns
Education (yrs) 16 ± 2 15 ± 2 15 ± 2 1.85 ns Hollingshead SES 44 ± 7 43 ± 6 45 ± 7 0.35 ns
Sex (% female) 45 54 64 ns†
Ethnicity (%white) 50 68 73 ns†
Black (%) 25 15 6 ns†
Hispanic (%) 7.5 1 6 ns†
Asian (%) 12.5 10 9 ns†
Other/mixed (%) 5 6 6 ns† AUDIT Score
Task performance
8.5 ± 5.0 7.5 ± 5.0 8.6 ± 6.6 0.67 ns
CON Trial Acc 96.6 ± 3.9 97.6 ± 2.5 97.1 ± 2.7 1.60 ns CON Trial RT
WANT Trial RT
1325 ± 306 1701 ± 380
1363 ± 289 1890 ± 420
1375 ± 314 1904 ± 377
0.29 ns 3.41 0.036
Values are reported as mean ± standard deviation. Reported p-values reflect the results of unpaired two-tailed comparisons between groups. Exact p-values reported unless p < 0.001. Acc, accuracy; AUDIT, Alcohol Use Disorders Identification Test; COMT, catechol-O-methyltransferase; CON, control; M/M, methionine/methionine; RT, reaction time; SES, socioeconomic status V/M, valine/methionine; V/V, valine/valine. †p-value represents results of χ2
test.
In a 2×2×3 ANOVA (age group × COMT genotype × sex), we did not detect significant main effects of age group (F(1, 127) = 0.81, p = 0.371, η2
23
group (F(2, 127) = 0.43, p = 0.650, η2 = 0.006). In contrast, consistent with our hypothesis, there was a significant age-by-COMT Val158Met interaction effect on delay-discounting behavior. (F(2, 127) = 5.12, p= 0.007, η2 = 0.069; Figure 2.1). We also detected a smaller interactive effect between sex and age-group (F(1, 127) = 4.03, p = 0.047, η2 = 0.027).
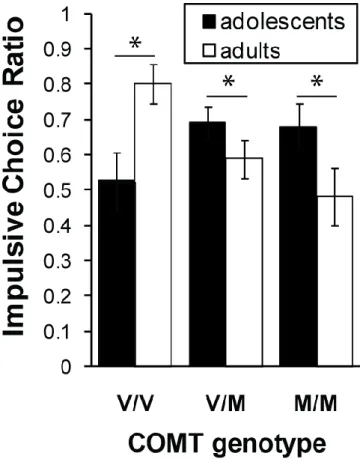
Figure 2.1: Age interacts with COMT genotype to influence impulsive decision-making. (a) Plot of impulsive choice ratio (ICR) as a function of COMT genotype, showing a significant age by genotype interaction (F(2,127) = 5.12, p=0.007). This effect reflects significant age-related changes in ICR for all three genotypes. M/M, methionine/methionine; V/M, valine/methionine; V/V, valine/valine. *p < 0.05.
24
p = 0.21, η2
= 0.065), likely due to the heterogeneity within this smaller group. This interaction effect reflects a significant age-related increase in delay-discounting among Val-homozygotes (t(38) = 2.48, p = 0.018) and a significant age-related decline in delay-discounting among both Met-homozygotes (t(31) = 2.20, p = 0.036) and COMT Val158Met heterozygotes (t(67) = 2.01, p = 0.048). Considering age as a continuous variable, we observed a negative correlation between age and ICR among Met-allele carriers (r = -0.31, p = 0.001). In contrast, among Val/Val individuals we observed a significant positive correlation between age and ICR (r = 0.32, p = 0.047).
While we have previously reported that choice behavior in this task does not correlate with education or SES (Mitchell et al., 2005; Mitchell et al., 2007), the present study included a somewhat younger demographic. Thus, we carried out bivariate correlations to assess whether demographic factors predicted decision-making behavior in this cohort of participants. We found that the tendency to choose a smaller immediate reward did not correlate with years of education (r = 0.09, t = 1.04, p = 0.299). Similarly, SES was not significantly correlated with ICR (r = -0.14, t = -1.66, p=0.1). We also observed no correlation between age and ICR (r = -0.14, t = -1.62, p = 0.107), which is not unexpected based on the opposing age effects for Met-carriers and Val homozygotes.
25
2.2) as shown by a 3-way ANOVA (delayed reward amount × age group × genotype), which found a significant main effect of delayed reward amount (F(2.15, 292.96) = 146.24, p < 0.001, η2 = 0.512).
Figure 2.2: Comparison of reward magnitude discounting functions. Semi-log plot of ICR as a function of the delayed reward amount. Data reflect mean ± SEM. Curves represent logarithmic fit the group averaged data.
We did not observe significant interactions between delayed reward amount and either age group (F(2.15, 292.96) = 0.79, p = 0.465, η2 = 0.003) or genotype (F(4.31, 292.96) = 0.67, p = 0.624, η2
= 0.005). Likewise, we observed no significant three-way interaction (F(4.31, 292.96) = 0.66, p = 0.632, η2
= 0.005). Thus the genotype × age group interaction that we observed does not appear to be specific to certain magnitudes of reward.
DISCUSSION
26
Paloyelis et al. (2010) showing enhanced delay-discounting among COMT Val158Met Met/Met adolescent males. Furthermore, as our study included females and found no main effects of sex, nor any interaction of sex with our genotype by age effect, these data extend the previous finding in adolescent males of Paloyelis et al. (2010) to late adolescent females.
Relationship between alcohol use and delay-discounting
We previously found a significant positive relationship between ICR and alcohol use in studies including both control subjects and those with a history of alcoholism (Mitchell et al., 2005; Boettiger et al., 2007; Mitchell et al., 2007). We have also reported a positive correlation between ICR and the dependence and harm subscales of the AUDIT (Mitchell et al. 2005). However, consistent with the present data, we have not found a significant relationship between ICR and AUDIT scores in studies restricted to those with no history of alcoholism (Altamirano et al., 2011). This discrepancy may reflect inadequate power to detect an effect due to insufficient variance in AUDIT dependence and harm scores in samples excluding AUDs. For example, the median AUDIT dependence and harm score here was 2 (interquartile range: 1 - 4.75). In contrast, the median in Mitchell, et al. (2005) was the same, but the interquartile range was more >3× larger (0.75 - 16). Alternatively, the relationship between ICR and AUDIT may be weak.
Cortical dopamine regulation of delay-discounting
27
more delay-discounting relative to late adolescent Val/Val individuals. To account for both the adolescent and adult data we report, we propose a single U-shaped model of the relationship between frontal DA levels and impulsive choice (Figure 2.3).
Figure 2.3: Model depicting hypothetical regulation of impulsive choice by frontal dopamine.
Closed symbols represent adolescents, whole open symbols represent adults. Arrows indicate the effects of a developmental decline in frontal dopamine function for each genotype. Model posits that reduced frontal DA signaling in adulthood relative to late adolescence results in opposing effects on impulsive choice that vary with COMT genotype, based on an underlying U-shaped relationship. An age-dependent drop in frontal DA signaling in Val/Val individuals is predicted to yield greater ICR in adults relative to adolescents. In contrast, an equivalent age-dependent drop in frontal DA signaling is predicted to result in reduced ICR in Met-carrier adults relative to adolescents. For simplicity, equivalent declines in frontal DA signaling are proposed for all COMT genotypes, although differential changes may occur. COMT, catechol-O-methyltransferase; DA, dopamine; M/M, methionine/methionine; V/M, valine/methionine; V/V, valine/valine.
U-28
shaped relationship. Specifically, an age-dependent drop in frontal DA signaling in Val/Val individuals yields greater ICR in adults relative to adolescents. In contrast, an equivalent age-dependent drop in frontal DA signaling results in reduced delay-discounting in Met-carrier adults relative to adolescents. For simplicity, we have proposed equivalent declines in frontal DA signaling across COMT genotypes; however, developmental declines in frontal DA signaling may vary by COMT genotype. Support for this possibility comes from recent data showing COMT Val158Met genotype-dependent methylation resulting in reduced Val allele expression (Ursini et al., 2011). Developmental regulation of methylation is one mechanism by which declines in frontal DA signaling could vary by COMT genotype. An important prediction of this model is that within typical “healthy young adult” samples (ages18-40), the admixture of late adolescents and young adults would tend to obscure COMT genotype effects. While this model is currently hypothetical, future PET studies may test the validity of this U-shape model of the effects of age-dependent differences in frontal DA signaling on impulsive choice.
29
Broader implications of age-dependent differences in COMT genotype effects
In addition to playing a role in modulating impulsive choice, the Val/Val genotype is also associated with poorer performance on executive tasks and greater frontal activation relative to Met-carriers (Egan et al., 2001; Blasi et al., 2005; Minzenberg et al., 2006; Winterer et al., 2006a; Winterer et al., 2006b; Tan et al., 2007), which is thought to reflect frontal processing inefficiency, particularly during tasks requiring maintenance of stable representations (Bilder et al., 2004; Nolan et al., 2004; Tunbridge et al., 2006). However, published data regarding the role of the COMT Val158Met genotype in cognition is mixed (Barnett et al., 2008; Dennis et al., 2010). Thus, in addition to reconciling the literature regarding the effect of COMT Val158Met genotype on delay-discounting behavior, these data also suggest an explanation for discrepancies in the literature regarding COMT genotype effects on executive function.
We note that the present study was cross-sectional in nature; a prospective study is required to determine whether the age modulation of COMT genotype effects on discounting reflects developmental processes. Such processes may specifically affect delay-discounting behavior or may also impact linked behaviors, such as working memory (Shamosh and Gray, 2008; Shamosh et al., 2008). Specificity of underlying neural circuits may result in task-dependent sensitivity to frontal DA levels, whereby the optimal level for certain tasks is sub-optimal for other tasks (Cools and Robbins, 2004; Nolan et al., 2004). Moreover, frontal circuit maturation remains incomplete until the early-to-mid twenties (Sowell et al., 1999; Casey et al., 2000; Sowell et al., 2001; Giedd, 2004; Gogtay et al., 2004; Lenroot and Giedd, 2006),, and components of this circuitry critical for particular tasks may mature at different rates.
30
Implications for effects of manipulating DA signaling
As noted earlier, several measures of frontal DA signaling decrease from adolescence to adulthood (see (Wahlstrom et al., 2010) for recent review). COMT expression increases across the lifespan in humans (Tunbridge et al., 2007), which should result in an age-dependent decrement in frontal DA. An important implication of the age-dependent differences in COMT genotype effects on delay-discounting is that accounting for both age and COMT genotype may be required to accurately predict the effects of medications that alter frontal DA. Relevant clinical disorders are those associated with impaired frontal DA function, such as schizophrenia, addiction, and ADHD. As these disorders frequently onset in late adolescence (or sooner, in the case of ADHD), understanding how age may impact medication response could help to optimize clinical outcomes for these conditions.
Study limitations
31
32
CHAPTER 3: INTERTEMPORAL CHOICE BEHAVIOR IN EMERGING ADULTS AND ADULTS: EFFECTS OF AGE INTERACT WITH ALCOHOL USE AND FAMILY
HISTORY STATUS
INTRODUCTION
Adults with addictive disorders, including alcohol use disorders (AUDs), tend to choose smaller, sooner over larger, delayed rewards in the context of delay-discounting (DD) tasks more frequently than do adults with no addiction history (Petry, 2001; Mitchell et al., 2005; MacKillop et al., 2011). This immediate reward selection (or “Now”) bias persists even after years of abstinence and does not correlate with abstinence duration (Mitchell et al., 2005), suggesting irreversible consequences of chronic alcohol abuse and/or a pre-existing risk trait, or intermediate phenotype (Meyer-Lindenberg and Weinberger, 2006; MacKillop, 2013). If the latter were true, we would predict heightened Now bias among young people who engage in at-risk drinking but who do not meet clinical criteria for alcohol dependence, relative to age-matched moderate drinkers. We would also predict heightened Now bias among moderate drinkers with problem-drinking first degree relatives.
33
drinkers. While emerging adults are widely regarded as impulsive (Chambers and Potenza, 2003; de Wit, 2009), and DD normally decreases from childhood to the early 30’s (Green, 1994; Scheres et al., 2006; Olson et al., 2007; Eppinger et al., 2012), little is known about specific changes in DD from late adolescence to adulthood. Some data show trait impulsivity declining linearly with age from early adolescence to age 30 (Steinberg et al., 2008). Thus, given positive correlations between DD and trait impulsivity (Mitchell et al., 2005; de Wit et al., 2007), DD should decline with age from adolescence into the 30s, but, to our knowledge, no prior studies have explicitly investigated age effects on DD in detail from ages 18 to 40. Moreover, we do not know whether heavy alcohol use moderates any such age-related changes in DD.
34 METHODS
Participants
35
Behavioral Inventories
We administered standard questionnaires to quantify personal substance use, alcoholism familial history (FH), and behavioral traits. These included the AUDIT, the RAPI (White and Labouvie, 1989), the Drug Abuse Screening Test (DAST) (Skinner, 1982), and the Drug Use Screening Inventory, Domain I (DUSI-I); (Tarter, 1990). DUSI-I scores reported as % affirmative answers from Domain I, part B. We calculated density of familial alcohol abuse from the Family Tree Questionnaire (FTQ) (Mann et al., 1985), and classified participants reporting a problem drinking father or sibling as FH positive for alcoholism (FHP; n=76). Those reporting a problem-drinking mother (n=22) were excluded from our FH analyses to avoid potential confounds from fetal alcohol exposure. Those reporting no problem drinking first degree relatives were classified as family history negative (FHN; n=161). The Barratt Impulsiveness Scale-11 (BIS); (Patton et al., 1995) was used as a subjective measure of trait impulsiveness. Socio-economic Status (SES) was quantified as Hollingshead scores, following the Barratt Simplified Measure of Socioeconomic Status method (Hollingshead, 1975; Barratt, 2006).
Delay Discounting Task
36
The delayed amount, delay time, percent discount, and left/right position were pseudorandomly selected for each trial. We also collected reaction time (RT) for each trial. Nine subjects were excluded based on faster RT in the W and/or DW trials than in the CON trials, indicating lack of subjective consideration of options.
Genotyping
We previously found that a polymorphism in the catechol-O-methyltransferase (COMT) gene (COMT Val158Met; rs4680) interacts with age to affect ICR (Smith and Boettiger, 2012). To control for this potential confound, participants were genotyped for the COMT Val158Met polymorphism as previously described (Boettiger et al., 2007; Smith and Boettiger, 2012). Although COMT genotype distribution did not differ across recruitment groups (see Tables 3.1-3.3), we included a COMT*age covariate in our analyses to account for the COMT by age effect we previously observed.
Data Analysis
37
For single factor statistical comparisons between groups, we used unpaired two-tailed t-tests for continuous measures and χ2 tests for categorical measures. For multi-factorial comparisons, we used standard or repeated measures mixed model ANOVAs with group as a between subjects factor, using SPSS (IBM, Montauk, NY). When necessary, a Greenhouse-Geisser non-sphericity correction was applied. When data were not normally distributed, arcsine-root transformations were applied in Excel to ensure the validity of parametric statistical tests. All analyses performed in SPSS unless otherwise noted. Effect sizes for ANOVA are reported as η2
, while effect sizes for t-tests are reported as Cohen’s d.
Exploratory analyses to define optimal future age and alcohol-use groups
For exploratory analyses focused on the effect of age and AUDIT consumption (AUDIT-c) scores on ICR, we calculated d-prime (d′), a discriminability index derived from signal detection theory (Green & Swets, 1966). To identify, post-hoc, age and AUDIT-c cutoff scores producing the largest group difference in ICR, we calculated d′ for ICR group differences as:
38
Figure 3.1: Systematic analysis of adult age cutoff on ICR age group effects among moderate drinkers. Plot depicts the group discrimination index (d′) as a function of adult age cutoff. Among moderate drinkers in this sample, d′ is maximal with an adult age cutoff of 26 years of age. Note that a gap year was included in each age group comparison.
Analysis of age group effect size in Low AUDIT individuals
39
effect with an age cutoff of 26 (Cohen’s d=0.82). Based on these discriminability results, for our subsequent age group analyses, we classified participants as emerging adults (ages 18-24, n=184; mean age=20.8±1.7) or adults (ages 26-40, n=39; mean age=31.4±4.0).
RESULTS
Demographic and psychometric data by recruitment groups
Based on preliminary data from our lab, we initially recruited late adolescent (ages 18-21) and young adult (ages 22-40) subjects, with roughly equal ratios of high AUDIT individuals within each group. Details on the demographic differences between these recruited age groups can be found in Table 3.1. Importantly, our recruited age groups did not differ in terms of ethnicity, sex, SES, family history of alcohol abuse (FTQ density), COMT genotype distribution, nor in terms of several measures of substance use (DUSI, DAST; Table 3.1).
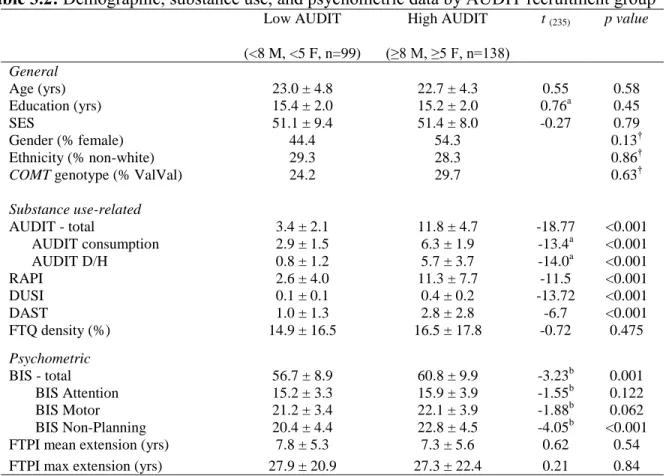
Considering the subjects according to AUDIT recruitment groups, we observed no significant differences between groups in terms of age, education, SES, sex, ethnicity, COMT genotype distribution, FH of alcohol abuse, or FTPI scores (Table 3.2).
40
Demographic and psychometric data: Emerging Adults vs Adults
We investigated whether any demographic, substance use, or psychometric measures varied across our emerging adult (18-24), adult (26-40) and low and high AUDIT recruitment groups via a 2x2 ANOVA. We found that these four groups did not differ in terms of sex, COMT genotype, or ethnicity (Table 3.4). Moreover, we found no significant age*AUDIT group interactions on any measure except AUDIT and DUSI scores (Table 3.4). This result reflects ~47% higher AUDIT scores and ~39% higher DUSI scores among 18-24 year olds relative to adults within the high AUDIT group (Table 3.4).
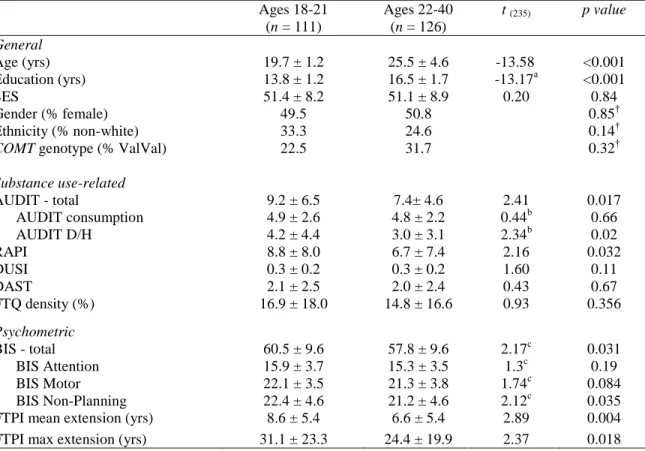
Table 3.1: Demographic, substance use, and psychometric data by age recruitment group
Ages 18-21 (n = 111)
Ages 22-40 (n = 126)
t (235) p value
General
Age (yrs) 19.7 ± 1.2 25.5 ± 4.6 -13.58 <0.001
Education (yrs) 13.8 ± 1.2 16.5 ± 1.7 -13.17a <0.001
SES 51.4 ± 8.2 51.1 ± 8.9 0.20 0.84
Gender (% female) 49.5 50.8 0.85†
Ethnicity (% non-white) 33.3 24.6 0.14†
COMT genotype (% ValVal) 22.5 31.7 0.32†
Substance use-related
AUDIT - total 9.2 ± 6.5 7.4± 4.6 2.41 0.017
AUDIT consumption 4.9 ± 2.6 4.8 ± 2.2 0.44b 0.66
AUDIT D/H 4.2 ± 4.4 3.0 ± 3.1 2.34b 0.02
RAPI 8.8 ± 8.0 6.7 ± 7.4 2.16 0.032
DUSI 0.3 ± 0.2 0.3 ± 0.2 1.60 0.11
DAST 2.1 ± 2.5 2.0 ± 2.4 0.43 0.67
FTQ density (%) 16.9 ± 18.0 14.8 ± 16.6 0.93 0.356
Psychometric
BIS - total 60.5 ± 9.6 57.8 ± 9.6 2.17c 0.031
BIS Attention 15.9 ± 3.7 15.3 ± 3.5 1.3c 0.19
BIS Motor 22.1 ± 3.5 21.3 ± 3.8 1.74c 0.084
BIS Non-Planning 22.4 ± 4.6 21.2 ± 4.6 2.12c 0.035
FTPI mean extension (yrs) 8.6 ± 5.4 6.6 ± 5.4 2.89 0.004
FTPI max extension (yrs) 31.1 ± 23.3 24.4 ± 19.9 2.37 0.018
Values are reported as mean ± standard deviation. Reported p-values reflect the results of unpaired two-tailed comparison between groups. Exact p-values reported unless p < 0.001. AUDIT, Alcohol Use Disorders Identification Test; AUDIT D/H, AUDIT dependence/harm subscales; RAPI, Rutgers Alcohol Problem Index; DUSI, Drug Use Screening Inventory, part I-B; DAST, Drug Abuse Screening Test; SES, Socioeconomic Status; BIS, Barratt Impulsiveness Scale; FTPI, Future Time Perspective Inventory. †p-value represents results of χ2 test. a
41
Table 3.2: Demographic, substance use, and psychometric data by AUDIT recruitment group
Low AUDIT
(<8 M, <5 F, n=99)
High AUDIT
(≥8 M, ≥5 F, n=138)
t (235) p value
General
Age (yrs) 23.0 ± 4.8 22.7 ± 4.3 0.55 0.58
Education (yrs) 15.4 ± 2.0 15.2 ± 2.0 0.76a 0.45
SES 51.1 ± 9.4 51.4 ± 8.0 -0.27 0.79
Gender (% female) 44.4 54.3 0.13†
Ethnicity (% non-white) 29.3 28.3 0.86†
COMT genotype (% ValVal) 24.2 29.7 0.63†
Substance use-related
AUDIT - total 3.4 ± 2.1 11.8 ± 4.7 -18.77 <0.001
AUDIT consumption 2.9 ± 1.5 6.3 ± 1.9 -13.4a <0.001
AUDIT D/H 0.8 ± 1.2 5.7 ± 3.7 -14.0a <0.001
RAPI 2.6 ± 4.0 11.3 ± 7.7 -11.5 <0.001
DUSI 0.1 ± 0.1 0.4 ± 0.2 -13.72 <0.001
DAST 1.0 ± 1.3 2.8 ± 2.8 -6.7 <0.001
FTQ density (%) 14.9 ± 16.5 16.5 ± 17.8 -0.72 0.475
Psychometric
BIS - total 56.7 ± 8.9 60.8 ± 9.9 -3.23b 0.001
BIS Attention 15.2 ± 3.3 15.9 ± 3.9 -1.55b 0.122
BIS Motor 21.2 ± 3.4 22.1 ± 3.9 -1.88b 0.062
BIS Non-Planning 20.4 ± 4.4 22.8 ± 4.5 -4.05b <0.001
FTPI mean extension (yrs) 7.8 ± 5.3 7.3 ± 5.6 0.62 0.54
FTPI max extension (yrs) 27.9 ± 20.9 27.3 ± 22.4 0.21 0.84
Values are reported as mean ± standard deviation. Reported p-values reflect the results of unpaired two-tailed comparison between groups. Exact p-values reported unless p < 0.001. Conventions as per Table 3.1. M, males; F females. †p-value represents results of χ2 test. adf=233, bdf=215; cdf=234
AUDIT does not predict ICR in emerging adults
42
Table 3.3: Demographic, Substance Use Related, and Psychometrics Measures Across Age and AUDIT groups
Low AUDIT
(<8 M, <5 F, n=99)
High AUDIT
(≥8 M, ≥5 F, n=138)
Ages 18-21
(n = 45)
Ages 22-40
(n = 54)
Ages 18-21
(n = 66)
Ages 22-40
(n = 72)
Significant Age*AUDIT
interaction
F233 p
Demographic
Age (yrs) 19.6 ± 1.2 25.8 ± 4.9 19.8 ± 1.1 25.3 ± 4.4 0.85 0.36
Education (yrs) 13.8 ± 1.4 16.7 ± 1.4 13.9 ± 1.2 16.3 ± 2.0 1.08a 0.30
SES 51.6 ± 9.2 50.6 ± 9.6 51.2 ± 7.6 51.5 ± 8.4 0.31 0.58
Ethnicity (% non-white)
31.1 27.8 34.8 22.2 0.42†
Sex (% female) 42.2 46.3 54.5 54.2 0.49†
COMT genotype (% ValVal)
20 27.8 24.2 34.7 0.59†
Substance use-related
AUDIT 3.3 ± 2.3 3.4 ± 1.9 13.2 ± 5.2 10.5 ± 3.6 7.91 0.005
AUDIT consumption 2.7 ± 1.4 3.1 ± 1.5 6.5 ± 2.0 6.0 ± 1.8 2.98b 0.086
AUDIT D/H 0.8 ± 1.1 0.7 ± 1.2 6.8 ± 4.2 4.8 ± 2.9 5.92b 0.016
RAPI 3.3 ± 4.7 1.9 ± 3.1 12.6 ± 7.5 10.2 ± 7.7 0.38 0.54
DUSI 0.12 ± 0.13 0.13 ± 0.12 0.41 ± 0.15 0.34 ± 0.16 3.97 0.048
DAST 1.02 ± 1.5 0.91 ± 1.1 2.8 ± 2.9 2.7 ± 2.8 0.003 0.96
FTQ density (%) 15.1 ± 16.6 14.7 ± 16.6 18.2 ± 18.9 15 ± 16.7 0.359 0.55
Psychometric
BIS - total 57.6 ± 8.8 56 ± 9.1 62.5 ± 9.7 59.2 ± 9.9 0.44c 0.51
BIS Attention 15.3 ± 3.3 15.1 ± 3.3 16.4 ± 3.9 15.5 ± 3.7 0.69c 0.41
BIS Motor 21.7 ± 3.3 20.7 ± 3.4 22.4 ± 3.7 21.8 ± 4.0 0.11c 0.74
BIS Non-Planning 20.7 ± 4.1 20.1 ± 4.7 23.7 ± 4.5 22 ± 4.4 1.004
c
0.32
FTPI mean ext (yrs) 9.0 ± 5.0 6.7 ± 5.4 8.3 ± 5.8 6.4 ± 5.3 0.134 0.72
FTPI max ext (yrs) 32.3 ± 22.1 24.2 ± 19.3 30.2 ± 24.3 24.6 ± 20.4 0.188 0.67
Values are reported as mean ± standard deviation. Reported p-values reflect the results of unpaired two-tailed comparison between groups. Exact p-values reported unless p < 0.001. Conventions as per Table 3.1. †p-value represents results of χ2 test. adf=231; bdf=213, cdf=232
Effects of age and AUDIT group on ICR
43
3.4). This analysis did not detect a significant main effect of AUDIT group (F(1,217)=0.042, p=0.84, η2<0.001). However, a trend toward a main effect of age group (F(1,217)=3.66, p=0.057, η2=0.016) and a significant age*AUDIT interaction (F(1,217)=5.17, p=0.024, η2
=0.023; Figure 3.2) on ICR was present. Post-hoc analyses of age-related changes in ICR by AUDIT recruitment groups found that among low AUDIT individuals (AUDIT <8 males, <5 females), mean ICR was ~48% higher in 18-24 year olds (0.68±0.25) relative to 26-40 year olds (0.46±0.37; F(1, 91)=8.46, p=0.005, η2=0.085). In contrast, in the high AUDIT group, mean ICR was ~1.6% higher in 18-24 year olds (0.63±0.32) relative to those 26-40 (0.62±0.32; F(1,124)=0.009, p=0.93, η2
<0.001). This finding is suggestive that ICR may decline more with age in low versus high AUDIT individuals.
44
Table 3.4: Demographic, Substance Use Related, and Psychometrics Measures Across Age and High/Low AUDIT groups
Low AUDIT
(<8M, <5 F)
High AUDIT
(≥8 M, ≥5 F)
Ages 18-24
(n = 75)
Ages 26-40
(n = 20)
Ages 18-24
(n = 109)
Ages 26-40
(n = 19)
Age*AUDIT
interaction
F219 p
Demographic
Age (yrs) 20.7 ± 1.7 31.2 ± 4.0 20.9 ± 1.7 31.5 ± 4.2 0.02 0.89
Education (yrs) 14.7 ± 1.6 17.6 ± 1.5 14.7 ± 1.5 17.6 ± 2.8 <0.001a 0.998
SES 50.6 ± 10 53.1 ± 7.7 51.4 ± 7.7 52.9 ± 9.6 0.13 0.71
Ethnicity (% non-white) 25.3 40.0 29.4 26.3 0.63†
Sex (% female) 42.7 55.0 52.3 63.2 0.34†
COMT genotype (% ValVal)
22.7 30.0 29.4 36.8 0.73†
Substance use-related
AUDIT 3.5 ± 2.2 3.0 ± 1.9 12.5 ± 4.8 8.5 ± 2.5 7.19 0.008
AUDIT consumption 3.0 ± 1.4 2.7 ± 1.4 6.6 ± 1.9 4.8 ± 1.1 6.53b 0.011
AUDIT D/H 0.9 ± 1.2 0.6 ± 1.2 6.2 ± 3.8 3.7 ± 2.3 4.77b 0.03
RAPI 2.9 ± 4.0 1.5 ± 3.7 12.3 ± 7.5 7.9 ± 7.7 1.77 0.19
DUSI 0.12 ± 0.13 0.12 ± 0.13 0.39 ± 0.15 0.28 ± 0.19 4.44 0.04
DAST 1.0 ± 1.4 0.85 ± 0.9 2.7 ± 2.7 2.6 ± 3.5 <0.001 0.99
FTQ density (%) 13.9 ± 15.5 21.5 ± 19.5 15.4 ± 16.8 22.2 ± 20.8 0.019 0.89
Psychometric
BIS - total 56.9 ± 8.7 55.7 ± 9.8 61.7 ± 9.4 55.3 ± 9.9 2.55c 0.11
BIS Attention 15.4 ± 3.0 14.4 ± 4.0 16.1 ± 3.7 14.6 ± 3.8 0.16c 0.69
BIS Motor 21.2 ± 3.5 20.8 ± 3.1 22.4 ± 3.8 20.0 ± 3.3 2.45c 0.12
BIS Non-Planning 20.3 ± 4.3 20.6 ± 5.0 23.2 ± 4.5 20.7 ± 4.6 2.95c 0.09
FTPI mean ext (yrs) 8.6 ± 5.3 5.1 ± 4.0 7.5 ± 5.8 6.9 ± 5.0 2.24 0.14
FTPI max ext (yrs) 30.7 ± 21.8 19.8 ± 15.2 28.0 ± 23.6 23.1 ± 14.2 0.62 0.43
Values are reported as mean ± standard deviation. Reported F and p-values reflect the results testing for significant age by AUDIT group interactions. Exact p-values reported unless p < 0.001. Conventions as per Table 3.1. †p-value represents results of χ2 test. aerror=217, berror=202; cerror=218
Among low AUDIT individuals, ICR decreases with age
45
on the effect of increasing age on ICR. Overall, a significant negative correlation between ICR and age was observed (r(235)=-0.134, p=0.019, β=-0.012) indicating a ~1.1% ICR decrease for each year of age >18. Examining the relationship between ICR and age by AUDIT recruitment groups, we found a striking difference between the high and low AUDIT groups. The low AUDIT group showed a ~2.2% decline in ICR with each year of age >18 (r(197)=-0.276, p=0.003, β=-0.022). In contrast, we observed no relationship between ICR and age within the high AUDIT
group (r(136)=-0.025, p=0.39, β=-0.002). Thus, the age effect on ICR in the whole sample was driven by the low AUDIT group.
Examination of secondary measures of DD behavior within the low AUDIT group produced qualitatively similar results. Specifically, the average area under the ICR by delay time curve (AUC) of 18-24 year olds (123.1±52.5) was ~22% larger, relative to that of 26-40 year olds (101.0±64.3; t(49.287)=2.011, p=0.05, d=0.41), indicating greater Now bias in emerging adults. Moreover, among low AUDIT individuals, we found a significant negative correlation between AUC and age (r(97)=-0.309, p=0.001). No such decline in AUC with age was seen in the high AUDIT group (r(136)=-0.034, p=0.345).
Other aspects of DD task performance
46
that was associated with greater choice inconsistency (Ripke et al., 2012). Here, we found that the consistency of ICR across task blocks (8 blocks of the task were administered over ~50 minutes) did not differ between age groups (Cronbach’s α, ages 18-24: 0.984, ages 26-40: 0.990). Furthermore, a two-way repeated measures ANOVA (age group*block) found no significant main effect of block (F(7,1491)=0.96, p=0.46) nor block*age group interaction (F(7,1491)=0.58, p=0.77) on ICR. Thus, our observed age effects on ICR are not attributable to age–related changes in response consistency. Task related performance and these other measures of discounting are reported across low and high AUDIT and emerging adults versus adults in Table 3.5. Note that there was no significant age*AUDIT group interaction on any performance related measure and that the only significant interaction was observed with our AUC measure, which confirms the AUDIT*age group interaction we observed with our ICR measure (see Effects of age and AUDIT group on ICR above).
Relationship between AUDIT and ICR: moderation by age
47
AUDIT scores among adults (ages 26-40), an effect driven mostly by AUDIT-c scores (Table 3.6). In adults 26-40, each additional AUDIT-c point was associated with a 15.6% increase (β=0.117) in ICR (Table 3.6). In contrast, increases in AUDIT-c scores had no significant effect on ICR among emerging adults (18-24; Table 3.6). In this sample, then, it is alcohol consumption (as measured via the AUDIT-c) that is related to ICR and the relationship between AUDIT-c and ICR becomes apparent when the effects of young age (which we observe is naturally associated with high ICR) have diminished after age 25.
Exploratory d′ analysis of AUDIT-c cutoffs
As ICR correlated better with AUDIT-c than with full AUDIT scores in adults, we sought to identify the AUDIT-c score cutoff that produced the largest group difference in ICR so that recruitment for future studies investigating this effect could be adequately powered. As for our post hoc age group analysis (see Methods), we used a sliding cutoff value to identify the maximal between group d′, starting with an AUDIT-c score cutoff of 2. The ICRs of AUDIT-c groups began to be maximally discriminated using a cutoff score of 5. Cohen’s d effect size for ICR difference across AUDIT-c groups with a cutoff of 5 was (0.73).
Testing for interacting effect of age and alcohol use in AUDIT-c groups
48
n=184; mean age=20.8±1.7) or adults (ages 26-40, n=39; mean age=31.4±4.0), and moderate drinkers (AUDIT-c <4, n=60; mean AUDIT: 2.8±2.2, mean AUDIT-c: 2.1±0.9) or heavy drinkers (AUDIT-c ≥5, n=102; mean AUDIT: 12.1±5.1, mean AUDIT-c: 6.8±1.6). Participants with AUDIT-c scores of 4 were excluded, as scores ≥4 may be associated with alcohol misuse in females but not males (Bradley et al., 2007). Demographic data across these AUDIT-c and age groups are displayed in Table 3.7.
Table 3.5: Delay Discounting Task Behavioral Measures Across Age and High/Low AUDIT groups
Low AUDIT
(<8 M, <5 F)
High AUDIT
(≥8 M, ≥5 F)
Ages 18-24
(n = 75)
Ages 26-40
(n = 20)
Ages 18-24
(n = 109)
Ages 26-40
(n = 19)
Age*AUDIT
interaction
F219 p
Task Performance
Control Trial Acc 97.0 ± 3.3 96.7 ± 3.5 96.6 ± 3.6 98.1 ± 2.0 2.22 0.14
Control Trial RT 1364 ± 339 1347 ± 315 1401 ± 329 1233 ± 276 1.68 0.20
WANT Trial RT 1920 ± 383 1743 ± 388 1915 ± 396 1711 ± 389 0.04 0.84
DON’T WANT Trial RT
2064 ± 399 1859 ± 385 2086 ± 449 1888 ± 369 0.002 0.96
ICR by Delay Curve Measures
Area Under Curve 130.6 ± 42.9 86.8 ± 69.2 118.0 ± 57.8 116.0 ± 56.7 4.74 0.031
Delay Curve Slope 0.13 ± 0.09 0.09 ± 0.11 0.09 ± 0.08 0.10 ± 0.08 1.50 0.22
Delay Curve Intercept 0.21 ± 0.46 0.10 ± 0.44 0.27 ± 0.41 0.24 ± 0.44 0.23 0.63
Other Task Measures
Criterion Int. Rate 19.0 ± 18.7 8.3 ± 10.2 17.7 ± 30.5 18.4 ± 19.9 1.61a 0.21
Motor Mismatch 0.11 ± 0.06 0.10 ± 0.07 0.11 ± 0.06 0.12 ± 0.07 0.61 0.44
ICR consistency (α) 0.978 0.991 0.987 0.988 0.86† 0.51†
49
Table 3.6: AUDIT Correlates with ICR More Strongly in Adults and is Driven by AUDIT Consumption Subscale.
Recruited Age Groups
AUDIT Total AUDIT Consumption AUDIT Dependence/Harm
18-21 (n=111)
r(109)=-0.017, p=0.43
β=0
r(97)=0.059, p=0.28
β=0.008
r(97)=-0.012, p=0.45
β=0
22-40 (n=126)
r(124)=0.141, p=0.057
β=0.013
r(116)=0.158, p=0.044
β=0.031
r(116)=0.101, p=0.137
β=0.014
Post-hoc Age Groups
AUDIT Total AUDIT Consumption AUDIT Dependence/Harm
18-24 (n=184)
r(184)=0.014, p=0.42
β=0.001
r(166)=0.018, p=0.41
β=0.003
r(166)=0.017, p=0.41
β=0.002
26-40 (n=39)
r(37)=0.30, p=0.032
β=0.04
r(36)=0.398, p=0.007
β=0.117
r(36)=0.24, p=0.073
β=0.048
Table reflects Pearson correlation r, p, and beta values from linear regression analyses of AUDIT score and AUDIT subscales score effects on ICR by recruited age groups and age groups proposed for further analysis of age effect.
Running our AUDIT-c by age group ANOVA, we found, as expected, significant main effects of age (F(1,157)=6.12, p=0.014, η2=0.035) and AUDIT-c (F(1,157)=4.37, p=0.038, η2
50
p=0.37, β=-0.003). Qualitatively similar results were obtained with AUC values (data not shown). As in a priori age groups, we found no age effect on response consistency (data not shown).
Figure 3.3: Interacting effects of age and alcohol consumption on delay discounting behavior.
Plot depicts the ratio of immediate reward choices (ICR) in the delay-discounting task as a function of post hoc defined AUDIT-c and age groups. There was a significant age by AUDIT consumption group interaction on ICR, F(1, 157)=8.32, p=0.004, η2=0.047. *ICR is higher in heavy (AUDIT consumption ≥5) versus light/moderate drinking adults (t(27)=-2.28, p=0.031, d=-0.88). In emerging adults (ages 18-24), ICR does not differ based on alcohol consumption (t(115.216)=1.018, p=0.311, d=0.17). AUDIT-c, AUDIT consumption subscale. *p<05.
High ICRs in late adolescents is not driven by underage drinkers