IMPROVING IN VIVO FAST-SCAN CYCLIC
VOLTAMMETRIC DETECTION OF NEUROMODULATORS
Richard Brandon Keithley
A dissertation submitted to the faculty of the University of North Carolina at Chapel Hill in partial fulfillment of the requirements for the degree of Doctor of Philosophy in the
Department of Chemistry
Chapel Hill 2011
ii ABSTRACT
RICHARD BRANDON KEITHLEY: IMPROVING IN VIVO FAST-SCAN CYCLIC VOLTAMMETRIC DETECTION OF NEUROMODULATORS
(Under the direction of R. Mark Wightman)
Fast-scan cyclic voltammetry is an electroanalytical technique used to probe neuromodulator signaling dynamics in vivo. The popularity of fast-scan cyclic voltammetry has grown in recent years because of its ability to address various
neurobiology research interests in a simple, rapid, sensitive, manner in vivo in real time. However, there still remain challenges associated with the identification and detection of neuromodulators in vivo. Here, the application of principal component regression with residual analysis to in vivo fast-scan cyclic voltammetry data is presented for the first time in a straightforward, non-mathematical context. Changing the estimation of rank from the 99.5% cumulative variance method to Malinowski’s F-test better separates relevant information from noise contained in the training set cyclic voltammograms. This allows the residual analysis procedure to function more accurately in determining
iii
sensitivities are significantly improved, approaching a sub-nanomolar limit of detection. Scanning to a potential of 1.3 V requires waveform modification to maintain the
iv
ACKNOWLEDGEMENTS
I have to start off by thanking my research advisor, Dr. R. Mark Wightman. You have put in a great deal of effort to help me develop my burgeoning scientific career. You never settled for anything less than perfection, which pushed me and made me strive for excellence. I hope that in the future we may be colleagues, pursuing exciting research prospects.
I thank several collaborators for their various contributions to the work presented here. Dr. Michael Heien provided helpful discussions and Dr. Leslie Sombers provided data for Chapters 2 and 3. I thank Dr. Manna Beyene, Dr. Fabio Cacciapaglia,Dr. Jeremy H. Day, Dr. Joshua L. Jones, Dr. Catarina Owesson-White, and Dr. Robert A. Wheeler for the use of their data for Chapter 3, as well as helpful conversations with Christopher Wiesen. Dr. Regina Carelli also supplied some of the data analyzed in Chapters 3 and 4. Pavel Takmakov, Elizabeth Bucher, Anna Belle, Dr. Catarina
Owesson-White, and Dr. Jinwoo Park performed some of the experiments presented in Chapter 5 and provided helpful discussions. Pavel Takmakov, Dr. Jinwoo Park, Dr. Andre Hermans, and Dr. Matthew Zachek were also very helpful throughout my various investigations during my dissertation work, helping this separations chemist become more acquainted with electrochemistry. I also thank Collin McKinney for helpful
v
other members of the Wightman lab because they deserve it after putting up with me for several years.
I also thank several faculty members for their guidance during my undergraduate education at Virginia Commomwealth University. I thank my mentor, Dr. Sarah Rutan, for helping me start asking questions and for not rolling her eyes when I asked them over and over again. She never lost faith in me and always pushed me forward. Plus, the printer outside the door was a welcome relief. Dr. Sally Hunnicutt helped me find my passion for teaching and guided me throughout my undergraduate career.
I thank my family for supporting me all these years and helping me get to this point. I didn’t always call, I rarely visited, and I even dumped my cats with you.
vi
TABLE OF CONTENTS D
LIST OF TABLES ... xi
LIST OF FIGURES ... xii
LIST OF ABBREVIATIONS AND SYMBOLS... xiv
Chapter I. BUILDING A BETTER MOUSETRAP FOR FAST-SCAN CYCLIC VOLTAMMETRY ... 1
Introduction ... 1
Sensitivity and Limit of Detection Improvements ... 2
Pushing Beyond Rodent Dopamine ... 6
In Vivo Microelectrode Design Developments ... 10
Unscrambling Mixed Messages with Principal Component Regression. ... 11
Concluding Remarks ... 15
References ... 18
II. MULTIVARIATE CONCENTRATION DETERMINATION USING PRINCIPAL COMPONENT REGRESSION WITH RESIDUAL ANALYSIS ... 23
Abstract ... 23
vii
Multivariate Analysis in Analytical Chemistry ... 24
Construction of a multivariate model: principal component regression ... 26
PCR Model Validation ... 33
PCR Model Applicability: Residual Analysis ... 34
Qα as a measure of significance ... 38
Interpretation of cα ... 39
Qt crossing Qα: ... 41
Future Outlook / Conclusions ... 44
References ... 46
III. RANK ESTIMATION AND THE MULTIVARIATE ANALYSIS OF IN VIVO FAST-SCAN CYCLIC VOLTAMMETRIC DATA ... 49
Abstract ... 49
Introduction ... 50
Theory ... 53
Experimental ... 56
Fast-scan cyclic voltammetry and animal experimentation ... 56
Data analysis and principal component regression ... 57
Results and Discussion... 59
Principal component selection & training set heterogeneity ... 59
Comparison of information contained in secondary PCs ... 65
viii
Comparison in concentration prediction ... 77
Conclusions ... 84
References ... 87
IV. ASSESSING PRINCIPAL COMPONENT REGRESSION WITH RESIDUAL ANALYSIS IN THE DETECTION OF NEUROMODULATORS... 91
Abstract ... 91
Introduction ... 92
Theory ... 94
PCR and K generation ... 94
Leverage ... 95
Studentized residual ... 96
Cook’s distance ... 97
Experimental ... 99
Electrochemical and animal experimentation ... 99
Data analysis ... 99
In vivo FSCV training sets ... 100
Results and Discussion... 101
Proper accounting of electrode drift and failure of the residual analysis procedure ... 101
Transformation of the Qα value ... 104
Interpretation of residual color plots for the identification of deterministic error... 105
ix
Identifying and removing training set outliers using Cook’s
distance ... 112
Conclusions ... 116
V. HIGHER SENSITIVITY DOPAMINE MEASUREMENTS WITH FASTER-SCAN CYCLIC VOLTAMMETRY... 121
Abstract ... 121
Introduction ... 122
Experimental ... 125
Chemicals ... 125
Electrode fabrication ... 125
Data acquisition ... 126
Electrochemical experiments ... 127
Data analysis ... 128
Flow injection analysis ... 129
Etching studies ... 129
In vivo experiments in anesthetized rats ... 130
Use of ABS for faster scan rate experiments ... 130
Combined electrochemistry and electrophysiology ... 130
Results and Discussion... 132
Scanning faster with the 1.0 V waveform ... 132
Scanning faster with the 1.3 V cyclic waveform ... 136
x
Effect of increased charging current on neuronal firing ... 144
Surface integrity of carbon-fiber microelectrodes after waveform
application ... 148
Conclusions ... 151
xi
LIST OF TABLES
Table
3.1. Comparison of Rank Estimation Methods. Eigenvalue, reduced eigenvalue, calculated F-statistic, critical F-value at 5% significance, and PRESS value as a function of PC for an
example FSCV training set spectral matrix. ... 60
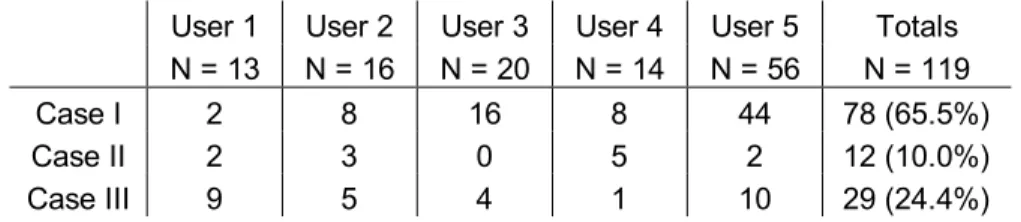
3.2. Inter-researcher comparison of rank estimation between
Malinowski’s F-test and the 99.5% cumulative variance method. ... 63
3.3. Comparison of average Qα values calculated using PCs retained
xii
LIST OF FIGURES
Figure
1.1. The application of the 1.3 V FSCV waveform alters carbon
surface chemistry... ... 5
1.2. PCR signal separation of complex in vivo FSCV data.. ... 14
1.3. Comparison of charge oscillations.. ... 16
2.1. Representation of UV-VIS data in an intensity space.. ... 28
2.2. PCR deconvolution of in vivo electrochemical data.. ... 32
2.3. Calculation of a Q value at a specific time point, t.. ... 37
2.4. The use of residual analysis as a diagnostic tool for significance in in vivo electrochemical data.. ... 43
3.1. Histograms of the estimated rank of Case I, II, and III training sets.. ... 64
3.2. Comparison of effective cyclic voltammograms in a representative Case I training set.. ... 66
3.3. RMS noise removed by the 99.5% cumulative variance method (99.5% C.V.) and Malinowski’s F-test for all of the Case I training sets.. ... 69
3.4. Cyclic voltammetric representation of the secondary PCs from each method of factor selection for a representative Case II training set.. ... 71
3.5. Histograms of Qα values of A) Case I and B) Case II training sets.. ... 74
3.6. Comparison of stimulated release predicted by PCR using primary PCs determined with both methods of factor selection for a representative Case I training set... 79
xiii
4.1. Neuromodulator prediction by PCR with and without electrode
drift in the training set... 102
4.2. Interpretation of a residual color plot when an unrepresentative training set is used for concentration prediction.. ... 106
4.3. K representations of a proper and an improper training set.. ... 110
4.4. The use of Cook’s distance to improve PCR calibration.. ... 114
5.1. ABS utilization for faster-scan cyclic voltammetry.. ... 131
5.2. Performance characteristics of the 1.0 V waveform upon increasing scan rate.. ... 134
5.3. Performance characteristics of the 1.3 V cyclic waveform upon increasing scan rate.. ... 137
5.4. 1.3 V excursions versus time.. ... 140
5.5. In vitro performance of the 1.3 V sawhorse waveform.. ... 142
5.6. In vivo performance of the 1.3 V sawhorse waveform in vivo in anesthetized rats.. ... 145
5.7. The effect of waveform application on firing rate activity.. ... 147
xiv
LIST OF ABBREVIATIONS AND SYMBOLS
* Probability Less Than 0.05 ** Probability Less Than 0.01 *** Probability Less Than 0.001
α Significance Level
A Training Set Voltammetric Matrix A/P Anterior/Posterior
ABS Analog Background Subtraction ADC Analog-to-Digital Converter
Ag/AgCl Silver-Silver Chloride Reference Electrode AjPC Discarded Noise of a Training Set
ANOVA Analysis of Variance
AnPC Relevant Portion of Training Set Data
Aproj Projection of Training Set Onto Relevant Principal Components
AprojTS Relevant Scores of the Training Set Cyclic Voltammograms
ATS Training Set Cyclic Voltammogram Matrix
A.U. Absorbance Units
Aunk Unknown Cyclic Voltammograms Being Predicted
c Columns in a Data Matrix C.V. Cumulative Variance CH3COOK Potassium Acetate
Cts Training Set Concentration Matrix
Cunk Unknown Neuromodulator Concentrations
cα Noise Threshold Z-Score
xv
D/V Dorsal/Ventral
DA Dopamine
DAC Digital-to-Analog Converter
Di Cook’s Distance
diag Diagonal Operation
ei Difference Between Estimated and Reference Concentration Values
ESEM Environmental Scanning Electron Microscopy
F Regression Coefficients Relating Unknown Concentrations to Relevant Scores
F0.05 Critical F-Value at 5% Significance
FSCV Fast-Scan Cyclic Voltammetry Fstat Calculated F-Statistic
γ Cook’s Distance Significance Level
g Grams
hi Leverage of the ith Sample
Hz Hertz
i.p. Intraperiotoneal Injection ICSS Intracranial Self-Stimulation IE Current-to-Voltage Converter iRMS Root Mean Square Current
iTH Significant Current Threshold
ix Current at the xth potential
Current Predicted From the Calibration Model at the xth Potential
j Number of Analytes
K Matrix Containing Cyclic Voltammograms of Each Analyte in Units of Current Per Concentration
KCl Potassium Chloride
x
xvi
kDA Dopamine Column of K
kEV Kiloelectronvolt
kg Kilogram
kHz KiloHertz
Kj Column of K
kpH pH Column of K
λ Sum of Squares of the Data Projections From All Samples in the Training Set for Each Principal Component
λj Eigenvalue of the jth Principal Component
λj0 Error Eigenvalue of the jth Principal Component
LOD Limit of Detection
µ Mean
µA Microamperes
µm Micrometers
µM Micromolar
µs Microseconds
m Number of Training Set Samples
M/L Medial/Lateral
min Minutes
mL Milliliter
mM Millimolar
ms Millisecond
mV Millivolts
n Number of Retained Principal Components n.s. No Significant Difference
xvii
nA Nanoamperes
NaCl Sodium Chloride
NaH2PO4 Sodium Dihydrogen Phosphate
nM Nanomolar
P Probability
PBS Phosphate Buffered Saline
PC Principal Component
PCA Principal Component Analysis PCR Principal Component Regression PLS Partial Least-Squares
PRESS Predicted Residual Error Sum-of Squares Q Sum of the Squares of Residual Currents
Qt Sum of the Squares of Residual Currents at the time point t
Qα Tolerable Threshold for the Sum of the Squares of Residual Currents
r Rows in a Data Matrix
R2 Coefficient of Determination REF Reference Electrode
REV Reduced Eigenvalue
RMS Root-Mean-Square
σ Standard Deviation
s Seconds
SEC Standard Error of the Calibration SEM Standard Error of the Mean
T Matrix Transpose
t Time
xviii
V Volts
Vc Matrix of the Relevant Principal Components of the Training Set
Vn Relevant Row Information of Training Set Voltammetric Matrix Calculated
From Singular Value Decomposition
w Total Number of Points in the Voltammetric Waveform
w/w Weight by Weight
WE Working Electrode
[X] Concentration of Analyte X [Y] Concentration of Analyte Y
CHAPTER I
BUILDING A BETTER MOUSETRAP FOR FAST-SCAN CYCLIC VOLTAMMETRY
Introduction
To an analytical chemist, the brain provides both an extremely interesting and challenging measurement environment. In vivo measurements require rapid time response, excellent sensitivity, low limits of detection, high selectivity, all in an
environment where biofouling is likely. By studying the brain, analytical chemists have the unique opportunity of improving in vivo measurement strategies while simultaneously learning fundamental information about brain signaling dynamics. The latter point may seem unusual to the traditional analytical chemist, but resolving long-standing questions in the field of neurobiology is exciting and often requires the unique skill set of an
analytical chemist. The analyst can contribute to multiple fields of study including normal behavior, disease states, and drug-seeking behaviors, all of which require thorough chemical characterization to unravel.
2
FSCV offers several advantages including sub-second temporal resolution, low nanomolar limits of detection, and the best selectivity of electrochemical methods for neuromodulator detection in vivo (Robinson and Wightman, 2007). A carbon-fiber microelectrode is typically used as the working electrode which gives two additional advantages: micrometer spatial resolution and minimal damage in vivo (Jaquins-Gerstl and Michael, 2009). One disadvantage to using FSCV is that a conventional commercial potentiostat is usually insufficient for in vivo recordings, so more sophisticated,
expensive custom-made instrumentation is needed (Takmakov et al., 2011). A true testament to any analytical chemistry technique is the number of non-analytical chemists that use it. FSCV is used today by psychologists, neuroscientists, pharmacologists, and others studying a variety of neurobiological applications. Measurement of the catecholamine dopamine has been of particular interest over the past several years. Dopamine is involved in various cognitive and motor processes (Cooper et al., 1996), with deficiencies in dopamine neurotransmission being associated with Parkinson’s disease. Dopamine plays a critical role in the reward circuitry system of the brain and drugs of abuse such as cocaine are thought to hijack this system,
contributing to drug addiction (Wightman and Robinson, 2002; Schultz, 2007).
Broadly, this work will highlight several recent advances in analytical chemistry regarding FSCV. Specifically, sensitivity improvements with proposed mechanisms, advancements in the measurement of analytes other than dopamine, and signal processing developments will be presented. Insights into neurotransmission gleaned from FSCV measurements are beyond the scope of this work and have recently been reviewed elsewhere (Robinson and Wightman, 2007; Huffman and Venton, 2009).
3
Much of the recent work on improving sensitivity of in vivo FSCV measurements relies on modifying the surface of the carbon-fiber microelectrode. One approach developed by Swamy and Venton involved coating single wall carbon nanotubes (SWCNTs) onto carbon-fiber microelectrodes (Swamy and Venton, 2007). The SWCNTs increased signal-to-noise ratios of dopamine measurements up to 2.5-fold without decreasing response time, a common disadvantage with other methods such as electrochemical pretreatment. The SWCNT-coated carbon-fiber microelectrodes also showed resistance to the fouling oxidation byproducts of serotonin and allowed for co-detection of dopamine and serotonin in vivo after the administration of a serotonin precursor.
Electrochemical oxidation is known to enhance the sensitivity towards positively charged neuromodulators through the creation of adsorption sites, but the additional adsorption sites decreases the response time of the microelectrode and can increase noise (McCreery, 1991; Bath et al., 2000; Heien et al., 2003b). Carbon-fiber
microelectrodes have recently been flame etched to improve signal to noise ratios towards dopamine. Flame etching lead to faster electron transfer kinetics, faster adsorption/desorption kinetics, and increased the signal to noise ratio for dopamine (Strand and Venton, 2008).
4
V/s was recorded and fed into the summing point of the current-to-voltage converter, thereby zeroing out some the measured response. Scan rate could then be increased without saturating the system to enhance the sensitivity for dopamine.
FSCV measurements are routinely made with a waveform with a potential limit of 1.0 V which has a rapid temporal response but poor sensitivity, or a potential limit of 1.3 V which has enhanced sensitivity but a poor temporal response (Heien et al., 2003b). Increasing the scan rate from 400 V/s to 2400 V/s with the 1.0 V excursion increased the signal-to-noise ratio in vitro for 1 µM dopamine to 1.3 + 0.2 x10³ and a stable four-fold
increase in peak current in vivo (Keithley et al., 2011). The 1.3 V waveform was adapted into a novel sawhorse design to maintain sensitivity over time with faster scan rate experiments. The 1.3 V sawhorse waveform at 2400 V/s increased the signal-to-noise ratio of 1 µM dopamine in vitro to 3.3 + 0.3 x10³, lowering the limit of detection to 0.96 +
0.08 nM.
A carbon electrode material based on the pyrolysis of novolac-containing
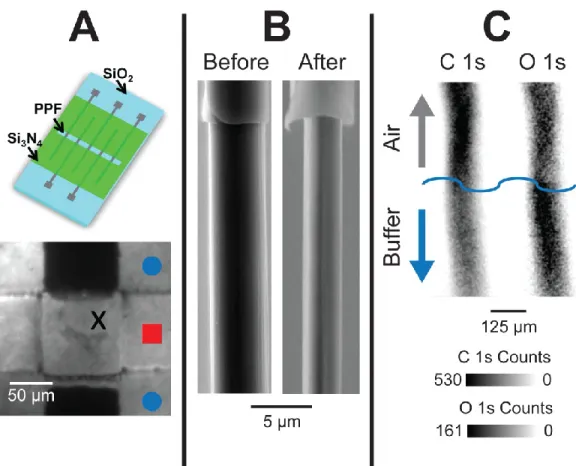
photoresists has recently been used to uncover the underlying mechanism for enhanced sensitivity with the 1.3 V waveform (Takmakov et al., 2010b). Pyrolyzed photoresist films (PPF) have electrochemical properties very similar to glassy carbon, but have the capability of being microfabricated using photolithographic methods (Ranganathan et al., 2000). Takmakov and coworkers microfabricated a PPF electrode with a similar
electroactive surface area of a carbon-fiber microelectrode onto a fused silica wafer (Figure 1.1A, top) (Takmakov et al., 2010b). Interestingly, after the application of the 1.3 V waveform for several hours, the electrode completely vanished (Figure 1.1A, bottom). When a carbon-fiber microelectrode was used, the electrode was visibly etched after the application of the 1.3 V waveform (Figure 1.1B). Both the PPF and carbon-fiber
5
6
Scanning to potential limits above 1.0 V with FSCV is known to overoxidize carbon surfaces (Hafizi et al., 1990; Heien et al., 2003b). Indeed, x-ray photoelectron spectroscopy (XPS) mapping of carbon and oxygen on a PPF-coated tungsten
microwire shows the application of the 1.3 V waveform increases the oxygen to carbon ratio on the electrode surface (Figure 1.1C). Unfortunately, the XPS signals can be faint because of the small area of the microelectrodes. Nevertheless, surface techniques such as XPS (Takmakov et al., 2010b), Raman spectroscopy (Roberts et al., 2010), and scanning electron and atomic force microscopies (Takmakov et al., 2010b; Keithley et al., 2011) are becoming routine to probe carbon microelectrode surface states
associated with FSCV measurements.
Taken together, the literature suggests that dopamine sensitivity with carbon surfaces scanned to moderate anodic potential limits depends on an oxidative etching mechanism. The idea of a renewable electrode surface is similar to that of traditional polarography experiments using a mercury drop electrode and may provide useful at resisting biofouling in vivo. The exact functional groups providing enhanced sensitivity are unknown, but are likely a combination of carboxylic groups, quinine moieties, and hydroxyl groups (Roberts et al., 2010; Takmakov et al., 2010a).
Pushing Beyond Rodent Dopamine
Dopamine is readily detected with FSCV in vivo because of its favorable electron transfer properties and the significant amounts of dopamine released in vivo that enable high signal-to-noise ratios. Furthermore, the regions where dopamine rich nerve
7
determined that maximal dopamine release occurred during stimulations typically given to patients afflicted with the disease.
The field of neuroeconomics blends neuroscientific observations, social sciences, and economic theories to try and understand the basis value judgments and human choice (Glimcher, 2011). Dopamine release has also been detected in the human striatum to investigate the role of dopamine in economic decision making (Sandberg et al., 2010). A subject was given the opportunity to invest money in a fictional stock market. It was shown that dopamine activity in this subject was a significant predictor of future market performance, indicating that dopamine may be an important player guiding human preference and choice.
Rice and Nicholson were the first to identify pH change using FSCV (Rice and Nicholson, 1989), but the origin of the characteristic peaks of its cyclic voltammogram were poorly characterized. Takmakov et al. identified several peaks consistent with in vivo pH change cyclic voltammograms: a C-peak at approximately -0.2 V on the oxidative sweep, a QH-peak at approximately 0.3 V on the oxidative sweep, and a Q-peak at approximately -0.3 V on the reductive sweep (Takmakov et al., 2010a). The C-peak is associated with non-faradaic charging of the electrode double layer and the QH- and Q-peaks are associated with hydroquinone electrochemistry at the electrode
surface. The authors also identified a fourth peak associated with
3,4-dihydroxyaceticacid (DOPAC), a metabolite of dopamine that is present in the extracellular fluid. In vivo pH changes could also be induced without neuronal stimulation through inhalation of carbon dioxide. Most importantly, it was determined that the commonly used TRIS buffering system for calibration was unsuitable for proper generation of pH change cyclic voltammograms in vitro.
8
been recently measured in the brains of non-human primates during reward delivery (Heien, 2005; Hermans, 2007). A cue preceding a predicted juice induced a basic pH change while a long term acidic shift was recorded after the juice reward delivery. These results correlated with those of functional magnetic resonance imaging, a technique conventionally used to measure neuronal activation in vivo.
Norepinephrine is a catecholamine involved in learning, stress and drug addiction, but its detection in vivo is difficult because the shape of its cyclic
voltammogram is nearly identical to dopamine, physiological concentrations are low, and brain structures containing measureable levels of norepinephrine are only a few hundred microns in size (Park et al., 2009). Park et al. recently used FSCV to study
norepinephrine signaling dynamics for the first time in vivo in the ventral bed nucleus of the stria terminalis, a major relay center for processing stressful and anxiety causing stimuli (Park et al., 2009). Because of the similar shape of dopamine and
norepinephrine cyclic voltammograms, tissue content, anatomical, and pharmacological evidence was used to verify that norepinephrine rather than dopamine was detected. This study opens the door for using FSCV to study the connection between stress and drug addiction in freely-moving animals.
9
Hashemi et al. identified that the presence of 5-hydroxyindoleacetic acid (5-HIAA), a metabolite of serotonin present in the extracellular space in concentrations up to 1000 times larger than serotonin, also caused fouling of the carbon-fiber
microelectrode (Hashemi et al., 2009). 5-HIAA is washed out during normal brain slice preparations which would allow for its detection in vitro. Nafion® was electrodeposited onto the carbon-fiber microelectrode to prevent the negatively charged 5-HIAA from reaching and fouling the electrode surface. This modification allowed for the first measurement of endogenous serotonin release and uptake in the intact mammalian brain.
Adenosine is associated with metabolism, regulation of blood flow, and
modulation of neurotransmitter release in the brain (Cunha, 2001). Swamy and Venton extended the anodic potential limit of the FSCV waveform to 1.5 V and characterized the electrochemical properties of adenosine (Swamy and Venton, 2006). Cechova and Venton then used this approach to simultaneously measure dopamine and adenosine efflux in vivo (Cechova and Venton, 2008). They also found that adenosine and oxygen efflux correlated after neuronal stimulation. Recent works have also been published using FSCV to characterize the release and transport of adenosine (Cechova et al., 2010; Pajski and Venton, 2010).
10
electroactive and non-electroactive neuromodulators voltammetrically rather than amperometrically which will greatly improve the selectivity. Furthermore, the greater selectivity of FSCV may reduce the need for electrode coatings, allowing for the fabrication of biosensors with a faster temporal response over conventional enzyme modified electrodes.
In Vivo Microelectrode Design Developments
The modern era of microelectrode development for in vivo neuroanalytical measurements began with an enzyme-modified glutamate sensor developed by the Wilson group (Hu et al., 1994). Gerhardt introduced ceramic-based microelectrode devices for neuromodulator detection (Burmeister et al., 2000; Burmeister et al., 2002; Burmeister et al., 2004), which are stronger than traditional microfabricated silicon substrates and nonconducting. These electrodes have been used to amperometrically detect several analytes in vivo (Burmeister et al., 2004; Parikh et al., 2004; Parikh et al., 2007) using a self-referencing technique for the elimination of interferents (Burmeister and Gerhardt, 2001).
Recent progress has also been made in the development of microelectrodes for
in vivo FSCV measurements. Carbon-fiber microelectrodes are traditionally insulated using pulled glass because of easy fabrication and low cost, but these sensors are fragile and prone to breakage during in vivo use. Fused silica has previously been shown to be a well insulating, flexible alternative to glass for carbon-fiber
microelectrodes (Swiergiel et al., 1997; Gerhardt et al., 1999). An array of fused silica insulated carbon-fiber microelectrodes were used to monitor dopamine release at
11
Clark and co-workers recently showed that fused silica insulated carbon-fiber microelectrodes can be implanted for chronic measurements of neuromodulator release
in vivo because the polyimide insulation surrounding the fused silica resists the immune response (Clark et al., 2009). The electrodes were epoxied at the tip similar to the previous designs so they were more robust in vivo. The authors were able to monitor dopamine changes that occurred over several days as an animal acquired behavior, an unprecedented measurement on the sub-second time scale. While extremely powerful, a problem exists in that there is no way to validate the stability of the carbon-fiber microelectrode in vivo in real time. A decreased response could be indicative of decreased neuromodulator release/efflux or the degradation of the carbon-fiber
microelectrode. The microelectrodes would then have to be excised from the skull and tested in vitro to identify the cause for any decrease in signal amplitude in vivo.
Microfabricated devices have also been used for FSCV measurements using PPF as the working electrode material. Dopamine and oxygen were simultaneously and separately detected in vitro with two different waveforms applied to two different
microelectrodes on the same probe (Zachek et al., 2009). The original probe design was made smaller for in vivo use and dopamine was detected at multiple locations in vivo, highlighting differences in local neurotransmitter release upon the administration of pharmaceutical agents (Zachek et al., 2010a).
Unscrambling Mixed Messages with Principal Component Regression.
12
Traditional approaches to calculate simultaneous dopamine and pH changes included visual matching of the pseudocolor representation of measured currents (Michael et al., 1998), statistical matching based on coefficients of determination (R2)
and mean-squared error values (Robinson et al., 2003; Cheer et al., 2004; Stuber et al., 2005), differential subtraction in the current versus time dimension (Phillips et al., 2003b; Phillips et al., 2003c; Cheer et al., 2004), and a sliding digital background algorithm (Stuber et al., 2005). The disadvantage of visual matching is that the analysis was highly subjective user bias could occur. Statistical matching and the sliding digital background approach avoid these criticisms, but are difficult to apply to multiple sequential cyclic voltammograms. Principal component regression (PCR) of in vivo
FSCV data eliminates many of these restrictions and allows for improved concentration prediction (Heien et al., 2004b; Heien et al., 2005). PCR is a multivariate technique, meaning that signal quantitation is based on the amplitude and shape of the entire unknown cyclic voltammogram rather than peak current amplitude at a single potential. (Keithley et al., 2009; Keithley et al., 2010a).
PCR consists of four steps (Keithley et al., 2009; Keithley et al., 2010a). First, a set of representative reference in vivo cyclic voltammograms at known concentrations (termed a training set) is assembled. Second, principal component analysis is
performed to separate the relevant principal components (PCs) that are necessary for accurate concentration prediction from principal components that describe only noise. Next, regression analysis is used to relate the distance of the training set cyclic
voltammograms along the relevant PCs (called scores) to the reference concentration values. Finally, unknown concentration values are predicted by calculating the relevant scores of the unknown data and using the calibration relationship from the training set.
13
predicted (Heien et al., 2005). PCR prediction of neuromodulator concentrations was improved by incorporating a statistical test during the separation of the relevant PCs from the noise PCs (Keithley et al., 2010b). This allowed for proper separation of relevant information from noise and improved the accuracy of the residual analysis procedure. The PCR with residual analysis procedure was further improved by the incorporation of other control procedures that increased the accuracy and robustness of concentration prediction for in vivo FSCV measurements (Keithley and Wightman).
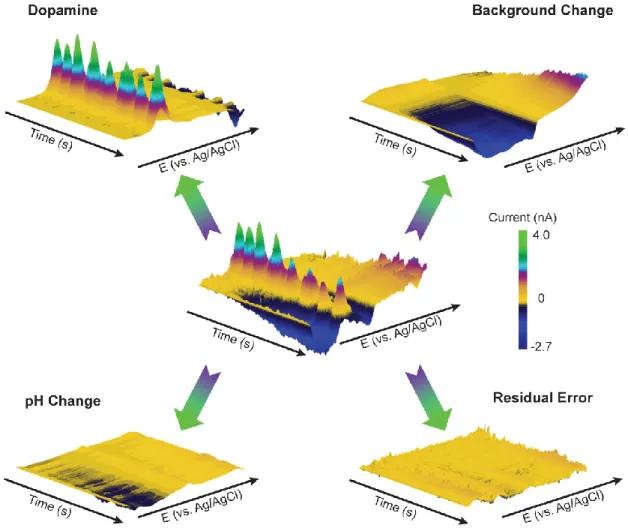
Figure 1.2 shows the strength of PCR in the separation of multiple analytes during a typical in vivo FSCV measurement. A carbon-fiber microelectrode was lowered into the nucleus accumbens of a freely moving rat. The data shown in three-dimensional color representation at the center of Figure 1.2 was recorded three minutes after an intravenous dose of cocaine (0.3 mg/kg). Clearly, several analytes with distinct voltammetric signatures that overlap are recorded. PCR can separate this mixed neurochemical message into contributions from dopamine and pH change, even in the presence of substantial background electrode drift. All unknown currents not accounted for by the relevant PCs of the training set are contained in the residual. If any
deterministic error is present in the residual, it can alert the user that the calibration model may not be appropriate to predict neuromodulator concentrations (Keithley and Wightman).
14
Figure 1.2. PCR signal separation of complex in vivo FSCV data.
15
prediction), oscillations in each analyte ―channel‖ can be directly compared on the same scale.
Figure 1.3 shows the charge curves for each species as a function of time. The dopamine channel has large oscillations compared to pH change and background change. Because background change has no physiological relevance, the oscillations in this channel can be taken as a measure of noise (electronic and electrode) in the system (Hermans et al., 2008). The standard deviation of the oscillations in each channel was 1.1 pC for dopamine, 0.4 pC for pH change, and 0.4 pC for background drift. Comparing dopamine and pH change oscillations to background oscillations shows that after
cocaine, dopamine levels significantly fluctuated while pH change did not. This behavior was expected because cocaine is known to cause transient concentration changes in dopamine (Heien et al., 2005). Therefore, analyzing background electrode drift can be useful in separating relevant information from noise.
Concluding Remarks
While the utility of in vivo electrochemistry has grown considerably over recent years, there remains considerable opportunity for analytical chemists to move the field forward. The works presented here highlight that there is still considerable research interest in increasing sensitivity for carbon-based in vivo FSCV microelectrodes. While every analytical chemist can benefit from enhanced sensitivity, FSCV measurements coupled to iotophoresis (Herr et al., 2010) and electrophysiology (Cheer et al., 2005) both suffer from decreased sensitivity. However, it is ideal that any method for enhanced sensitivity does not increase the temporal response of the carbon-based microelectrode.
16
17
microelectrodes should allow for extreme precision in electrode design, ruggedness of the electrochemical sensor, spatial precision, and decreased microelectrode variability. One challenge that still remains is decreasing the size of the sensor to a size
comparable to carbon-fiber microelectrodes for minimal damage in vivo (Jaquins-Gerstl and Michael, 2009). Recent developments in electrophysiological probe design allow for three-dimensional spatial detection (X, Y, and depth positioning, (Langhals and Kipke, 2009)) and construction of three-sided microelectrode arrays along the edge of a device (Seymour et al., 2011). Both of the approaches could be applied to improve FSCV measurements in vivo.
Data analysis strategies can also be improved. So far, the only chemometric method incorporated into the analysis of in vivo FSCV data is PCR. PCR is simple, yet unsophisticated. Other methods such as partial least-squares, multivariate curve
resolution, and independent component analysis could improve concentration prediction. If other methods are investigated, controls such as the residual analysis
procedure for PCR must be included in the analysis so the user does not merely copy concentration data from computer like a general chemistry student from their calculator. Another caution to the analytical chemist is that a rat is not a beaker. In vivo
18 References
Bath BD, Michael DJ, Trafton BJ, Joseph JD, Runnels PL, Wightman RM (2000) Subsecond adsorption and desorption of dopamine at carbon-fiber microelectrodes. Anal Chem 72:5994-6002.
Baur JE, Kristensen EW, May LJ, Wiedemann DJ, Wightman RM (1988) Fast-Scan Voltammetry of Biogenic-Amines. Anal Chem 60:1268-1272.
Burmeister JJ, Gerhardt GA (2001) Self-referencing ceramic-based multisite microelectrodes for the detection and elimination of interferences from the measurement of L-glutamate and other analytes. Anal Chem 73:1037-1042. Burmeister JJ, Moxon K, Gerhardt GA (2000) Ceramic-based multisite microelectrodes
for electrochemical recordings. Anal Chem 72:187-192.
Burmeister JJ, Coates TD, Gerhardt GA (2004) Multisite microelectrode arrays for measurements of multiple neurochemicals. Conf Proc IEEE Eng Med Biol Soc 7:5348-5351.
Burmeister JJ, Pomerleau F, Palmer M, Day BK, Huettl P, Gerhardt GA (2002) Improved ceramic-based multisite microelectrode for rapid measurements of -glutamate in the CNS. J Neurosci Meth 119:163-171.
Cechova S, Venton BJ (2008) Transient adenosine efflux in the rat caudate–putamen. Journal of Neurochemistry 105:1253-1263.
Cechova S, Elsobky AM, Venton BJ (2010) A1 receptors self-regulate adenosine release in the striatum: evidence of autoreceptor characteristics. Neuroscience 171:1006-1015.
Cheer JF, Wassum KM, Heien MLAV, Phillips PEM, Wightman RM (2004) Cannabinoids Enhance Subsecond Dopamine Release in the Nucleus Accumbens of Awake Rats. J Neurosci 24:4393-4400.
Cheer JF, Heien MLAV, Garris PA, Carelli RM, Wightman RM (2005) Simultaneous dopamine and single-unit recordings reveal accumbens GABAergic responses: Implications for intracranial self-stimulation. Proc Natl Acad Sci U S A 102:19150-19155.
Clark JJ, Sandberg SG, Wanat MJ, Gan JO, Horne EA, Hart AS, Akers CA, Parker JG, Willuhn I, Martinez V, Evans SB, Stella N, Phillips PEM (2009) Chronic
microsensors for longitudinal, subsecond dopamine detection in behaving animals. Nat Meth 7:126-129.
Cooper JR, Bloom FE, Roth RH (1996) The biochemical basis of neuropharmacology. New York: Oxford University Press.
Cunha RA (2001) Adenosine as a neuromodulator and as a homeostatic regulator in the nervous system: different roles, different sources and different receptors.
19
Gerhardt GA, Ksir C, Pivik C, Dickinson SD, Sabeti J, Zahniser NR (1999) Methodology for coupling local application of dopamine and other chemicals with rapid in vivo
electrochemical recordings in freely-moving rats. J Neurosci Meth 87:67-76. Glimcher PW (2011) Foundations of neuroeconomic analysis. Oxford ; New York: Oxford
University Press.
Hafizi S, Kruk ZL, Stamford JA (1990) Fast cyclic voltammetry: improved sensitivity to dopamine with extended oxidation scan limits. J Neurosci Meth 33:41-49. Halliwell B (2006) Oxidative stress and neurodegeneration: where are we now? Journal
of Neurochemistry 97:1634-1658.
Hashemi P, Dankoski EC, Petrovic J, Keithley RB, Wightman RM (2009) Voltammetric Detection of 5-Hydroxytryptamine Release in the Rat Brain. Anal Chem 81:9462-9471.
Heien M, Khan AS, Ariansen JL, Cheer JF, Phillips PEM, Wassum KM, Wightman RM (2005) Real-time measurement of dopamine fluctuations after cocaine in the brain of behaving rats. Proc Natl Acad Sci U S A 102:10023-10028.
Heien ML (2005) Probing dopamine release and function with carbon-fiber
microelectrodes. In: Doctoral Dissertation (Wightman RM, ed). Chapel Hill, N.C.: University of North Carolina at Chapel Hill.
Heien ML, Johnson MA, Wightman RM (2004) Resolving neurotransmitters detected by fast-scan cyclic voltammetry. Anal Chem 76:5697-5704.
Heien ML, Phillips PE, Stuber GD, Seipel AT, Wightman RM (2003) Overoxidation of carbon-fiber microelectrodes enhances dopamine adsorption and increases sensitivity. Analyst 128:1413-1419.
Hermans A (2007) Fabrication and applications of dopamine-sensitive electrodes. In: Doctoral Dissertation (Wightman RM, ed). Chapel Hill, N.C.: University of North Carolina at Chapel Hill.
Hermans A, Keithley RB, Kita JM, Sombers LA, Wightman RM (2008) Dopamine detection with fast-scan cyclic voltammetry used with analog background subtraction. Anal Chem 80:4040-4048.
Herr NR, Belle AM, Daniel KB, Carelli RM, Wightman RM (2010) Probing Presynaptic Regulation of Extracellular Dopamine with Iontophoresis. ACS Chem Neurosci 1:627-638.
Hu Y, Mitchell KM, Albahadily FN, Michaelis EK, Wilson GS (1994) Direct measurement of glutamate release in the brain using a dual enzyme-based electrochemical sensor. Brain Res 659:117-125.
20
Jackson BP, Dietz SM, Wightman RM (1995) Fast-Scan Cyclic Voltammetry of 5-Hydroxytryptamine. Anal Chem 67:1115-1120.
Jaquins-Gerstl A, Michael AC (2009) Comparison of the brain penetration injury associated with microdialysis and voltammetry. J Neurosci Meth 183:127-135. Keithley RB, Wightman RM Assessing principal component regression with residual
analysis in the detection of neuromodulators. In Preparation.
Keithley RB, Wightman RM, Heien ML (2009) Multivariate concentration determination using principal component regression with residual analysis. TrAC Trends Anal Chem 28:1127-1136.
Keithley RB, Wightman RM, Heien ML (2010a) Erratum to Multivariate concentration determination using principal component regression with residual analysis. TrAC Trends Anal Chem 29:110-110.
Keithley RB, Carelli RM, Wightman RM (2010b) Rank Estimation and the Multivariate Analysis of in vivo Fast-Scan Cyclic Voltammetric Data. Anal Chem 82:5541-5551.
Keithley RB, Takmakov P, Bucher ES, Belle AM, Owesson-White CA, Park J, Wightman RM (2011) Higher Sensitivity Dopamine Measurements with Faster-Scan Cyclic Voltammetry. Anal Chem Submitted.
Kishida KT, Klann E (2007) Sources and targets of reactive oxygen species in synaptic plasticity and memory. Antioxid Redox Signal 9:233-244.
Langhals NB, Kipke DR (2009) Validation of a novel three-dimensional electrode array within auditory cortex. In: Engineering in Medicine and Biology Society, 2009. EMBC 2009. Annual International Conference of the IEEE, pp 2066-2069.
McCreery RL (1991) Carbon Electrodes: Structural Effects on Electron Transfer Kinetics. In: Electroanalytical Chemistry: A Series of Advances (Bard AJ, ed), pp 221-374. New York, NY: Marcel Dekker.
Michael D, Travis ER, Wightman RM (1998) Color images for fast-scan CV. Anal Chem 70:586a-592a.
Pajski ML, Venton BJ (2010) Adenosine Release Evoked by Short Electrical
Stimulations in Striatal Brain Slices is Primarily Activity Dependent. ACS Chem Neurosci 1:775-787.
Parikh V, Kozak R, Martinez V, Sarter M (2007) Prefrontal Acetylcholine Release Controls Cue Detection on Multiple Timescales. Neuron 56:141-154. Parikh V, Pomerleau F, Huettl P, Gerhardt GA, Sarter M, Bruno JP (2004) Rapid
21
Park J, Kile BM, Wightman RM (2009) In vivo voltammetric monitoring of norepinephrine release in the rat ventral bed nucleus of the stria terminalis and anteroventral thalamic nucleus. Eur J Neurosci 30:2121-2133.
Phillips PEM, Stuber GD, Heien MLAV, Wightman RM, Carelli RM (2003a) Subsecond dopamine release promotes cocaine seeking. Nature 422:614-618.
Phillips PEM, Stuber GD, Heien MLAV, Wightman RM, Carelli RM (2003b) Subsecond dopamine release promotes cocaine seeking, Erratum. Nature 423:461-461. Ranganathan S, McCreery R, Majji SM, Madou M (2000) Photoresist-derived carbon for
microelectromechanical systems and electrochemical applications. Journal of the Electrochemical Society 147:277-282.
Rice ME, Nicholson C (1989) Measurement of nanomolar dopamine diffusion using low-noise perfluorinated ionomer-coated carbon fiber microelectrodes and high-speed cyclic voltammetry. Anal Chem 61:1805-1810.
Roberts JG, Moody BP, McCarty GS, Sombers LA (2010) Specific Oxygen-Containing Functional Groups on the Carbon Surface Underlie an Enhanced Sensitivity to Dopamine at Electrochemically Pretreated Carbon Fiber Microelectrodes. Langmuir 26:9116-9122.
Robinson DL, Wightman RM (2007) Rapid Dopamine Release in Freely Moving Rats. In: Electrochemical Methods for Neuroscience (Michael AC, Borland LM, eds), pp 17-34. Boca Raton, FL, USA: CRC Press.
Robinson DL, Venton BJ, Heien ML, Wightman RM (2003) Detecting subsecond dopamine release with fast-scan cyclic voltammetry in vivo. Clin Chem 49:1763-1773.
Sandberg SG, Kishida K, Lohrenz T, Comair Y, Montague PR, Phillips PE (2010) Sub-second dopamine detection in human striatum. In: Monitoring Molecules in Neuroscience, 13th International Conference on In vivo Methods, pp 188-191. Brussels, Belgium.
Schultz W (2007) Multiple dopamine functions at different time courses. Annual Review of Neuroscience 30:259-288.
Seymour J, Langhals N, Anderson D, Kipke D (2011) Novel multi-sided, microelectrode arrays for implantable neural applications. Biomedical Microdevices:In Press. Shon Y-M, Lee KH, Goerss SJ, Kim IY, Kimble C, Van Gompel JJ, Bennet K, Blaha CD,
Chang S-Y (2010) High frequency stimulation of the subthalamic nucleus evokes striatal dopamine release in a large animal model of human DBS neurosurgery. Neuroscience Letters 475:136-140.
22
Stuber GD, Roitman MF, Phillips PEM, Carelli RM, Wightman RM (2005) Rapid dopamine signaling in the nucleus accumbens during contingent and noncontingent cocaine administration. Neuropsychopharmacol 30:853-863. Swamy BEK, Venton BJ (2006) Subsecond Detection of Physiological Adenosine
Concentrations Using Fast-Scan Cyclic Voltammetry. Anal Chem 79:744-750. Swamy BEK, Venton BJ (2007) Carbon nanotube-modified microelectrodes for
simultaneous detection of dopamine and serotonin in vivo. Analyst 132:876-884. Swiergiel AH, Palamarchouk VS, Dunn AJ (1997) A new design of carbon fiber
microelectrode for in vivo voltammetry using fused silica. J Neurosci Meth 73:29-33.
Takmakov P, McKinney CJ, Carelli RM, Wightman RM (2011) Instrumentation for Fast-Scan Cyclic Voltammetry Combined with Electrophysiology for Behavioral Experiments in Freely Moving Animals. Review of Scientific Instruments Submitted.
Takmakov P, Zachek MK, Keithley RB, Bucher ES, McCarty GS, Wightman RM (2010a) Characterization of Local pH Changes in Brain Using Fast-Scan Cyclic
Voltammetry with Carbon Microelectrodes. Anal Chem 82:9892-9900.
Takmakov P, Zachek MK, Keithley RB, Walsh PL, Donley C, McCarty GS, Wightman RM (2010b) Carbon Microelectrodes with a Renewable Surface. Anal Chem 82:2020-2028.
Venton BJ, Michael DJ, Wightman RM (2003) Correlation of local changes in
extracellular oxygen and pH that accompany dopaminergic terminal activity in the rat caudate-putamen. Journal of Neurochemistry 84:373-381.
Wightman RM, Robinson DL (2002) Transient changes in mesolimbic dopamine and their association with 'reward'. Journal of Neurochemistry 82:721-735.
Zachek MK, Takmakov P, Moody B, Wightman RM, McCarty GS (2009) Simultaneous Decoupled Detection of Dopamine and Oxygen Using Pyrolyzed Carbon Microarrays and Fast-Scan Cyclic Voltammetry. Anal Chem 81:6258-6265. Zachek MK, Takmakov P, Park J, Wightman RM, McCarty GS (2010a) Simultaneous
monitoring of dopamine concentration at spatially different brain locations in vivo. Biosens Bioelectron 25:1179-1185.
CHAPTER II
MULTIVARIATE CONCENTRATION DETERMINATION USING PRINCIPAL COMPONENT REGRESSION WITH RESIDUAL ANALYSIS
Abstract
Data analysis is an essential tenet of analytical chemistry, extending the possible information obtained from the measurement of chemical phenomena. Chemometric methods have grown considerably in recent years, but are still considered by some too complicated hindering wide use. The purpose of this review is to inform a general scientific audience about a multivariate chemometric method, principal component regression, in a simple manner from the point of view of an analytical chemist, to
demonstrate the need for proper quality control measures in multivariate analysis, and to advocate the use of residuals as a proper method of quality control.
Introduction
Advances in electronics and computing over the past 30 years have
24
The advances in computing allow researchers to obtain more and more chemically relevant information from their data; however this is not always achieved using simple data processing techniques.
Svante Wold first coined the term kemometri (chemometrics in English) in 1972 by combining the words kemo for chemistry and metri for measure (R. Kiralj, 2006). Presently, the journal Chemometrics and Intelligent Laboratory Systems defines
chemometrics as ―the chemical discipline that uses mathematical and statistical methods to design or select optimal procedures and experiments, and to provide maximum
chemical information by analyzing chemical data‖ (Elsevier, 2009). The field of chemometrics has also benefitted from technological advances in the past 30 years, causing the number of researchers using chemometric methods to grow (Brown and Bear, 1993; Bro, 2003; Lavine and Workman, 2008). Unfortunately, however,
chemometrics has not been as rapidly integrated into the analytical laboratory as other advances.
The slow adaptation of these methods may be attributed to several factors. Technical articles on the subject are often written by chemometricians for
chemometricians; it can be difficult for the general scientist to approach this field and comprehend the material presented. Even introductory texts and review articles often require working knowledge of linear algebra and matrix manipulations. Chemometric methods have developed such that they are readily available to any scientist and in this article we hope to show the importance of chemometrics to the benchtop analytical chemist in concentration determination using a technique known as principal component regression.
25
Traditional concentration determinations are usually univariate, isolating one variable such as peak current at one potential in an electrochemical measurement or the wavelength of maximum absorbance in a spectroscopic measurement. While intuitive and simple, this approach to data analysis is limited and wasteful. As an example, consider a UV-VIS spectrum of a particular analyte containing 500 data points. With only one data point being used for concentration determination (absorbance at one wavelength), after identification 99.8% of the data will be discarded. Data collection can limit the throughput of an analytical methodology; it is not efficient to collect data that will not be used. In addition, a univariate measurement is extremely sensitive to interferents. It is often times impossible to differentiate an analyte-specific signal from an interferent when looking only at one point of a data spectrum.
Multivariate calibration methods involve the use of the multiple variables such as the response at a range of potentials or wavelengths, or even over the entire range collected to calculate concentrations. This offers several advantages, often reducing noise and removing interferents (Bro, 2003). It can be easier to identify and remove noise when looking at the entire data set, rather than one point. In addition, interferents can be taken into account, provided their measurement profile differs sufficiently from the analyte of interest (Heien et al., 2004a). Multivariate methods are generally better than univariate methods. They increasing the amount of possible information that can be obtained without losing any information; multivariate models can always be simplified to a univariate model (Bro, 2003). The advantages of multivariate methods come at a cost of computational power and complexity, but these drawbacks are easily handled with common mathematical software packages such as Matlab.
26
performed behind the computer screen. Chemometricians have derived a series of rules, statistical tests, and other criteria in order for users to judge and validate the accuracy of the information obtained with multivariate methods (International, 2000). It is important for any new user of multivariate methods to remember that the computer will always give an output but it is up to the scientist to make sure that both precautions are taken and the answers obtained make chemical sense.
Construction of a multivariate model: principal component regression
Principal component regression (PCR) is a basic, but very powerful multivariate calibration method. A brief overview of PCR will be presented here, but for a more detailed explanation readers are referred elsewhere (Jackson, 2004). In addition, Kramer offers an excellent review of the topic in a manner that the benchtop analytical chemist can understand and use and we highly recommend it to anyone interested in using the technique (Kramer, 1998b). PCR is a combination of principal component analysis (PCA) and least-squares regression.
When discussing multivariate analysis techniques, including PCR, three terms are often used: variance, vector, and projection. Variance is another word for
information of a data set. Sources of variance within a data set include the changes in the chemical make-up of analyzed samples (concentrations and/or composition),
changes in environmental parameters (e.g. temperature, pressure, etc.), and changes in instrument performance such (e.g. a drifting baseline). The term vector is used to describe a line segment in a coordinate system with a specific direction (e.g. an axis) and the term projection is used to describe the distance of a point along a vector.
We will illustrate how PCR is performed using simulated data taken from a hypothetical UV-VIS experiment. This example is an oversimplification, but explains the technique of PCR in a manner that can be easily understood without overbearing
27
The solid line in Figure 2.1A shows an example UV-VIS absorption trace of component X at a specific concentration, [X]. The information in the absorption spectrum of component X can be plotted in a different manner (Figure 2.1B). Figure 2.1B shows a plot of the intensities at 425 nm and 475 nm. Component X has intensities of 0.1 A.U. and 0 A.U. at 425 nm and 475 nm, respectively and can be represented as the point (0.1, 0) in the two-dimensional coordinate system shown in Figure 2.1B. According to Beer’s law, if analyte X is doubled ([2X]), tripled ([3X]), and quadrupled ([4X]), the absorbance spectrum will increase by 2, 3, and 4-fold, respectively, as shown in the dashed lines in Figure 2.1A. These absorption spectra can also be plotted the same way as the first spectrum in a two-dimensional manner as shown in Figure 2.1B (purple squares). Similarly, component Y, which has a different absorption spectrum (Figure 2.1C) and at concentrations [Y], [2Y], [3Y], and [4Y] can be plotted in a two-dimensional manner as shown in Figure 2.1D (green diamonds) as multiples of the point (0, 0.1).
As shown in Figures 2.1B and 2.1D, lines can be drawn through the
two-dimensional representations of the absorption spectra of components X and Y. Each of these lines describes important information about the measured absorption spectra. The horizontal line in Figure 2.1B describes how intensities change based on [X] and the vertical line in Figure 2.1D describes how intensities change based on [Y]. In this simplified case, moving in a horizontal direction in these graphs describes only how [X] is changing and says nothing about how [Y] is changing. Conversely, moving in a vertical direction in these graphs describes only how [Y] is changing and says nothing about how [X] is changing. Mathematically speaking these lines are orthogonal,
28
29
components can be thought of as vectors in an abstract coordinate system that describe sources of variance of a data set. Chemometricians and mathematicians advocate the use of a slightly different definition of a principal component, but our definition is
common and is used in many introductory texts (Kramer, 1998b; Jolliffe, 2004a; Ralston et al., 2004).
The projection of the points onto the principal components shown in Figures 2.1B and 2.1D is related to concentration just like a traditional univariate calibration curve. Figure 2.1E shows an example of an absorption spectrum from an unknown mixture of components X and Y. It can be represented as the point (0.3, 0.2) in the
two-dimensional space depicted in Figure 2.1F. This unknown sample has a projection along the horizontal principal component of 0.3 and a projection along the vertical principal component of 0.2, correspond to concentrations of [3X] and [2Y]. Comparing the unknown spectrum in Figure 2.1E with the standards in Figure 2.1B and 2.1D confirm this result. Mathematically, the projection onto a principal component is related to concentration by performing a simple least-squares regression.
In a univariate calibration, known concentrations of standards are assembled. Peak responses are plotted as a function of concentration and a regression is performed relating a measured value to concentration. Finally, the measured response is projected back onto the calibration line in order to determine a concentration. PCR is a
multivariate calibration method that works in a similar manner using up to all the data points in a spectrum instead of just one. First, a series of known spectra and
30
sample onto the principal component and relating its distance back to concentration (Kramer, 1998a).
The number of principal components calculated equals the number of spectra in the training set that are input into the algorithm, but principal components themselves are not always directly interpretable. The above example showed that one principal component described only component X and one principal component described only component Y, but principal components are abstract and should not be thought of as belonging solely to one component or as pure analyte spectra (Brown and Green, 2009). Sometimes, however, mathematical manipulations can be performed on the principal components in order to give the user something that relates back to a specific source of variance in the experiment (Jolliffe, 2004b).
PCR offers several advantages to an analytical chemist. First, one can separate and retain principal components that describe relevant information and discard principal components that contain noise, thereby eliminating sources of random error. Principal components that describe relevant information should have larger projections because they describe more of the collected dataset than those that describe noise, which should be a small percentage of the overall measured signal. There are numerous ways to decide how many principal components to keep, but all rely on the same basic assumption that principal components that describe relevant information will describe more of the collected data than principal components that describe only noise
31
can be reduced by from 600,000 (1,000 points x 10 Hz x 60 s) to 1,800 (3 x 10 Hz x 60 s), or 0.3% of the size of the original data set. This example illustrates how PCA can reduce the dimensionality, or size, of a data set by orders of magnitude and still keep the relevant information.
Samples used in multivariate training sets must meet several requirements (Kramer, 1998d; International, 2000). First, training set samples must contain all expected components because concentrations obtained may not be accurate if the unknown sample contains spectral information not present in the training set. Second, training set samples must uniformly span the expected concentrations of each of the components to insure that unknown concentrations fall within the calibration range. Third, training set samples must span the conditions of interest in order to properly account for environmental parameters and sample matrix. Fourth, samples used in training sets must be mutually independent. Samples created by serial dilutions are examples of samples that are not mutually independent because relative concentrations of the different components and relative errors in the concentration values are do not vary. Finally, there needs to be sufficient number of samples in the training set to build an accurate model. For infrared data, ASTM International recommends at least 24 samples for a model that contains up to 3 relevant principal components and 6 samples per relevant principal component for a model with more than 3 relevant principal
components. Unfortunately, this means that a user will only know if enough samples were included in the training set after a model is constructed.
32
Figure 2.2. PCR deconvolution of in vivo electrochemical data. A) Color plot representation of cyclic voltammograms taken in the brain of a freely moving rat after a stimulation given at 0 s (60 Hz, 24 pulses, 300 µA depicted by the red bar). Each vertical slice represents a cyclic voltammogram collected at a specific time point and each horizontal slice represents a current versus time trace at a specific potential. The horizontal dashed line represents the oxidation potential of dopamine, 0.6 V. Insets are cyclic voltammograms of dopamine (red, taken at the dashed line at 0 sec) and pH (blue, taken at the dashed line at 5 sec) with arrows drawn indicating the direction of the
voltammetric sweep. B) Current versus time trace at the oxidation potential of
33
terminals while a stimulating electrode is placed in a region containing dopaminergic cell bodies. Figure 2.2A displays in vivo cyclic voltammograms in the form of a color plot, with each vertical slice a cyclic voltammogram at a specific time point, each horizontal slice a current versus time trace at a specific potential, and current in false color. The cyclic voltammograms taken around 0 s are characteristic of the neurotransmitter dopamine while those taken between 2 and 10 s are characteristic of a pH change (Figure 2.2A inset). The increase in dopamine concentration occurs due to a local stimulation given to the cell bodies of dopaminergic neurons that causes release in the terminal region. The observed pH response is due to changes in blood flow and
metabolism accompanying terminal activity which cause a decrease in carbon dioxide, a component of the extracellular buffering system of the brain (Venton et al., 2003). The current versus time trace taken at the oxidation potential of dopamine in Figure 2.2B shows a convoluted response between dopamine and pH so a univariate calibration would be insufficient to determine dopamine concentration as a function of time. Using a training set of in vivo cyclic voltammograms of dopamine and pH at varying intensities, PCR can separate these two components and generate concentration traces for each analyte as shown in Figure 2.2C.
PCR Model Validation
34
(PRESS) is the squared difference between the actual and predicted concentrations for all validation samples and serves as a figure of merit for the multivariate model (Kramer, 1998c). PRESS gives the experimenter an idea of how well the model can predict new concentrations and how much error can be expected in the concentrations obtained from the analysis of unknowns. The extra work to validate a model before running an
experiment is necessary; it is better to test the accuracy of a model first rather than using it blindly on unknowns and hoping for accuracy (Kramer, 1998c).
Unfortunately, validation samples are not always available due to cost, time constraints, or other experimentation conditions. In these cases the training set can be used as a test set in a process called cross validation. When using cross validation with PCR, the regression is performed using all the samples of the training set except one. The concentration of this training set sample is predicted using the regression model and a PRESS value is calculated. The excluded sample is reintroduced into the training set and another training set sample is excluded and its concentration and PRESS value is estimated and added to the previous PRESS value. The process is repeated until all of the training set samples have been estimated and a final PRESS value is calculated (Kramer, 1998c).
A PRESS value calculated in this way can also be used as a measure of the proper number of principal components of a data set to retain. As more principal components are retained, the PCR model will predict concentrations more accurately and PRESS values will decrease. However, there will come a point where increasing the number of principal components retained does not significantly improve the accuracy of the prediction and those principal components should be discarded (Jackson, 1991b; Kramer, 1998a; Jolliffe, 2004c).
35
The accuracy and applicability of a model are two distinct questions (vide supra) (Daszykowski and Walczak, 2006). Some users of PCR do not address applicability of their calibration model and thus assume that the calibration model is always applicable to an unknown data set. Stated another way, one assumes that the relevant principal components of a data set describe all relevant information in the unknown data set. Instrumental errors such as drift, experimental system errors such as pressure and temperature, and impurities or interferents can invalidate this assumption if they contribute significantly to the measured signal (Nomikos and Macgregor, 1995; Bro, 2003).
There are situations in which a scientist may not always know the complete composition of the unknown data set a priori and will not be able to predict if there are any unknown components that will significantly affect the measured response. As an example, in vivo electrochemists use fast-scan cyclic voltammetry to measure
electroactive species in the brain of freely moving rats. Training set cyclic
voltammograms often incorporate only dopamine and pH but measure in brain regions containing many electroactive species (Justice Jr., 1987). If dopamine and pH are the only significant current contributions to the overall measurement, concentration data should be accurate. However, if other electroactive species are present in
concentrations large enough to contribute a significant amount of current, the training set cyclic voltammograms would be insufficient to model all of the collected data and
concentration data obtained from PCR would be questionable.
36
identification, and outlier detection. An advantage with working with multivariate data is that it can sometimes be possible to visualize the data spectrum of an interferent, something that is impossible with a univariate measurement.
In PCR residuals are a measure of the unknown signal (e.g. current) that is not accounted for by the retained principal components of the training set. This includes noise and any signal arising from the response of any interfering analytes. Ideally, the training set contains all the relevant information of an unknown data set and the
residuals should contain only noise. We will continue to use in vivo electrochemical data as an example throughout this section, but the principles apply to all other fields of analytical chemistry.
The quantity Q is defined as the sum of the squares of the residual values at each variable in each sample of the data set. Using in vivo electrochemistry as an example, one Q value is calculated for each cyclic voltammogram in the unknown data set by summing the squares of the current at each potential scanned that was not accounted for by the retained principal components of the training set used as shown in Figure 2.3. Mathematically, the Q value of a cyclic voltammogram at time t, Qt, can be represented by
w
x
x x
t i i
Q
1
2 2 ˆ
(eq 2.1)
where ix is the current at x point number of the wth point cyclic voltammogram and
i
ˆ
xisthe current predicted from the PCR model containing only the relevant principal
37
Figure 2.3. Calculation of a Q value at a specific time point, t. The cyclic

![Figure 2.1. Representation of UV-VIS data in an intensity space. A) UV-VIS spectra of component X in concentrations [X] (solid line) to [2X], [3X], and [4X] (dashed lines)](https://thumb-us.123doks.com/thumbv2/123dok_us/8292836.2196079/46.918.147.769.115.451/figure-representation-intensity-space-spectra-component-concentrations-dashed.webp)