GENETIC ANALYSIS OF COMPLEX AND MENDELIAN DISEASES
Nicole Gabrielle Griffin
A dissertation submitted to the faculty of the University of North Carolina at Chapel Hill in partial fulfillment of the requirements for the degree of Doctor of Philosophy in the
Curriculum of Genetics and Molecular Biology.
Chapel Hill 2014
Approved by:
Yun Li
Karen Mohlke Kari North
ii ©2014
iii ABSTRACT
Nicole Gabrielle Griffin: Genetic Analysis of Complex and Mendelian Diseases (under the direction of Kirk Wilhelmsen)
This work describes approaches for discovering genetic variants that contribute to the
etiology of human diseases with complex and simple modes of inheritance through the use of
linkage analysis, genome-wide association analysis, and massively parallel sequencing (MPS).
The studies contained in this work illustrate both the capabilities and limitations of these
approaches.
The two GWA studies in this work illustrated how reducing genetic and population
heterogeneity could increase the ability to detect associations with genome-wide significance.
The first, a GWA study of idiopathic Parkinson’s disease (IPD), was able to detect an association
signal that approached genome-wide significance across chromosome 12q12, including the
LRRK2 locus (average p-value=4.85 x 10⁻⁶), which has been implicated in IPD by several linkage
studies. The second, a pilot GWA study of dystonia, identified an association with genome-wide
significance at RNF213. The second half of this work employed MPS approaches to investigate
the genetics of familial presentations of disease. The first, a study of a family with an atypical
presentation of frontotemporal dementia with amyotrophic lateral sclerosis, was unable to detect
an obvious deleterious mutation despite sequencing the exomes of 10 individuals and the whole
genome of 1 individual in this family. The exome sequencing data from this family were used to
perform a multipoint linkage analysis, which potentially implicated chromosome 9q in this
iv
gene in the gamma-secretase pathway. The final study featured a genome-wide linkage analysis
of a pedigree affected with a microcoria myopathy and a combined whole genome and whole
exome sequencing analysis of this pedigree and 7 unrelated individuals. The linkage analysis
found a multipoint LOD score of 1.8 on Chromosome 5q35. Exome sequencing detected a
missense mutation shared by the affected family members in C5orf60: c.97C>T (p.P33S) that
was also found in an exome from an unrelated subject. Another missense mutation in C5orf60,
c.64G>C (p.D22H), was present in the exomes from 5 of the unrelated subjects. These results
suggest that mutations in C5orf60 are a novel cause of microcoria and also corroborate the
v
TABLE OF CONTENTS
LIST OF TABLES ... vii
LIST OF FIGURES ... viii
LIST OF ABBREVIATIONS ... ix
Chapter 1: Introduction ...1
Linkage Analysis ...1
Genome-wide Association Studies ...8
Massively Parallel Sequencing Studies ...18
Chapter Overviews...22
References ...23
Chapter 2: A Genome-wide Association Study of Idiopathic Parkinson’s Disease ...25
Introduction ...25
Methods...29
Results ...32
Discussion ...35
References ...37
Chapter 3: A Pilot GWAS of Idiopathic Focal Dystonia identifies an Association Signal at RNF213 ...52
Introduction ...52
Methods...54
Results ...57
Discussion ...59
vi
Chapter 4: Combined Exome and Whole Genome Sequence Analysis of
FTD-ALS family San Francisco-A ...67
Introduction ...67
Methods...70
Results ...73
Discussion ...76
References ...80
Chapter 5: Whole Genome and Whole Exome Sequence Analysis of a Family Affected by a Microcoria Myopathy...87
Introduction ...87
Methods...89
Results ...92
Discussion ...96
References ...100
Chapter 6: Conclusions ...108
Study-Specific Conclusions and Future Directions ...108
Insights and Context ...113
Final Thoughts ...116
vii
LIST OF TABLES
Table 2.1 Significant SNPs (p<1.0x10⁻⁵) in the replication GWAS of IPD ...45
Table 4.1 Variants of Interest on Chromosome 9 in FTD-ALS family San Francisco-A ...86
Table 5.1 Mean Coverage of Massively Parallel Sequencing Data ...106
viii
LIST OF FIGURES
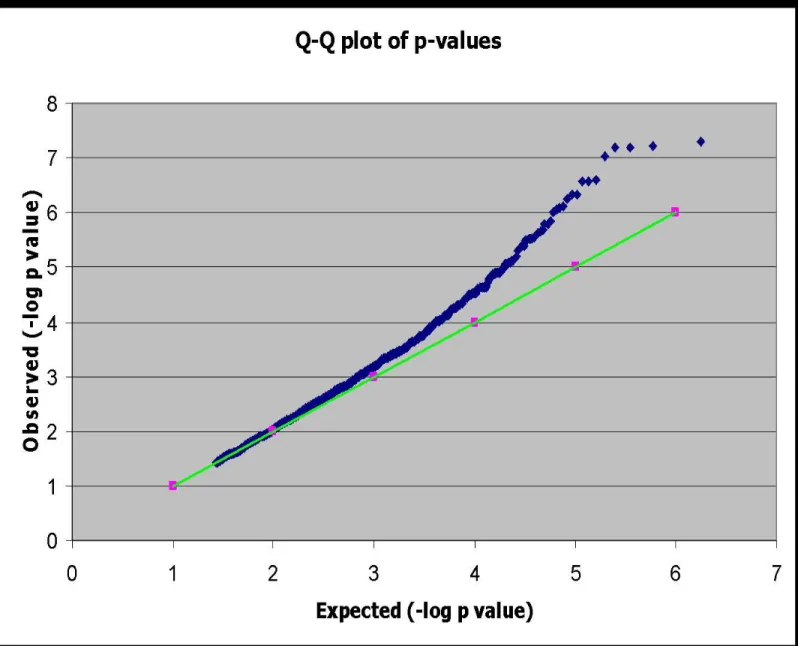
Figure 2.1 Quantile-quantile plot of the observed vs. the expected distribution
of p-values for the initial IPD GWAS...40
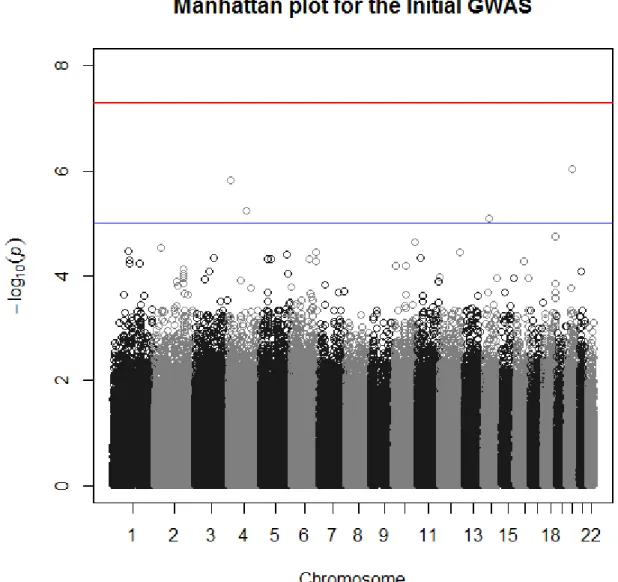
Figure 2.2 Manhattan plot of the –log10(p-values) of the initial IPD GWAS ...41
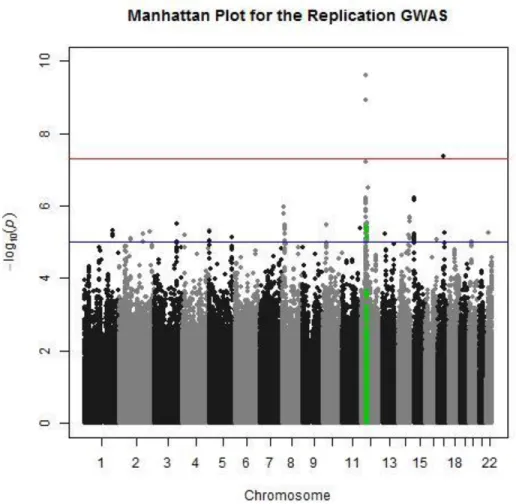
Figure 2.3 Manhattan plot of the –log10(p-values) of the replication IPD GWAS ...42
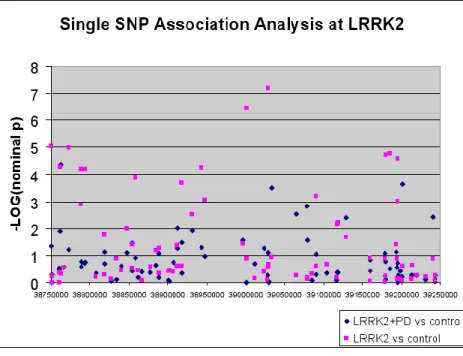
Figure 2.4 Association across the LRRK2 region ...43
Figure 3.1 Manhattan plot of the –log10(p-values) of the dystonia GWAS ...64
Figure 3.2 Quantile-quantile plot of the observed vs. the expected distribution of p-values for the dystonia GWAS ...65
Figure 3.3 Plot of the association signal across RNF213...66
Figure 4.1 Pedigree affected with FTD-ALS ... 83
Figure 4.2 Multipoint LOD scores across chromosome 9 for FTD-ALS family San Francisco-A ...84
Figure 4.3 Repeat-Primed PCR of the C9orf72 hexanucleotide repeat ...85
Figure 5.1 Pedigree of a family presenting with microcoria and progressive muscle weakness in a limb-girdle distribution...102
Figure 5.2 Multipoint LOD scores between microcoria myopathy and 515 markers on chromosome 5 ...103
ix
LIST OF ABBREVIATIONS
ALS amyotrophic lateral sclerosis
APM affected pedigree member
ARMD age-related macular degeneration
BAM binary sequence alignment/map
BWA Burrows-Wheeler aligner
CGH comparative genomic hybridization
CK creatine kinase
cM centiMorgan
CNV copy number variant
ESE exonic splicing enhancer
ESP Exome Sequencing Project
ESS exonic splicing silencer
EST expressed sequence tag
EVS Exome Variant Server
FTD frontotemporal dementia
FTD-ALS frontotemporal dementia with amyotrophic lateral sclerosis
x gDNA genomic DNA
GWA genome-wide association
GWAS genome-wide association study
IBD identical by descent
IBS identical by state
IPD idiopathic Parkinson’s disease
LD linkage disequilibrium
LGMD limb-girdle muscular dystrophy
LOAD late-onset Alzheimer’s disease
LOD logarithm of odds
MAF minor allele frequency
MPS massively parallel sequencing
NGS next-generation sequencing
NPL non-parametric linkage
PA-seq poly-adenylation sequencing
PCR polymerase chain reaction
Q-Q quantile-quantile
xi RFLP restriction fragment length polymorphism
SAM sequence alignment/map
SF-A San Francisco-A
SNP single nucleotide polymorphism
VCF variant call file
VNTR variable number of tandem repeats
WES whole exome sequencing
1 Chapter 1
Introduction
An important goal of human genetics is the identification of sequence variants that
produce traits of medical importance. Genetic variants that cause traits of interest occur with a
wide range of frequencies and include changes as small as a single nucleotide to as large as a
chromosomal duplication. To map variants to chromosome locations within the three billion base
pairs that make up the human genome, researchers first used cytology to examine metaphase
chromosomes for gross rearrangements. In most conditions, there are no visible rearrangements,
such that cytology has been superseded by molecular biology and genetic techniques. Currently,
the methods of choice for searching the genome include chromosome segregation analysis,
which tests whether specific chromosome regions harbor sequence variants that transmit disease
in families, or association analysis, which tests whether having specific variants is correlated
with having a trait. With the development of technology for massively parallel molecular
techniques and automation, it has become routine to systematically interrogate the entire genome
by linkage and association analysis.
1.1 Linkage Analysis
Two loci are said to be linked if the hypothesis that they segregate independently is
2
close that meiotic recombination between them does not occur frequently enough to make appear
to segregate independently. The premise for linkage analysis of traits is that affected individuals
in a pedigree are expected to have an increased probability of inheriting the same chromosome
segments from common ancestors for the regions that have variants that lead to disease. For rare
traits with simple modes of inheritance, there is a high probability that all the affected individuals
in a family will inherit the causal sequence variants from the same common ancestors. The
affected individuals in such a family are assumed to be identical by descent (IBD) for the causal
variant. Because chromosomes are inherited from generation to generation with occasional
meiotic recombinations, disease-causing variants will co-segregate with other markers on the
same chromosome segment. Given enough affected individuals and pedigrees, linkage analysis
can identify the region of the genome segregating with the disease variant. A typical
chromosome region identified by linkage analysis will contain thousands of rare sequence
variants that are effectively unique to the chromosome segment shared by the affected family
members. Prior to the development of massively parallel sequencing strategies, linkage was
followed by focused sequencing of coding sequences in the linked segment to look for mutations
predicted to change the function of a gene product. The coding sequence of genes was the focus
of investigations because it is often difficult to predict the effect of non-coding sequence changes
and there was the prejudice that most trait producing sequence variants would affect the amino
acids sequence of gene protein products.
Initially, the criteria for deciding that sequence changes in a gene were responsible for a
rare trait were: 1) that the putative causal variants are not found in a large sampling of unaffected
individuals; 2) that the putative causal variants segregate with the trait in pedigrees; and 3) that
3
Candidate gene resequencing has now been replaced by massively parallel sequencing such that
the absence of other likely causal mutations in a linkage interval can be used to increase the
likelihood that the gene responsible for a trait has been identified.
To perform a linkage analysis, the minimum amount of information needed is a
sufficiently large pedigree or collection of pedigrees with phenotype data and a set of genotyped
markers. The type of analysis is determined by the characteristics of the disease inheritance and
pedigree structure. For simple, Mendelian diseases where the mode of inheritance is
well-understood, parametric linkage analysis is usually pursued; in this type of analysis, the
parameters describe the frequency of and mode of inheritance of disease. For diseases with
complex modes of inheritance, so-called non-parametric linkage analysis is often used. The less
parameterized or fitted parameter methods typically require large collections of families with at
least an affected relative pair. For the microcoria myopathy study and frontotemporal dementia
with amyotrophic lateral sclerosis (FTD-ALS) study described in this dissertation, parametric
linkage analysis was used because the mode of inheritance could be inferred from the respective
pedigrees.
1.1.1 Design Considerations in Genetic Linkage Studies
To test for co-segregation of a chromosome segment and a trait, it is necessary to be able
to identify chromosomes that are identical by descent. In 1980, Botstein et al. (1) proposed that
sequence variations specific to chromosome position, usually called markers, could be used to
construct genetic maps and determine whether chromosome segments are identical by descent.
Any sequence variation can potentially be used as a marker and a series of markers across a
4
concept of using DNA sequence variations as markers emerged, numerous assay methods have
been developed. Botstein et al. (1) first defined the use of restriction fragment length
polymorphisms (RFLP). RFLP-based approaches used restriction enzymes from bacteria to cut
DNA into fragments through the recognition of a specific sequence. Sequence variations that
create or destroy the recognition sequence for a restriction enzyme can be assayed by monitoring
the cleavage pattern of DNA. Most RFLP polymorphisms are dimorphic and thus often cannot
distinguish between chromosomes with the same allele. Collections of markers on a chromosome
segment can overcome the limited ability of a single marker to distinguish between
chromosomes. When the cost of genotyping a marker was high, markers with many alleles were
preferentially used. The most commonly used highly polymorphic markers detected sequences
with variable number tandem repeats (VNTRs). In most cases, VNTRs were assayed by
measuring the size of a fragment between restriction enzyme cleavage sites or polymerase chain
reaction primer binding sites. The development of array-based approaches allowed for the
simultaneous genotyping of large collections of single nucleotide polymorphisms (SNPs) in a
single assay. Currently, SNP-based approaches allow for the genotyping millions of markers in a
single assay. The human population is estimated to have ten million SNPs where the less
frequent allele has a frequency greater than 5% in a commonly studied population.
Prior to collecting genotype data for linkage analysis, it is prudent to estimate the power to detect
linkage. Frequently for pedigrees with simple modes of inheritance where sufficient genotype
data will be obtained to confidently determine whether family members are identical by descent,
power can be estimated by counting the number of informative meioses in the pedigree. For
families with complex modes of inheritance, it is usually necessary to simulate genotype data
5
randomly assigned to the individuals for whom no ancestral data is available- the founders.
Random segregation of the founders’ chromosomes is used to “drop,” or assign, the genotypes of
the remaining members of the pedigree. The genotypes of the individuals that will not be
genotyped are then removed. When pedigrees have already been ascertained the observed
phenotypes and pedigree structures are used. Otherwise phenotypes are simulated using the
parameters deduced from the observed mode of inheritance of the trait. The key parameters that
need to be estimated are the number of trait loci, their allele frequencies, mode of inheritance and
the effect size. For traits with simple modes of inheritance it is often assumed that there is a
single trait locus with estimated allele frequencies and genotype penetrances. The genotype
penetrance is the estimated fraction of the time that an individual with a trait genotype will
express the trait. Linkage analysis is performed for the simulated data. The process is repeated
over and over to estimate the null distribution for a linkage signal. The distribution can be
compared to the distribution obtained where genotypes are simulated assuming linkage.
Following this assessment of power, linkage between markers and a trait can be evaluated by
several different tests. The Elston-Stewart and Lander-Green algorithms are the two standard
methods for calculating the genotype likelihoods in pedigrees. Briefly, the Elston-Stewart
algorithm evaluates the likelihood of the pedigree data using the probability of the founder
genotypes, the probability of the phenotype given the genotype (i.e., the penetrance), and the
probability of a child’s genotype given the parental genotypes (i.e., the transmission probability)
(3). Because the offsprings’ genotypes can be collapsed or “peeled” onto the parent, this
algorithm is better suited to handling large pedigrees; i.e., the complexity increases linearly as
with the size of the pedigree and exponentially with the number of loci. In contrast, the
6
founders and linearly with the number of loci. The Lander-Green algorithm incorporates a
Hidden Markov Model (HMM) to determine the likelihood of the pedigree data given the
inheritance vectors for each marker, the genotype probabilities for each marker, and the
transition probabilities from one marker to the next (4).
Tests for Genetic Linkage
Parametric linkage analysis
Parametric linkage analysis tests for segregation between a trait locus and a set of
markers with known positions through the use of a specific trait model. Parametric models
typically include the trait allele frequencies and genotype penetrances. Parametric linkage
analysis can allow for age and gender specific penetrances that are either continuous or
discontinuous functions. For traits with simple modes of inheritance, often called Mendelian
diseases, the penetrance of disease associated genotypes are high and the penetrance of
non-disease associated genotypes are very low. By making simple assumptions, causal allele
frequencies can be estimated based on the frequency of the trait in the population. Rare traits are
predicted to be caused by rare alleles. Penetrances are inferred from the fraction of at risk
individual in a pedigree that manifest the trait given the inferred mode of inheritance and
genotype frequencies.
Often by annotating the status (i.e., affected, carrier, unaffected, or unknown) of each
individual in a pedigree, the particular mode of inheritance of a disease locus often becomes
clear. For example, in an autosomal dominant mode of inheritance with complete penetrance, all
individuals in a pedigree harboring one copy of the trait allele will express the trait; there will be
7
also be affected. Other modes of inheritance include autosomal recessive, X-linked, Y-linked,
and mitochondrial. The observed mode of inheritance is used to develop the model used in
parametric linkage analysis.
Once the trait model is developed, the probability that a known genotyped marker is
segregating with disease can be calculated. The logarithm-of-odds (LOD) score compares the
probability that the pattern of genotypes would be seen if the marker locus and trait locus were
linked to the probability that the pattern of genotypes would be seen if the marker locus and trait
locus were not linked.
Non-parametric linkage analysis
Non-parametric linkage (NPL) analyses were developed to map loci of traits with
complex inheritance. NPL studies analyze the amount of IBD sharing among affected individuals
in pedigrees. The simplest form of NPL analysis is the affected sib-pair test, which requires
genotype information from nuclear families with two affected siblings. The Haseman-Elston
regression performs this sib-pair test by regressing the square of number of alleles shared IBD at
a given locus against the square of difference in the quantitative phenotypes of the sib-pair (5).
Variance components analysis, another form of NPL analysis, allows for the inclusion of
components that might influence a trait, such as age or gender, to isolate the additive and
dominance genetic effects for relatives with any type of familial relationship (6).
1.1.2 Limitations of Genetic Linkage Studies
For linkage analysis to be successful there must be sufficiently dense coverage of the
8
parametric linkage analysis the disease variant must have sufficient penetrance to deduce the
mode of inheritance for parametric linkage analysis, and there must be a sufficient number of
informative meioses to uniquely specify the region of the genome that is segregating with the
variant.
Because the number of crossovers that typically occur on a single chromosome is small,
the first major limitation of linkage analysis is that a linkage study typically does not provide the
resolution necessary to determine the causal variant for a disease. By chance, it is possible for the
critical recombination events to occur within close proximity, but most studies with the
minimum power to detect linkage can narrow the genome to regions that are ten to twenty cM in
size. Candidate gene resequencing was first used to search for causal variants after linkage was
detected, but the advent of massively parallel sequencing technologies also allows for the
identification of such variants.
The other primary limitation of linkage analysis is that this type of analysis can only
resolve the genetics of certain diseases. Diseases with complex inheritance are less easily
resolved. While linkage analyses succeeded in mapping the genes for thousands of diseases, new
approaches were needed to map the genes for the majority of human traits, which have complex
modes of inheritance.
1.2. Genome-wide Association Studies
With the ability to genotype hundreds of thousands of markers at once came a new kind
of genetic analysis: genome-wide association (GWA) analysis. GWA studies focus on common
genomic variation which entail the genotyping of many markers with minor allele frequencies
9
responsible for common diseases. While linkage studies seek regions of the genome that are IBD
in affected individuals, GWA studies seek to find alleles that are IBS. A significant association
signal indicates that an allele occurs more frequently in individuals with the disease (i.e., the
cases) than in individuals in the general population (i.e., the controls). Because markers located
within proximity of each other on the same chromosome segment are more likely to be inherited
together, certain combinations of alleles occur more frequently than would be expected simply
by their frequencies in the population. This phenomenon is known as linkage disequilibrium
(LD). In turn, because of this LD, association testing can identify direct associations at a given
SNP and indirect associations with SNPs that were not genotyped but that are in LD with the
genotyped SNP. The genotyped SNP is said to “tag” the SNPs with which it is in LD.
Furthermore, the effect sizes of the variants implicated by GWA and linkage studies differ
substantially. Most of the SNPs implicated in human disease by GWA analysis have small effect
sizes. GWA analysis can pinpoint thousands of markers with small effect sizes as contributing to
a phenotype, which can give a more complete view of that phenotype’s underlying biology.
GWA studies have paved the way for the genetic analysis of common, complex diseases.
The first published GWA study investigated age-related macular degeneration (ARMD)
(7). ARMD is one of the most common causes of blindness or vision impairment in the elderly.
While linkage had previously implicated a locus on chromosome 1q32, these researchers used
data for 116,204 SNPs from 96 cases and 50 controls to find a significant association signal in
this region for two SNPs in the gene for complement factor H (CFH). Another early success in
the field of GWA studies was the association of the E4 allele of apolipoprotein-E (APOE) with the risk for late onset Alzheimer’s disease (LOAD). Prior to the advent of GWA studies, the
10
study implicated the E4 allele (8-9). Following these discoveries, Grupe et al. (10) published a
GWA study of 1,808 LOAD cases and 2,062 controls, who were genotyped for 17,343 SNPs,
and found significant association signals for SNPs near APOE. This association has been
confirmed by the majority of subsequent GWA studies of LOAD (11).
Since these initial studies, shifts in the scale and scope of GWA studies have occurred.
One of the first large-scale GWA studies was pursued by the Wellcome Trust Case Control
Consortium (12) and involved 14,000 cases for 7 diseases and 3,000 shared controls. GWA
studies can now entail tens or hundreds of thousands of individuals and approximately one
million SNP markers. The largest GWA studies have focused on traits such as height and type 2
diabetes. There are several considerations in designing a study of this scope.
1.2.1. Design Considerations in Genome-wide Association Studies
Power
The first step in performing a GWA study involves the selection of the phenotype of
interest and the collection of DNA samples from a population. The design of a GWA study will
affect the power to detect associations. Increases in power lead to decreases in type II error.
Power depends on the number of samples, the frequency of the trait in the population, the ratio of
cases to controls, the effect size of the association, and the disequilibrium between typed
polymorphisms and the causal polymorphism. Power is becoming less of an issue as consortia
are formed to tackle the genetics of some of the most common diseases; these study populations
11 Population stratification
The subjects in a GWA study are often assumed to be unrelated. Failure to correct for
kinship can inflate measures of association. It is possible to directly measure the relationship
(kinship co-efficient) between study participants with a large collection of typed markers and
correct measures of association for their relationship (13). However, it is also important that the
subjects be derived from the same population. A more pernicious source of false association
occurs when there is population substructure such that there is a correlation between phenotype
and subpopulation membership. In the event that a study population is actually comprised of two
or more sub-populations with significantly different minor allele frequencies and differences in
disease frequency, a false positive association signal may arise.
The most commonly used method for detecting stratification is genomic control (14). The
genomic control statistic, , indicates the presence of the potential inflation of the association
signals by dividing the average of the (Chi-squared) test statistics for approximately 50 SNPs by
the median of this distribution. Several methods have been developed for identifying the
sub-populations within a study when stratification is present. These include structure-association
based approaches, such as STRUCTURE (15), and principal component analysis-based methods,
such as Eigensoft (16, 17).
Adjusting for multiple testing
While increasing the power of a study can lessen the likelihood of type II error, the
potential for type I error is an equally pressing concern in GWA study design. Type II error (also
12
(also called a false positive) results when the null hypothesis is incorrectly rejected. Each
genotyped marker that is in equilibrium with other typed markers represents the testing of a
different hypothesis. One statistical test used commonly in GWA studies is the Chi-squared test,
which compares the allele counts or genotype frequencies in the cases and controls. For the
purposes of the two GWA studies described in this dissertation, the Fisher’s exact test was used
to compare the distribution of the genotypes for each SNP between the cases and controls
because this test accounts better than the Chi-squared test for low allele/genotype counts. Thus,
the p-values obtained from GWA studies have to be adjusted to account for hundreds of
thousands of hypotheses. The most conservative of these adjustments is the Bonferroni
Correction, which tests each hypothesis at a significance level of /n, where is the probability
of incorrectly rejecting the null hypothesis and n is the number of hypotheses, such that the type I error rate for the group of hypotheses as a whole is equal to . The generally accepted p-value
cutoff for genome-wide significance is 5 x 10⁻⁸ (18). The Bonferroni correction is overly
conservative when markers are not independent of each other. To illustrate the point, imagine
that a large gene has hundreds of polymorphisms, but only two haplotypes. By testing whether a
single SNP in the gene is associated effectively tests whether any of the SNPs in the gene is
associated with the trait. To correct the threshold value for significance by the number of
equivalent tests is obviously overly conservative.
Even when adjusting for multiple comparisons, false positive results can still occur. The
false discovery rate (FDR) describes the expected proportion of false positive results; Benjamini
and Hochberg first described a method for controlling the FDR (19). One method for evaluating
13
A Q-Q plot compares the expected distribution of p-values under the null hypothesis with the
observed distribution of p-values.
Imputation
It is estimated that there are ten million common (MAF > 0.01) SNPs in the human
genome. Due to LD, it is possible to infer the genotypes of most common SNPs if the genotypes
of approximately one million SNPs are known. Computational methods for imputing genotypes
rely on haplotype phasing.
Individuals within populations can be shown to be related by increased allele sharing that
reflects population histories. Homogeneous populations tend to have unique LD structures,
facilitating imputation, and the number of possible haplotypes for a gene is generally much lower
than the number of possible haplotypes present in the population.
When phasing haplotypes in a group of unrelated individuals, the inclusion of genotype
information from more individuals results in a better estimation of the haplotypes (20). The
majority of computational phasing approaches take into account the fact that most haplotypes in
a population are similar to each other because of constraints on recombination and mutation over
short distances; this observation forms the basis of approximate coalescent models and allows for
hidden Markov model-based approaches to haplotype phasing. Once a set of haplotypes has been
generated, these can be used to impute the genotypes for additional SNPs using the known
genotypes and the knowledge of LD. PHASE (21), BEAGLE (22), MaCH (23), and IMPUTE2
(24) are commonly used phasing methods; the latter three can also be used for genotype
14
Thus, through the use of genome-wide SNP arrays, more densely typed reference
populations and imputation, it is possible to capture a substantial amount of genetic variation
through a GWA approach.
1.2.2. Limitations of Genome-wide Association Studies
GWA studies have identified thousands of genetic markers that are associated with
human disease. However, these studies do not seem to explain the majority of the heritability of a
phenotype. For example, in 2010, Lango et al. published a GWA study of height with 183,727
subjects of European descent and found significant associations for 180 loci (25). Because of its
very large sample size, this study should have had sufficient power to detect associations.
However, in the aggregate, these 180 loci explained only 10% of the variation in height. Because
height is predicted to be 80-90% heritable, the findings of the study suggest that GWA studies
are insensitive to much of the genetic variation that can explain a phenotype. This problem is
known as the “case of the missing heritability.”
Several explanations have been offered for this missing heritability. These explanations
exemplify the limitations of GWA studies and are discussed below.
Genetic and clinical heterogeneity
Complex human diseases can be characterized by both genetic and clinical heterogeneity.
Genetic heterogeneity can contribute to the problem of missing heritability because a given
variant may only contribute to a phenotype in a portion of the cases. If this is the case, the
association signal in the region containing this variant may not achieve genome-wide
15
heterogeneity. The former occurs when variants in different genes result in the same phenotype.
Locus heterogeneity is easier to define for loci with high genotypic relative risks, such as those
that cause disease with simple modes of inheritance (e.g., Charcot-Marie-Tooth and
spinocerebellar degeneration). There are many examples of apparently similar conditions that are
due to mutations in different genes. Similarly often more than one mutation in a gene, i.e., allelic
heterogeneity, can result in the same condition. For alleles and loci with smaller genotypic
relative risks, the effects of genetic heterogeneity have a more nuanced effect on measured
heritability.
The occurrence of either locus or allelic heterogeneity can obscure an association signal
in a GWA study by diluting the allele frequencies of SNPs. Genetic heterogeneity can be reduced
by selecting a study group from a homogeneous population.
In addition to genetic heterogeneity, clinical heterogeneity is problematic because while
subjects might be classified as having the same disease, this classification may encompass a
variety of distinct syndromes with similar symptoms. Thus, diseases that may be regarded as
“common” may not be that common after all. Researchers have proposed focusing on
intermediate phenotypes instead, such as using blood glucose levels as a proxy for diabetes, to
lessen the possibility for phenotypic heterogeneity.
The limitations of SNPs
While SNPs are the most common type of polymorphism, many of the SNPs implicated
by GWA studies do not cause a change in protein-coding sequence. Many SNPs associated with
disease have been found outside of protein-coding sequences in introns or in intergenic regions,
16
thousands of base pairs away. Furthermore, there are many types of variants beyond SNPs that
are not tagged well in GWA studies.
For example, researchers have also investigated the role of copy number variants (CNVs)
in common disease. CNVs can constitute small or large insertions or deletions, as well as
duplications, of DNA. While CNVs can be shared by individuals in a population, they can also
occur as de novo mutations. Through the application of comparative genomic hybridization
(CGH), researchers have identified de novo CNVs as playing a major role in autism spectrum
disorders (26).
Thus, the “missing heritability” may be explained in part by the inadequacy of SNPs in
representing genetic variation throughout the genome.
Gene-gene interactions
In the case of complex diseases for which many genes have been implicated, the missing
heritability may also arise from gene-gene interactions. That is, the etiology of a disease may be
explained by a combination of alleles in different genes. However, it is computationally
expensive and statistically burdensome to model all of the potential gene-gene interactions that
could contribute to a phenotype. Moreover, these interactions are not captured by conventional
GWA methods.
Gene-environment interactions
Gene-environment interactions may also contribute to the problem of the missing
heterability. A gene-environment interaction arises when the contribution of a variant to a
17
genotype and environmental exposure is greater (or less) than the sum of these factors’
individual effects. One possible consequence of a gene-environment interaction is that a variant
only contributes to the risk for a phenotype in the portion of the population that has been
introduced to a certain exposure; this interaction could potentially obscure an association signal.
For example, researchers have investigated the extent to which physical activity may interact
with common variants in FTO contribute to type II diabetes (27, 28). As is the case for
gene-gene interactions, it would be computationally difficult and statistically burdensome to model
these interactions in the context of a GWA study.
Transgenerational epigenetic effects
While SNP arrays can capture variation at the level of DNA sequence, the regulation of
gene expression depends on more than just the primary sequence of nucleotides. Within nuclei,
DNA is packaged as chromatin, which is wrapped around proteins known as histones to form
nucleosomes. Histone modifications, such as methylation and acetylation, can either activate or
suppress the transcription of genes into mRNA. These modifications, which collectively form the
epigenome, are overlooked by GWA analysis because they do not alter the primary DNA
sequence and may explain part of the missing heritability if they are passed from one generation
to the next and contribute to the variation in a phenotype.
1.2.3 Summary
GWA studies, in concert with the International HapMap project, have thoroughly
explored the common disease-common variant hypothesis and have described a vast amount of
the common variation in the human genome. The approach has also explained a substantial
18
common variants caused a shift from linkage analysis to GWA analysis, the ability to rapidly
sequence the entire genome is causing a shift from GWA studies to sequencing studies to explain
the genetics of disease.
1.3. Massively Parallel Sequencing Studies
On April 14, 2003, the Human Genome Project announced its completion. It had taken $3
billion and 13 years to sequence the 3 billion base pairs in a single haploid genome. Ten years
later, the diploid genome could be sequenced for approximately $5000 in a matter of days. In the
near future, researchers hope to sequence an individual genome for less than $1000.
This advancement was made possible the by the development of next-generation, massively
parallel sequencing (MPS) technologies. (Sanger sequencing is regarded as the first generation of
sequencing technology). As MPS technologies have become more affordable, researchers have
increasingly made use of sequencing to identify variants in their subjects. MPS studies represent
a significant shift in the scope of genetic analysis; these technologies allow the extension of
linkage and association analysis to the scope of the full genome. However, because MPS
approaches can identify nearly all the variants in an individual genome, it becomes more difficult
to determine which variants are “important.” The pursuit of “private” variants that contribute to a
disease with MPS studies signals a departure from the common variant-common disease model
and a transition into the era of personalized medicine. To successfully identify the mutations that
explain a particular phenotype, the scope of the study, sequencing platform, approach to variant
19
1.3.1. Design Considerations in Massively Parallel Sequencing Studies
Sequencing Target
While it is possible to sequence the whole genome, many researchers employ an
approach that exclusively targets, enriches, and sequences the exome, i.e., the protein coding
sequences of the genome. As described above, the focus on coding sequences can be partly
explained by the difficulty that comes with trying to explain the effect of variants in non-coding
sequences. While the exome comprises only 1 to 2% of the genome, it is predicted to contain
85% of the variants that explain single-gene, Mendelian diseases. Substantial efforts have been
made to develop efficient strategies for targeting these regions. Furthermore, sequencing only the
exome can ensure better coverage of the sequenced regions and reduces the computational
resources needed to call and analyze the variants. This approach was first successfully used by
Ng et al. (29) to determine the causal variant for Miller syndrome using data from 4 individuals
from 3 separate families, and exome sequencing has since been used to identify causal variants
for many Mendelian diseases.
Sequencing the exome, alone, however, may not be sufficient to find the variants that
contribute to a phenotype. Even in the case of Mendelian diseases, it is possible that the causal
variant resides outside of the exome or is not adequately targeted by current exome enrichment
strategies. Furthermore, the analysis of sequenced variants may exclude variants that do not
cause a change in the predicted amino acid sequence. Thus, researchers should use the
characteristics of their disease of interest to determine whether whole genome sequencing or
20
and for which the causal variant is suspected to have a high penetrance, exome sequencing can
be more effective and less costly than whole genome sequencing.
Sequencing Platform
Several technologies have been developed in the field of next-generation sequencing.
MPS is high-throughput and massively parallel, meaning that thousands of bases can be
sequenced simultaneously. The sequencing studies of microcoria myopathy and FTD-ALS
described in this dissertation made use of the Illumina (Solexa) sequencing platform. The
underlying principle of this technology is sequence-by-synthesis. The Illumina platform makes
use of flow cells; the surfaces of these flow cells are covered with a lawn of special primers to
which genomic DNA fragments are ligated. The fragments are sequenced using a process called
cyclic reversible termination. Briefly, the attached DNA fragments are amplified with
fluorescent dye-labeled nucleotides to form clusters of DNA fragments, which are imaged,
allowing the calling of nucleotides. Other sequencing platforms include those developed by
Roche (454), Helicose Bioscences, Pacific BioSciences, and Life Technologies (SOLiD and Ion
Torrent).
Sequencing alignment and variant calling
Once the sequence reads have been produced, the next step involves aligning the reads to
a reference genome. Many software tools have been developed to perform this task. Most of
these methods rely on indexing the reads, the reference genome, or both. The earliest aligning
tools used hashing to create these indexes. However, this form of indexing is memory-intensive,
21
resources. Several of these algorithms make use of the Burrows-Wheeler transformation to
compress the sequence information and perform the alignment.
A second crucial computational task involves the calling of genotypes once the sequence
reads have been aligned. This process takes into account, at the bare minimum, the number of
reads for a given nucleotide and the quality of these reads at each position in the genome.
Probabilistic methods for variant calling take into account other information, such as LD
structure and allele frequencies, to make genotype calls (30).
Variant interpretation
Once the variants in an individual have been called, the next task is to determine which of
these contribute to the phenotype of interest. Software tools, such as Polyphen, can predict
whether a variant has the potential to cause a change in protein sequence or structure. However,
variants might be excluded from analysis if it is unclear how they affect the product of a gene.
1.3.2. Limitations of Massively Parallel Sequencing Studies
Read length
The majority of sequencing platforms produce reads that are in the range of 100
nucleotides in length. The short length of these reads can result in mis-alignment or unplaced
reads, leading to a loss of data. Read length will become less of an issue as the technology is able
to synthesize longer reads.
22 Resolving copy number variants and repetitive regions
Because MPS relies on reference genomes, this method is not as adept at resolving
mutations that more than a few nucleotides in length. In the case of cancer, for example, large
chromosomal rearrangements are not uncommon, and these rearrangements are difficult to
capture with standard genome alignment tools. Despite these challenges, MPS technologies will
continue to advance the field of genetics and enable the development of personalized medicine.
1.4 Chapter Overviews
The studies contained within this manuscript highlight the use of the approaches
described above. Chapters 2 and 3 describe two GWA studies that were performed in the
Ashkenazi population. Chapter 2, a study of idiopathic Parkinson’s disease, illustrates how
genetic heterogeneity can obscure association signals. Chapter 3 presents a pilot GWA study of
dystonia, a movement disorder. Chapters 4 and 5 focus on the use of MPS technologies. Chapter
4 describes the use of exome sequencing to analyze a familial presentation of frontotemporal
dementia with amyotrophic lateral sclerosis (FTD-ALS). Chapter 5 describes a genome-wide
linkage analysis of a pedigree affected with microcoria myopathy and a combined whole genome
and whole exome sequencing analysis of this pedigree and 7 unrelated individuals. Finally,
Chapter 6 provides conclusions and future directions for the studies as well as insights for the
23
1.5 REFERENCES
1. Botstein D, White RL, Skolnick M, Davis RW. Construction of a genetic linkage map in man using restriction fragment length polymorphisms. Am J Hum Genet. 1980; 32: 314–331. 2. MacCluer JW, Vandeburg JL, Read B and Ryder OA. Pedigree analysis by computer
simulation. Zoo Biol. 1986; 5:149-160.
3. Elston RC, Stewart J. A general model for the genetic analysis of pedigree data. Hum Hered. 1971; 21: 523–542.
4. Lander ES, Green P. Construction of multilocus genetic linkage maps in humans. Proc Nat Acad Sci. 1987; 84(8): 2363–2367.
5. Haseman JK, Elston RC. The investigation of linkage between a quantitative trait and a marker locus. Behav Genet. 1972; 2:3–19.
6. Lange K, Westlake J, Spence MA. Extensions to pedigree analysis. III. Variance components by the scoring method. Ann Hum Genet. 1976; 39:485–491.
7. Klein RJ, Zeiss C, Chew EY, et al. Complement factor H polymorphism in age-related macular degeneration. Science. 2005; 308(5720): 385-389.
8. Pericak-Vance MA, Bebout JL, Gaskell PC Jr, et al. Linkage studies in familial Alzheimer disease: Evidence for chromosome 19 linkage. Am J Hum Genet 1991; 48(6): 1034–50. 9. Corder EH, Saunders AM, Strittmatter WJ, et al. Gene dose of apolipoprotein E type 4 allele
and the risk of Alzheimer's disease in late onset families. Science. 1993; 261(5123): 921–3. 10.Grupe A, Abraham R, Li Y, et al. Evidence for novel susceptibility genes for late-onset
Alzheimer's disease from a genome-wide association study of putative functional variants. Hum Mol Genet. 2007;16.8:865-873.
11.Bertram L, Tanzi RE. Genome-wide association studies in Alzheimer's disease. Hum Mol Genet. 2009;18.R2: R137-R145.
12.Kang HM, Sul JH, Service SK, et al. Variance component model to account for sample structure in genome-wide association studies. Nat. Genet. 2010; 42:348-54.
13.Burton PR, Clayton DG, Cardon LR, et al. Genome-wide association study of 14,000 cases of seven common diseases and 3,000 shared controls. Nature. 2007; 447(7145): 661-678. 14.Devlin B, Roeder K. Genomic control for association studies, Biometrics. 1999; 55(4):997–
1004.
15.Pritchard J K, Stephens M, Donnelly P. Inference of population structure using multilocus genotype data. Genetics. 2000;155(2):945-959.
24
17.Price, Alkes L., et al. Principal components analysis corrects for stratification in genome-wide association studies. Nat Genet. 2006; 38(8): 904-909.
18.Bush WS, Moore JH. Chapter 11: Genome-wide association studies. PLoS Comput Biol. 2012;8(12):e1002822.
19.Benjamini Y, Hochberg Y. Controlling the false discovery rate: A practical and powerful approach to multiple testing. J R Stat Soc B. 1995; 57: 289–300.
20.Browning SR, Browning BL. Haplotype phasing: existing methods and new developments. Nature Reviews Genetics. 2011;12(10): 703-714.
21.Scheet P, Stephens M. A fast and flexible statistical model for large-scale population
genotype data: applications to inferring missing genotypes and haplotypic phase. Am J Hum Genet. 2006; 78(4): 629-644.
22.Browning SR, Browning BL. Rapid and accurate haplotype phasing and missing-data inference for whole-genome association studies by use of localized haplotype
clustering. American journal of human genetics, 2007; 81(5), 1084.
23.Li Y, Willer CJ, Ding J, Scheet P and Abecasis GR. MaCH: using sequence and genotype data to estimate haplotypes and unobserved genotypes. Genet Epidemiol. 2010; 34:816-834. 24.Howie BN, Donnelly P, Marchini J. A flexible and accurate genotype imputation method for
the next generation of genome-wide association studies. PLoS Genet. 2009;5(6): e1000529.
25.Allen HL, Estrada K, Lettre G, et al. Hundreds of variants clustered in genomic loci and biological pathways affect human height. Nature. 2010: 467(7317):832-838.
26.Sebat J, Lakshmi B, Malhotra D, et al. Strong association of de novo copy number mutations with autism. Science. 2007; 316(5823):445-449.
27.Andreasen CH, Stender-Petersen KL, Mogensen MS, et al. Low physical activity accentuates the effect of the FTO rs9939609 polymorphism on body fat
accumulation. Diabetes. 2008;57:95–101.
28.Rampersaud E, Mitchell BD, Pollin TI, et al. Physical activity and the association of common FTO gene variants with body mass index and obesity.Arch Intern
Med 2008;168:1791–1797.
29. Ng SB, Buckingham KJ, Lee C, et al. Exome sequencing identifies the cause of a mendelian disorder. Nat Genet. 2009;42(1): 30-35.
25 Chapter 2
A Genome-wide Association Study of Idiopathic Parkinson’s Disease
2.1 Introduction
As the one of the most common neurodegenerative diseases, idiopathic Parkinson's
Disease (IPD) is a debilitating disease presenting with chronic, progressive difficulty with motor
function. While the symptoms of the disease can be managed, its progression cannot. IPD is
estimated to affect 1% to 2% of the population over 65 and can occur in families or sporadically.
Despite the identification of some environmental factors and numerous genetic studies, the
etiology of this disorder is largely unexplained in greater than 95% of cases. The study of the
disease is further complicated by genetic and phenotypic heterogeneity; this phenotypic
heterogeneity is evidenced by the presence of both early-onset and late-onset forms of the
disease. The disease can also be monogenic or polygenic. Thus, substantial effort is needed to
determine the genetic causes of this disease.
Family-based linkage studies, which have the ability to identify rare variants with high
penetrance, constituted some of the first attempts to identify genes that cause IPD.
Polymeropoulos et al. (1, 2) mapped the first IPD susceptibility locus to chromosome 4q21-23 in
an Italian kinship, which they later deduced to be a mutation in the gene for alpha-synuclein
(SNCA). Since this study, the following loci have been identified as linked to the disease: PARK3
(3), PARK5/UCHL1 (4), PARK8/LRRK2 (5), PARK10 (6,7), PARK11 (8), PARK2/SOD2 (9-12),
PARK7/DJ1 (13,14), PARK15/FBXO7 (15), and PARK12 (8).Among the genes identified,
26
study in a Japanese family (5). Subsequently, a moderate penetrant (G2019S) mutation in LRRK2
was identified in several populations that would not have been detected by conventional linkage
analysis; the G2019S mutation is estimated to have a 30% lifetime penetrance (16).
While these linkage studies could elucidate the etiology of IPD in select families, new
methods were needed to begin the task of identifying the causes of most cases of IPD.
Approximately 15% of IPD cases are familial, while the rest are sporadic. With the advent of
genome-wide single nucleotide polymorphism (SNP) genotyping platforms, researchers began
looking for common variants that contribute to IPD. Such genome-wide association studies
(GWAS) have the ability to identify common variants that contribute to the risk for a disease,
and it was hoped that because IPD is a common disease that common variants could explain the
etiology of the disease. The first IPD GWAS, performed by the Linked Efforts to Accelerate
Parkinson's Solutions (LEAPS), studied 443 discordant sibling pairs with 332 case-unrelated
control pairs and identified 11 SNPs as likely to be associated with IPD (17). The second major
GWAS, performed by the National Institute of Neurological Diseases and Stroke (NINDS),
tested 547 unrelated individuals and was not able to replicate the LEAPS findings (18). Because
of its detection in many different linkage studies, GWAS researchers had expected to find a
significant association at LRRK2. Neither the LEAPS study nor the NINDS study was able to
detect polymorphisms near LRRK2 as being associated with IPD. A meta-analysis of 3,458 cases
and 3,719 controls from 10 different populations conducted by the Genetic Epidemiology of
Parkinson’s Disease (GEOPD) was also unable to replicate the findings of these studies (19).
The conflicting results from these studies raised skepticism about the ability to find susceptibility
27
This inability to discover associated loci could be explained by the fact that these studies
did not satisfy certain conditions. For loci to have significant association signals in a GWAS,
there needs to be sufficient allelic and locus homogeneity such that the genotyped markers are in
LD with the causal allele(s). In the case of a polygenic disorder such as IPD, this condition is
difficult to achieve. Also, the effect of an associated variant has to be modest in size, and the
variant has to have a relatively high frequency. The study population needs to be homogeneous;
population substructure, the presence of two or more groups with different genetic backgrounds
in a study, can cause false positive signals that obscure true associations and be a source of locus
heterogeneity. Because of their small sample sizes and heterogeneous populations, previous IPD
GWAS were under-powered to detect variants that contribute to IPD.
In order to increase power, it will be necessary to increase sample size and reduce locus
heterogeneity. GWA studies of other very common complex, multifactorial diseases, including
type 2 diabetes and coronary artery disease, now involve tens to hundreds of thousands of
samples genotyped at over a million markers to search for causative mutations. An alternate
approach is to increase power by focusing on specific populations with a shared genetic
background; the underlying logic is that individuals with a disease in the same population will
have inherited disease-causing variants from common ancestors.
This claim is supported by two GWA studies performed in different populations; the first
of these was a study conducted by Satake et al. in 2,000 cases and 18,000 controls in a Japanese
population in which the researchers were able to detect a significant association on a
genome-wide level for LRRK2, which is a very promising finding (20). The second study was conducted
by Simon-Sanchez et al. in a European population of 3,000 cases and 4,000 controls, and the
28
sample sizes, they had substantial power to detect associations. Both of these studies were able to
identify associated loci with genome-wide significance; Satake et al. found a novel risk locus,
which they named PARK16, as well as SNPs in BST1, SNCA, and LRRK2 to be associated with
IPD in their Japanese study population, while Simon-Sanchez et al. found SNPs in SNCA,
MAPT, and PARK16 to be significantly associated in their European study population. The
largest IPD GWAS to date, which was conducted by Do et al. in individuals of European
descent, consisted of 3,426 cases and 29,624 controls (22). This study identified two novel
associations with genome-wide significance at SCARB2 and SREBF1/RAI1 and confirmed
associations at LRRK2, GBA, SNCA¸MAPT, GAK, and the HLA region. Thus, these studies
indicate that genetic heterogeneity within the study population and the inability of common
SNPs to “tag” the G2019S mutation, and not simply a lack of power, prevented previous IPD
GWAS from finding an association signal at LRRK2.
In the European population, studies have suggested that G2019S-positive individuals
with late onset IPD share a common haplotype (23). The most recent estimates suggest that this
mutation arose from a common ancestry some 2500 years ago (24). This claim is supported by
the observation that G2019S mutations are far more common in the Ashkenazi and Middle
Eastern/North African populations than in the general European populations (25).
The Ashkenazi population is unique in that it features haplotypes that are European and
North African in origin (26). In this population, G2019S mutations are associated with 10 and
28%, respectively, of sporadic and family history positive patients. The best estimate of the
cumulative risk of IPD for G2019S carriers is 36% at 59 years, 59% at 69 years, and 80% at 79
29
this study will have increased power to detect therapeutic targets for IPD and contribute to the
search for more effective treatments for this debilitating disease.
Thus, a small, prospective GWAS in the Ashkenazi, followed by a larger replication
GWAS, was performed to look for common variants that could explain the genetics of IPD in
this population. While the initial GWAS was unable to detect an association signal near LRRK2,
the replication GWAS was able to detect a strong association signal across this region that
approached genome-wide significance. On chromosome 12q12, several SNPs in the genes
CNTN1 and SLC2A13 also approached genome-wide significance.
2.2 Methods
Samples
For the initial phase, a GWAS was conducted in an Ashkenazi population from New
York consisting of 25 LRRK2-G2019S positive individuals, 96 IPD cases, and 96 controls. The
replication phase of the study consisted of 166 IPD cases and 1,436 controls. The cases included
50 individuals that were known LRRK2 G2019S mutation carriers. The controls included 105
dystonia patients, 407 schizophrenia patients, 273 Crohn’s disease patients, and 651 healthy
controls.
Only individuals with 4 Ashkenazi grandparents were included in the study. The IPD
cases were confirmed by Dr. Susan Bressman, a movement disorder specialist, and were
obtained in collaboration with Dr. Laurie Ozelius of the Mount Sinai School of Medicine. Family
history information was collected from each patient, and none of the subjects included in the
analysis was known to be related or had a measured pair-wise kinship coefficient greater than 0.1
30
software package (28). In the replication study, 5 cases and 32 controls were excluded based on
relatedness.
Genotyping
For the first phase of the study, the samples were genotyped on the Affymetrix GeneChip
Human Mapping 500K SNP array. The genotype calls were made using the Birdseed V2
algorithm included in the Affymetrix Genotyping Console Software package. For the replication
phase of the study, all samples were genotyped on the Affymetrix Genome-Wide Human SNP
Array 6.0 platform according to the manufacturer’s protocol, and the genotype calls were made
using the Birdseed V2 algorithm.
Quality control of SNP Genotyping and Association Analysis
Standard quality control measures were used to filter the genotyping calls with the
PLINK software. Only SNPs with a minor allele frequencies > 0.05 and genotyping rates > 90%
that did not violate Hardy-Weinberg equilibrium were included in the association analysis. After
removing these SNPs, 357,319 markers and 634,338 markers remained in the initial study and
the replication study, respectively. The p-values for the association of each of the SNPs in the
initial study were calculated by comparing the distribution of the genotypes between the cases
and controls with a Fisher’s 2x3 exact test. The association analysis for the replication study was
performed for the genotyped and imputed SNPs (see below) for the replication study using the
mach2dat tool in the MaCH software package. An association was considered to have
genome-wide significance if the p-value was less than 2.0 x 10⁻⁸; this threshold was determined using
31
To reduce type I error that resulted from aggressive genotyping calling by the Birdseed
algorithm, the fluorescent probe intensities for each allele for each genotype were plotted for
SNPs with p-values that were less than 1.0 x 10⁻⁵. These scatter plots were used to determine if
the genotype calls had been made inappropriately.
Imputation
For the replication phase of the study, additional genotypes were imputed using MACH
(MArkov Chain Haplotyping) (29, 30). A set of reference haplotypes was created using the
HapMap2 CEU population after first ensuring that the alleles from the current study matched the
HapMap alleles for SNPs that were found in both data sets (i.e., that they were genotyped on the
same strand). The genotypes from the HapMap data were phased to produce a set of reference
haplotypes with the following parameters: rounds 20, states 300, phase, interim 5,
--sample 5, --compact.
Then, this set of reference haplotypes was used to impute additional markers with the
following options in MaCH: --rounds 5, --states 200. For genotype inference, only SNPs
genotyped on the Affymetrix platform with genotyping rates > 90% and minor allele frequencies
> 5% that did not violate Hardy-Weinberg equilibrium (p< 0.000001) were included in the input
files.
Analysis of Population Stratification
Population stratification is known to confound the results of association studies. To
assess population stratification, the genomic control inflation factor, , was calculated by
32
disequilibrium with each other. The median of the observed chi-squared distribution of the
association values for these SNPs was divided by the expected median of this distribution to
obtain a value of 1.04, which was indicative of negligible population stratification.
To further rule out population stratification, principal components analysis was
performed in EIGENSTRAT (31) by comparing the study population with the CEU and YRI
HapMap populations. These two populations were selected because evidence suggests that the
Ashkenazi population is characterized by the presence of haplotypes that are both European and
North African in origin. The first two principal components were plotted, and the population
clustered together, reflecting the coancestry of the study population.
Plots
The Manhattan plots and Q-Q plots were produced using the “qqman” package in the R
software package. The plot of the association signal for LRRK2 was produced in Locus Zoom
(32) using data from the 1000 Genomes project European population (hg19).
2.3 Results
Initial GWAS
An initial GWAS was conducted in an Ashkenazi population from New York consisting
of 25 LRRK2-G2019S positive individuals, 96 IPD cases, and 96 controls. Only individuals with
4 Ashkenazi grandparents were included in the study, and the absence of population admixture
was confirmed by genetic analysis with the Eigenstrat software package. IPD cases were
confirmed by Dr. Susan Bressman, a movement disorder specialist, and were obtained in
33
information was collected from each patient, and none of the subjects included in the analysis
was known to be related or had a measured pair-wise kinship coefficient greater than 0.1 with
another participant (i.e., less related than first cousins) as measured by PLINK. The samples
were genotyped on the Affymetrix GeneChip Human Mapping 500K platform, and the
genotypes were called with the Birdseed V2 algorithm included in the Affymetrix Genotyping
Console Software package. SNPs were filtered based on the MAF, missingness of genotypes,
and violation of Hardy-Weinberg equilibrium; after this, 357,319 markers remained. The
significance of the associations was calculated by comparing the distribution of the genotypes
between the cases and controls with Fisher’s exact test.
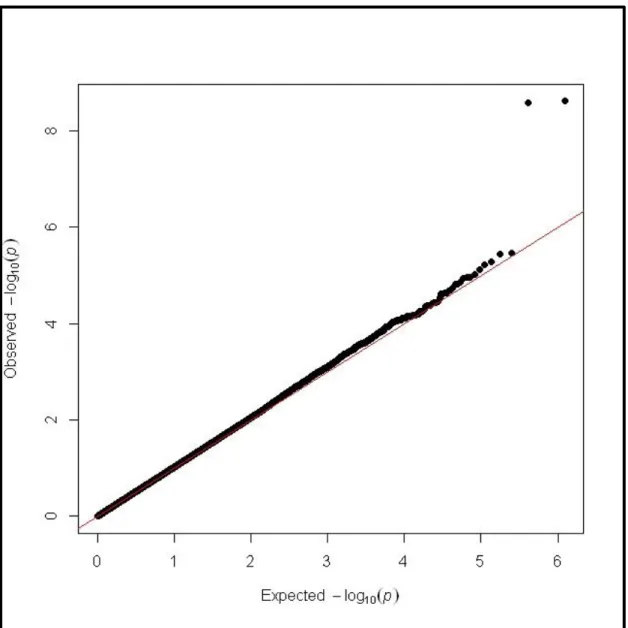
An examination of the distribution of the association statistics indicated the possibility of
Type I errors. There were far more significant associations than what would have been expected,
which was confirmed by a Q-Q plot (Figure 2.1). The high rate of positive associations was due
to the aggressiveness of the genotype calling algorithm. Visual analysis of the genotyping cluster
plots allowed for the exclusion of SNPs that were not called correctly.
By reducing the possibility of false positive associations resulting from aggressive
genotype calling through visual genotype plot analysis, the list of loci potentially associated with
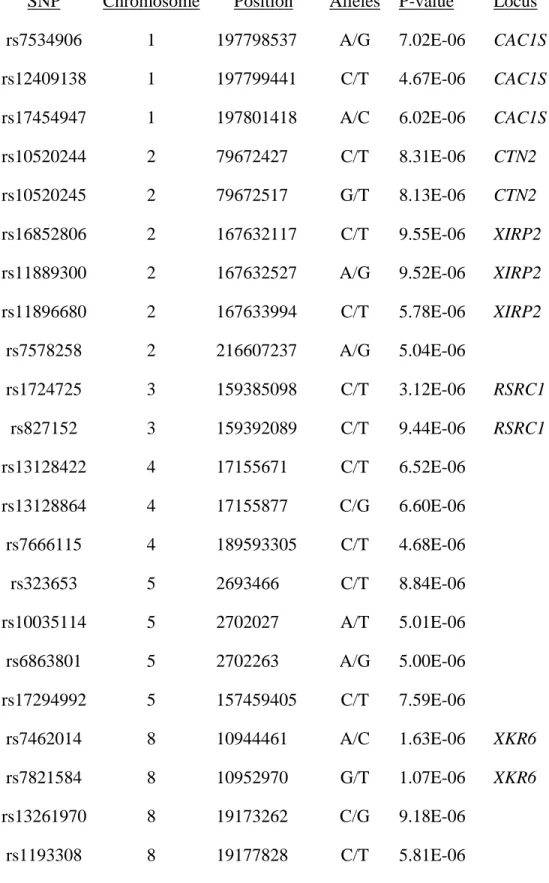
IPD was refined. The most significantly associated SNPs are listed in Table 2.1. A significant
association signal was not detected across LRRK2, most likely because the Affymetrix 500K
platform does not tag this mutation well and because the signal was obscured by the cases
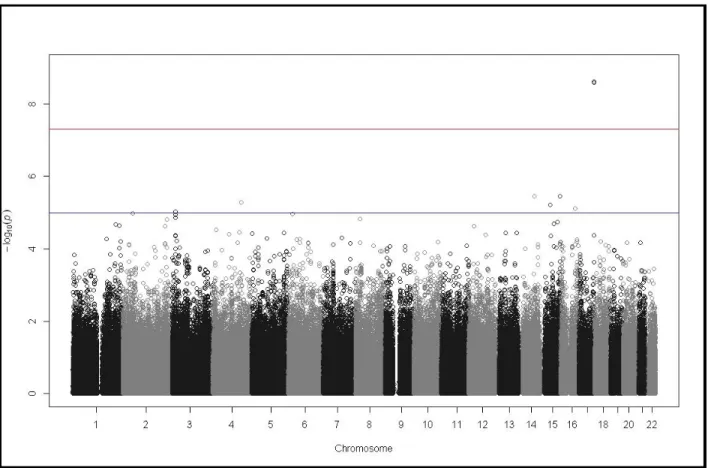
without LRRK2 mutations (Figure 2.2). LRRK2 was significantly associated in this sample only
when considering the LRRK2-positive cases vs. the controls (Figure 2.3), which illustrates why
previous IPD GWAS have been unable to find a significant association in the region of LRRK2
34
20q11.22 was the most significant with a p-value of 9.21 X 10⁻⁷, which is greater than the
threshold for genome-wide significance. This variant is located in C20ORF173. Because of the
small sample size of this initial GWAS, a replication GWAS was performed.
Replication GWAS
For the replication phase of the study, the study group initially consisted of 166 IPD cases
and 1,436 controls. The cases included 50 individuals that were known LRRK2 G2019S mutation carriers. The controls included 105 dystonia patients, 407 schizophrenia patients, 273 Crohn’s
disease patients, and 651 healthy individuals. After filtering out individuals for relatedness, 161
cases and 1,404 controls remained. All samples were genotyped on the Affymetrix 6.0
genotyping platform, which allows for the genotyping of nearly one million SNPs. After filtering
for missingness and MAF as described above, 634,338 SNPs remained. To provide greater
coverage of the genome, imputation was performed with MaCH to infer the genotypes for
additional markers using the HapMap CEU population. When including the imputed SNPs, the
dataset consisted of 2,557,252 SNPs. The association statistics were calculated using the
mach2dat tool. The p-values for the most significantly associated SNPs are listed in Table 2.2,
and the results are displayed as a Manhattan plot in Figure 2.4.
Two SNPs on chromosome 12 were found to have association signals with genome-wide
significance: rs10506095 (p= 2.49x10⁻¹⁰) and rs7316771(p=1.19x10⁻⁹). Both are located in an
intergenic region on chromosome 12p11.21, but these markers flanked FGD4. One SNP on
chromosome 17q21.2 was also found to have a genome-wide significant association signal: