Statistical design of noninferiority multiple region clinical trials
to assess global and consistent treatment effects
Guoqing Diaoa, Donglin Zengb, Joseph G. Ibrahimb, Alan Rongc, Oliver Leec, Kathy Zhangc,
and Qingxia Chend
aDepartment of Statistics, George Mason University, Fairfax, Virginia, USA
bDepartment of Biostatistics, University of North Carolina at Chapel Hill, Chapel Hill, North
Carolina, USA
cAmgen Inc., Thousand Oaks, California, USA
dDepartment of Biostatistics, Vanderbilt University, Nashville, Tennessee, USA
Abstract
Noninferiority multiregional clinical trials (MRCTs) have recently received increasing attention in drug development. While a major goal in an MRCT is to estimate the global treatment effect, it is also important to assess the consistency of treatment effects across multiple regions. In this paper, we propose an intuitive definition of consistency of noninferior treatment effects across regions under the random-effects modeling framework. Specifically, we quantify the consistency of treatment effects by the percentage of regions that meet a predefined treatment margin. This new approach enables us to achieve both goals in one modeling framework. We propose to use a signed likelihood ratio test for testing the global treatment effect and the consistency of noninferior treatment effects. In addition, we provide guidelines for the allocation rule to achieve optimal power for testing consistency among multiple regions. Extensive simulation studies are conducted to examine the performance of the proposed methodology. An application to a real data example is provided.
Keywords
Consistency of treatment effects; global treatment effect; multiregional clinical trial; noninferiority clinical trial; random effects model; signed likelihood ratio test
1. Introduction
Drug development in recent years has seen the increased popularity of multiregional clinical trials (MRCTs). By including relevant regions in one protocol, MRCTs, when well
conducted, can simultaneously achieve two important goals, per the International Conference on Harmonization (ICH) E5 and ICH E17 (ICHE17) guidelines (ICH1998). First, an MRCT can provide a global estimate of treatment effect by combining data from
HHS Public Access
Author manuscript
J Biopharm Stat
. Author manuscript; available in PMC 2018 March 15.Published in final edited form as:
J Biopharm Stat. 2017 ; 27(6): 933–944. doi:10.1080/10543406.2017.1293075.
A
uthor Man
uscr
ipt
A
uthor Man
uscr
ipt
A
uthor Man
uscr
ipt
A
uthor Man
uscr
different regions. Secondly, it can provide the needed regional information to bridge the global conclusion to each region or between different regions (Hung et al., 2010). However, the key to achieving these goals rests mainly on the consistency of the treatment effects across different regions. If the treatment effects are similar across regions, the global treatment effect estimate should provide a more precise estimate for the treatment effect while regional estimates should provide adequate evidence for internal bridging. Otherwise, reasons for regional differences need to be explored and additional bridging studies may be necessary.
For each MRCT, evaluation of treatment consistency usually covers both the global consistency and the regional-specific consistency. Although regional-specific consistency (one region vs. the rest, or one region vs. another) is relevant for regional approval, global consistency (whether treatment effects are similar across all regions) is more essential to warrant the validity of the primary study conclusion. Several regional agencies, including the Committee for Medicinal Products for Human Use Committee for Medicinal Products for Human Use (CHMP) (2009) and Ministry of Health, Labour and Welfare of Japan (2007), have issued guidance on the assessment of treatment consistency in MRCTs. More recently, Quan et al. (2010), Chen et al. (2010), and Shih and Quan (2013) described a variety of methods for evaluating the global and/or regional treatment consistency. A summary of the regulatory requirements and detailed discussion of these methods are provided in the book Design and Analysis of Bridging Studies (Liu et al., 2013).
Most MRCTs assume treatment consistency when designing the trial. But in reality, regional treatment effects differ due to potential intrinsic and extrinsic factors as classified by ICH E5 Guideline such as ethnics, culture, diet, genetics, and environment. See Chapter 1 of Design and Analysis of Bridging Studies (Liu et al., 2013) for a detailed discussion. A fixed effects model as well as a random effects model can provide estimates on both overall and regional treatment effects. The question as to which model is more appropriate often remains open. There is however a growing recognition that a random effects model may provide more robust assessments in MRCTs due to its capacity to incorporate the additional between-region variability in the estimation procedure. Furthermore, a fixed-effects model may involve many parameters when there are many regions. See Hung et al. (2010) for a discussion on how different models can impact study design on power and sample size, and Quan et al. (2013) on how to use the random effects model to estimate the overall and regional treatment effect. As active treatments are approved and available to patients, placebo controlled studies for the development of additional treatments may no longer be ethical.
As pointed out in Section 3.5.2 by Shih and Quan (2013), most of the methods discussed so far have focused consistency on superiority trials hence may not be directly applicable to noninferiority trials. A noninferiority study compares an investigational drug with an active control with the objective of demonstrating that the difference between the two is within an acceptable limit. The experimental drug may have nonefficacious benefits such as reduced toxicities, lower cost, or route of administration. Final guidance on the conduct of non-inferiority clinical trials was provided by FDA (2016). Methods to define the nonnon-inferiority margin and critical assumptions of noninferiority studies are all described in the FDA
A
uthor Man
uscr
ipt
A
uthor Man
uscr
ipt
A
uthor Man
uscr
ipt
A
uthor Man
uscr
document. There is limited work on assessing consistency in a noninferiority MRCT. Proposed methods for non-inferiority trials include shifted quantitative and qualitative treatment by region interaction tests (Wiens and Heyse, 2003; Hsieh and Liu, 2013) and a simultaneous test by Quan and Shih (2002) that jointly tests all regions against region-specific noninferiority margins. Essentially all these methods are based on fixed effect models.
A motivating example was a noninferiority MRCT on patients with colorectal cancer (CRC), which is the fourth-leading cause of cancer-related deaths worldwide. It has been known that the anti-epidermal growth factor receptor (EGFR) monoclonal antibodies cetuximab (a chimeric IgG1 antibody) and panitumumab (a fully human IgG2 antibody) provide clinical benefit in patients with chemotherapy-refractory metastatic colorectal cancer (mCRC) in the monotherapy setting (Jonker et al., 2007; Van Cutsem et al., 2007). The standard of care has evolved since the approval of these agents, and consequently, the re-evaluation of safety and efficacy in this setting is important and timely. The randomized, double-blind, phase 3 ASPECCT study (A Study of Panitumumab Efficacy and Safety Compared to Cetuximab) is the first head-to-head comparison of overall survival (OS) benefit of panitumumab and cetuximab in chemotherapy-refractory wild-type Kirsten rat sarcoma viral oncogene homolog exon 2 mCRC (Price et al., 2014). ASPECCT, which enrolled patients worldwide, is the largest prospective direct comparison of anti-EGFR therapies in mCRC, and is among the largest head-to-head comparisons of anticancer biologic agents in mCRC. The study was conducted in 27 countries in North and South America, Europe, Asia, Africa, and Australia. Four countries with sample sizes ≤ 5 were excluded from the analysis. Crossover between panitumumab/cetuximab was not permitted during the study treatment period. Patients were followed up for OS for 24 months after randomization of the last patient. Given the similar mechanisms of action, ASPECCT is a noninferiority study designed to demonstrate that panitumumab retains ≥ 50% of the OS treatment effect of cetuximab versus best supportive care (BSC). The predicted effect of cetuximab versus BSC on OS was based on the CO.17 study (Karapetis et al., 2008) (hazard ratio [HR]= 0.55; 95% CI, 0.41 0.74). A thousand patients were enrolled to achieve 90% power with a one-sided α = 0.025 for the OS inferiority null hypothesis.
In this paper, we propose a statistical design for an MRCT in order to evaluate the noninferiority of an experimental drug in multiple regions and to assess consistency of the treatment effects across regions. We provide a new definition of consistency of noninferior treatment effects across multiple regions under the random effects modeling framework. We then propose to use the signed likelihood ratio test (LRT) for testing consistency and derive an optimal allocation rule to maximize the power. Extensive simulation studies are carried out to examine the performance of the proposed methodology. An application to a real data example is provided. The rest of this paper is organized as follows. In Section 2, we describe the proposed methodology to define and test consistency of treatment effects in a
noninferiority MRCT. Extensive simulations studies are presented in Section 3 to examine the finite sample properties of the proposed methodology. In Section 4, we illustrate the new methods through an application to the motivating ASPECCT study. We conclude with a brief discussion in Section 5.
A
uthor Man
uscr
ipt
A
uthor Man
uscr
ipt
A
uthor Man
uscr
ipt
A
uthor Man
uscr
2. Methods
2.1. Definition of consistency
In this section, we provide an intuitive and new definition of consistency of noninferior treatment effects across regions. We focus on global consistency because it is most important. Noninferiority MRCTs, with their usual large study size, often enroll patients in large number of regions. Unless specifically committed, sample sizes in most regions (if not all) in noninferiority MRCTs do not warrant an independent region-specific test of
noninferiority with reasonable power. Therefore, almost all regulatory agencies will rely heavily on strength of the global consistency of the data to extrapolate the overall study conclusion to their specific regions for drug approval.
Consider L regions and let βl denote the log-hazard ratio for the lth region, l = 1,…, L. Since
βl varies from region to region, a reasonable model to quantify this variability is to assume a
random effects model:
(1)
where the ul’s are i.i.d N(0, σ2) random variables and σ2 characterizes the variability across
the regions. This random-effects model framework allows one to model heterogeneity among the patient population across different regions. A value of 0 for σ2 implies that there is no treatment difference across different regions. This kind of mixed effects model has been extensively used in different settings such as in meta-analysis.
In model (1), β represents the overall treatment effect across regions. Therefore, a
noninferiority MRCT involves testing H0g : β − β0 > M, where β0 is the effect of an active
control and M is the specified margin. In practice, we usually set β0 = 0. Rejecting H0g will
provide evidence to declare that the log-hazard of the experimental drug is at most M larger than the log-hazard of the active control. In an MRCT, in addition to testing the treatment effect, another important objective is to assess the global consistency across regions. Here we propose an intuitive definition for global consistency using a probabilistic approach to accommodate the usual large number of regions involved in noninferiority MRCTs. Assuming all regional treatment effects come from the same underlying distribution, we define consistency based on the percent of regions among all regions that indeed reach noninferiority. Consistency is achieved when the percentage of those regions surpasses a prespecified threshold. Notice this definition is different from the concept of treatment similarity proposed by Liu et al. (2009) for superiority trials although both involve noninferiority hypothesis testing. Under this definition, consistency is achieved as long as the treatment is noninferior to the active control in the majority of the regions even if the regional effects are very different.
For the above consistency definition, one quantity for assessing the majority of noninferior treatment effects is P(βl − β0 ≤ M) where βl is given in model (1). Therefore, if this
probability is larger than a prespecified proportion p (say, 80%), then this means that at least p × 100% of the regions would have noninferior treatment effects. Since P (βl − β0 ≤ M) = Φ
A
uthor Man
uscr
ipt
A
uthor Man
uscr
ipt
A
uthor Man
uscr
ipt
A
uthor Man
uscr
{(β0 + M − β)/σ} where Φ(.) is the cumulative distribution function of the standard normal
distribution, consistency thus holds if β − β0 ≤ M − σΦ−1(p), where Φ−1(p) is the 100pth
percentile of the standard normal distribution. In other words, the null hypothesis we wish to reject is:
The above definition of consistency enables us to test both the global treatment effect and the consistency of treatment effects across multiple regions with one test and one common noninferiority margin. Note that the null hypothesis for testing the global treatment effect is:
and Φ−1(0.5) = 0. Therefore, to test the global treatment effect is equivalent to testing that 50% of the regions have noninferior treatment effects by setting p = 0.50. If the margin M is deemed to be too rigorous, we can certainly use a separate test with a different (and perhaps more relaxed) margin to test the hypothesis for global consistency.
2.2. Signed (LRT) approach
In this section, we describe a signed LRT (Barndorff-Nielsen, 1986) for testing the
consistency of noninferior treatment effects defined in the previous section 2.1. Without loss of generality, we fit a survival model for each region separately and obtain the parameter
estimates , l = 1,…, L. The estimated variance of based on the data from the lth region is
, l = 1,…, L. We then fit the following linear mixed model:
(2)
where ul ~ N(0, σ2) and . We assume is known, where is related to
disease prevalence of each specific region (Kalbfleisch and Prentice, 2011, Chapter 5.7) and is often available to investigators. We can maximize the following log-likelihood to obtain
the maximum likelihood estimators (MLEs) of β and σ, denoted by and :
where C is a constant.
Recall that the null hypothesis H0c (i.e., p × 100% of the regions have noninferior treatment
effects) for testing consistency is given by:
A
uthor Man
uscr
ipt
A
uthor Man
uscr
ipt
A
uthor Man
uscr
ipt
A
uthor Man
uscr
where βl = β + ul. We can rewrite the above null hypothesis as:
where γ = β + σΦ−1(p). Letting γ0 = β0 + M, the alternative hypothesis H1b is given by:
We propose to use a profile likelihood approach. The log-likelihood of the unknown parameters θ = (γ, σ2) is given by:
We denote the MLE of θ under the null hypothesis H0b and the alternative hypothesis H1b by
and , respectively. The LRT statistic for testing H0b is given by:
Under the null hypothesis, W asymptotically follows a distribution. Since we have a one-sided alternative hypothesis, we consider the signed likelihood ratio test statistic (Barndorff-Nielsen, 1986):
where sign (x) = I(x > 0) − I(x < 0) and I(·) is the indicator function. Under H0b, RMLE
asymptotically follows a standard normal distribution and we reject the null hypothesis for small values of RMLE.
It is known that the MLE of σ2 is negatively biased especially when the sample size is small. Alternatively, we can obtain the restricted maximum likelihood (REML) estimator of θ by maximizing the restricted log-likelihood:
Similarly, we can calculate LRT statistic using the REML estimators, leading to:
A
uthor Man
uscr
ipt
A
uthor Man
uscr
ipt
A
uthor Man
uscr
ipt
A
uthor Man
uscr
where and are the REML estimators under the null and alternative hypotheses, respectively. The corresponding signed LRT statistic is defined as:
where is the REML estimator of γ under H1b.
Both signed LRT statistics RMLE and RREML have the same asymptotic standard normal distribution. However, the test statistic RREML based on the REML estimators is expected to perform better than RMLE with a small sample size, which is typical in multiple region clinical trials. We use the routine optim() in R (R Core Team, 2013) to maximize the log-likelihood and the restricted log-log-likelihood. The proposed signed LRT tests have been implemented in an R package, which is freely available upon request.
2.3. Optimal allocation
In this section, we provide a procedure to allocate patients to achieve optimal power for testing the consistency among multiple regions in a noninferiority clinical trial. Let πl be the
proportion of subjects in the lth region, l = 1,…, L. We propose to minimize the limiting
variance of for given p, vl, l = 1,…, L, and the total sample size . By
inverting the Fisher information matrix, we can show that:
where nl = Nπl, l = 1,…, L. We minimize the above variance under the constraint
by using the quasi-Newton algorithm. It is worth noting that in order to obtain the above allocation rule, one needs to specify the values of σ2, p, vl, l = 1,…, L and the total
sample size N.
2.4. A special case
In this section, we consider a special case under which the within region variances (vl’s) are
assumed to be the same, i.e., v1 = ⋯ = vL = v. In this case, it can be shown that the equal
allocation rule is optimal. In fact, we can show that the minimizer of:
is π1 = ⋯ = πL = 1/L, l = 1,…, L.
Define . Under regularity conditions and assuming σ > 0, we can show that:
A
uthor Man
uscr
ipt
A
uthor Man
uscr
ipt
A
uthor Man
uscr
ipt
A
uthor Man
uscr
in distribution as L → ∞. Therefore, when γ − γ0 = L−1/2δ, the asymptotic local power of
the signed LRT test at significance level α is Φ(−Zα − δ*), where:
In our experience, the above large sample approximation works reasonably well when L is larger than 20. We note that given L and σ2, the above asymptotic local power reaches its
upper bound when n → ∞, under which:
3. Simulation studies
We conduct extensive simulation studies to examine the small sample performance of the proposed signed LRTs. We generate data from model (2) using settings similar to the ASPECCT study. Specifically, we set the values of L, vl, and πl, l = 1,…, L from the
ASPECCT study as presented in Table 1, where each of the 23 countries with enrollment of ≥ 10 subjects in this study defines one specific region. We also set β0 = 0 and M = 0.15. We
vary the total sample size N and the variance parameter σ2 such that N = j × 575, j = 1,…, 4, and σ = k × 0.1345, k = 1,…, 4. Here the case of N = 1150 and σ = 0.269 corresponds to the setting obtained from the ASPECCT study. Note that while the null value of γ is fixed, different values of σ lead to different null values of β. Therefore, we vary the values of β as follows:
The null values of β for testing H0b : P (βl − β0 ≤ M) = 0.8 corresponding to σ = k × 0.1345,
k = 1,…,4 are 0.0368, −0.0764, −0.1896, and −0.3028, respectively. All simulation results are based on 10,000 replicates.
To examine the impact of the total sample size on the power of the test, we consider the case when β = β0 + M − 2.69 × Φ−1 (0.8)/4, which yields reasonable powers for comparison.
Figure 2 displays the powers of the signed LRT using the REML estimators in this case. As expected, the power increases as n increases. However, the rate of the increment of the power is small especially when σ is large.
A
uthor Man
uscr
ipt
A
uthor Man
uscr
ipt
A
uthor Man
uscr
ipt
A
uthor Man
uscr
In the second set of simulation studies, we examine the performance of the proposed allocation rule and compare it with the allocation rule in the ASPECCT study and the equal allocation rule. We consider the same simulation setting as above. Figure 3 presents the type I error rates and powers of the signed LRT using the REML estimators for testing H0b : P (βl
− β0 ≤ M) = 0.7. In all cases, the proposed allocation rule performs as well as or outperforms
the equal allocation rule and the original allocation rule in the ASPECCT study.
4. The ASPECCT study
We apply the proposed signed LRTs to the ASPECCT study. Four regions with five or less patients were excluded from the analysis. Table 1 presents the data from this study including
the log-hazard ratio estimates , standard error estimates , sample sizes nl, number of
events dl, and , l = 1,…, 23. We note that the country level data for the ASPECCT study
has been modified slightly since the study is still ongoing.
We analyze the data and obtain the MLEs and REML estimators of β and σ at
and . We apply the proposed signed
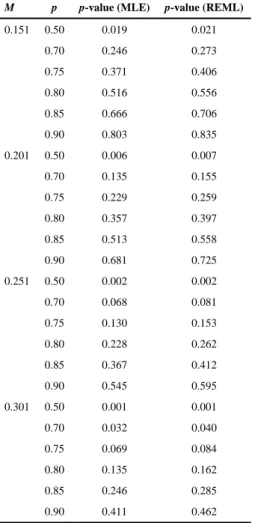
LRT tests to the real data and consider four scenarios for the margin, M = 0.151, 0.201, 0.251, and 0.301. We also vary p from 0.5 to 0.90. Table 2 presents the p-values of the tests using the MLEs and the REML estimators. For M ≤ 0.251, no significant results were detected for either method except when p = 0.5, under which the tests are equivalent to testing the overall noninferior effect of the drug because Φ−1(0.5) = 0. When M = 0.301, there is strong evidence that at least 70% of the regions have noninferior treatment effects. Note that the MLE of σ is negatively biased leading to a smaller estimator of γ compared to γREML and therefore, the signed LRT using MLEs tends to have smaller p-values than the
signed LRT using the REML estimators.
We also perform a residual analysis to check the goodness-of-fit of the model to the ASPECCT data. We calculate the fitted values of the random effects as:
and:
Define . It can be shown that .
Therefore, the standardized predictors of the random effects (ul’s) are given by:
A
uthor Man
uscr
ipt
A
uthor Man
uscr
ipt
A
uthor Man
uscr
ipt
A
uthor Man
uscr
where . Figure 4 presents the histograms and normal Q–Q plots of . The observed data points are close to a straight line with intercept 0 and slope 1, suggesting a good fit of the model to the data.
5. Discussion
In this paper, we propose an intuitive definition of consistency quantified by the percentage of regions with noninferior treatment effects. Under this definition, the treatment effects are consistent if a prespecified percentage of regions have noninferior treatment effects even if the treatment effects are very different. It is worth to note that it is subjective to select the threshold and future discussion on this topic is needed. Alternatively, we can define consistency such that the treatment effects across regions are similar to each other. This definition requires that the treatment effects should not differ much from region to region. For this consistency definition, one quantity for assessing the variability of the treatment
effects across regions is the so-called coefficient of variation , which describes how different region effects vary with respect to the whole population average deviation from β0. This quantity has been popularly used in assessing measurement errors in
biomarkers. Therefore, if CV is less than a prespecified threshold c0 (say, 20%), we would then conclude that consistency is obtained. In other words, we will declare success of an MRCT if β − β0 ≤ M and CV ≤ c0, i.e., β − β0 ≤ M and . This implies that the
null hypothesis is:
Let and be the MLEs or the REMLs estimator from model (2). Then we reject H0c if:
for some constants c1 and c2 which will be determined by joint distribution of under . As a referee pointed out, since the threshold c0 has some subjectivity, then, similar to the overall noninferiority margin, the threshold should also be discussed with regulators.
Based on the definition of consistency in Section 2, consistent noninferior treatment effects across regions imply global noninferior treatment effects. Therefore, one may first test whether there is significant global noninferior treatment effect and then test for the
consistency of noninferior treatment effects across regions given that the global noninferior treatment effect is significant. To control the overall type I error of the sequential test, we determine critical values c1 and c2 such that:
where M1 and M2 are the margins for testing the global noninferior drug effect and the
consistency of noninferior treatment effects across regions, respectively. Note that we can
A
uthor Man
uscr
ipt
A
uthor Man
uscr
ipt
A
uthor Man
uscr
ipt
A
uthor Man
uscr
use more stringent margins for assessing a global treatment effect compared to assessing the consistency of treatment effects across regions. This methodology is the subject of future work.
In this paper, we have used a unified margin to assess the global consistency based on the definition in Section 2. Research is underway to expand this method to handle region-specific consistency margins (in this case Ml for l = 1,…, L). However, the use of
region-specific margins for global consistency should be performed with caution in MRCTs (Tsong and Tsou, 2013). Defining the region-specific margins per FDA Guidelines (FDA, 2016) requires information on the magnitude and variability of the estimated control treatment effect (over placebo) in each of the regions. As discussed in Section 2, this information is usually unavailable hence the argument for a unified margin (which is based on the always available historical global control effect). Region-specific margins can be justified when local regulatory agencies require the assessment of regional consistency. It should be noted that regional consistency is more meaningful when positive conclusions on global
noninferiority and global consistency have been reached. How to conduct these analyses with either a unified or a sequential approach is also the subject of future work.
This paper focused on noninferiority trials. The goal of noninferiority trial is not only to show that the new drug is noninferior to the active control, but also to show more importantly that the new drug is better than the placebo (FDA, 2016). Therefore for noninferiority trials, evaluating treatment effects (to ensure the new drug is better than the placebo) in all regions is fundamentally necessary compared with superiority trials (even if sample sizes may be small for some regions). Note that in the reality of drug development, the testing for regional consistency (i.e., are treatment effects consistent across all regions?) is different from the testing for overall noninferiority (i.e., is the new treatment non-inferior to the active control?); therefore could warrant different noninferiority margins. Based on our experience, noninferiority margin for regional consistency can be much less tight depending on the active control effect on placebo and sample sizes for each region. With a relaxed margin, the key for evaluating regional consistency is not whether treatment effects are positive, rather the treatment effects are above a predefined threshold (hence consistent) in most if not all regions.
Acknowledgments
The authors wish to thank the associate editor and one anonymous referee for their helpful comments that have greatly improved the presentation of this paper. The authors also thank Amgen’s Department of Global Biostatistics for providing the data on the ASPECTT trial and Dr. Chunlei Ke at Amgen for helpful discussions.
References
Barndorff-Nielsen OE. Infereni on full or partial parameters based on the standardized signed log likelihood ratio. Biometrika. 1986; 73:307–322.
Chen J, Quan H, Binkowitz B, Ouyang SP, Tanaka Y, Li G, Menjoge S, Ibia E. Assessing consistent treatment effect in a multi-regional clinical trial: A systematic review. Pharmaceutical Statistics. 2010; 9:242–253. [PubMed: 20872623]
Committee for Medicinal Products for Human Use (CHMP). Reflection paper on the extrapolation of results from clinical studies conducted outside the European Union (EU) to the EU. 2009
A
uthor Man
uscr
ipt
A
uthor Man
uscr
ipt
A
uthor Man
uscr
ipt
A
uthor Man
uscr
FDA. Non-Inferiority Clinical Trials to Establish Effectiveness Guidance for Industry. U.S. Department of Health and Human Services. Food and Drug Administration, Center for Drug Evaluation and Research, Center for Biologics Evaluation and Research; 2016.
Hsieh, ET-C., Liu, J-p. Interaction effects in bridging studies. In: Liu, J-pChow, S-C., Hsiao, C-F., editors. Design and Analysis of Bridging Studies. Boca Raton, FL: CRC Press; 2013.
Hung H, Wang SJ, O’Neill RT. Consideration of regional difference in design and analysis of multi-regional trials. Pharmaceutical Statistics. 2010; 9:173–178. [PubMed: 20872619]
ICH E17. Final Concept Paper. General Principles on Planning/Designing Multi-Regional Clinical Trial. 2014. http://www.ich.org/fileadmin/Public_Web_Site/ICH_Products/Guidelines/Efficacy/E17/ E17_Final_Concept_Paper_July_2014.pdf. (accessed November 2016)
ICH, International Conference on Harmonisation. Tripartite guidance e5 ethnic factors in the acceptability of foreign data. The U.S. Federal Register. 1998; 83:31790–31796.
Jonker DJ, O’Callaghan CJ, Karapetis CS, Zalcberg JR, Tu D, Au HJ, Berry SR, Krahn M, Price T, Simes RJ, et al. Cetuximab for the treatment of colorectal cancer. New England Journal of Medicine. 2007; 357:2040–2048. [PubMed: 18003960]
Kalbfleisch, JD., Prentice, RL. The Statistical Analysis of Failure Time Data. Vol. 360. Hoboken, NJ: John Wiley & Sons; 2011.
Karapetis CS, Khambata-Ford S, Jonker DJ, O’Callaghan CJ, Tu D, Tebbutt NC, Simes RJ, Chalchal H, Shapiro JD, Robitaille S, et al. K-ras mutations and benefit from cetuximab in advanced colorectal cancer. New England Journal of Medicine. 2008; 359:1757–1765. [PubMed: 18946061] Liu, J-p, Chow, SC., Hsiao, CF. Design and Analysis of Bridging Studies. CRC Press; 2013.
Liu JP, Lin JR, Hsieh E. A noninferiority test for treatment-by-factor interaction with application to bridging studies and global trials. Drug Information Journal. 2009; 43:11–16.
Ministry of Health, Labour and Welfare of Japan. Basic Principles on Global Clinical Trials. Tokyo, Japan: Pharmaceuticals and Medical Devices Agency; 2007.
Price TJ, Peeters M, Kim TW, Li J, Cascinu S, Ruff P, Suresh AS, Thomas A, Tjulandin S, Zhang K, et al. Panitumumab versus cetuximab in patients with chemotherapy-refractory wild-type kras exon 2 metastatic colorectal cancer (aspecct): A randomised, multicentre, open-label, non-inferiority phase 3 study. The Lancet Oncology. 2014; 15:569–579. [PubMed: 24739896]
Quan H, Li M, Chen J, Gallo P, Binkowitz B, Ibia E, Tanaka Y, Ouyang SP, Luo X, Li G, et al. Assessment of consistency of treatment effects in multiregional clinical trials. Drug Information Journal. 2010; 44:617–632.
Quan H, Li M, Shih WJ, Ouyang SP, Chen J, Zhang J, Zhao PL. Empirical shrinkage estimator for consistency assessment of treatment effects in multi-regional clinical trials. Statistics in Medicine. 2013; 32:1691–1706. [PubMed: 22855311]
Quan H, Shih WJ. Treatment by stratum interaction test for equivalence and non-inferiority trials. Proceedings of the Biopharm Section, Joint Stat. Meetings, Am Stat Assoc., CD Version, ASA. 2002
R Core Team. R: A Language and Environment for Statistical Computing. Vienna, Austria: R Foundation for Statistical Computing; 2013.
Shih, WJ., Quan, H. Consistency of treatment effects in bridging studies and global multiregional trials. In: Liu, J-pChow, S-C., Hsiao, C-F., editors. Design and Analysis of Bridging Studies. Boca Raton, FL: CRC Press; 2013.
Tsong, Y., Tsou, HH. Multiregional clinical trials. In: Liu, J-pChow, S-C., Hsiao, C-F., editors. Design and Analysis of Bridging Studies. Boca Raton, FL: CRC Press; 2013.
Van Cutsem E, Peeters M, Siena S, Humblet Y, Hendlisz A, Neyns B, Canon JL, Van Laethem JL, Maurel J, Richardson G, et al. Open-label phase III trial of panitumumab plus best supportive care compared with best supportive care alone in patients with chemotherapy-refractory metastatic colorectal cancer. Journal of Clinical Oncology. 2007; 25:1658–1664. [PubMed: 17470858] Wiens BL, Heyse JF. Testing for interaction in studies of noninferiority. Journal of Biopharmaceutical
Statistics. 2003; 13:103–115. [PubMed: 12635906]
A
uthor Man
uscr
ipt
A
uthor Man
uscr
ipt
A
uthor Man
uscr
ipt
A
uthor Man
uscr
Figure 1.
Sizes and powers for testing H0b with N = 575. Solid and dashed curves correspond to the
sizes and powers of the signed likelihood ratio test using the MLEs and the REML estimators, respectively. Black, blue, red, and green curves correspond to the sizes and powers when σ = 0.1345, 0.269, 0.4035, and 0.538, respectively. The null values of β for
, and are 0.0368, −0.0764, −0.1896, and −0.3028, respectively.
A
uthor Man
uscr
ipt
A
uthor Man
uscr
ipt
A
uthor Man
uscr
ipt
A
uthor Man
uscr
Figure 2.
Powers for testing H0b with β = −0.416. —-, ; —-, ;, ; —-, .
Sample size of N = 1150 corresponds to the sample size in the real data.
A
uthor Man
uscr
ipt
A
uthor Man
uscr
ipt
A
uthor Man
uscr
ipt
A
uthor Man
uscr
Figure 3.
Sizes and powers for testing H0b with N = 1150 under different allocation rules.
A
uthor Man
uscr
ipt
A
uthor Man
uscr
ipt
A
uthor Man
uscr
ipt
A
uthor Man
uscr
Figure 4.
Histogram and normal Q–Q plot of .
A
uthor Man
uscr
ipt
A
uthor Man
uscr
ipt
A
uthor Man
uscr
ipt
A
uthor Man
uscr
A
uthor Man
uscr
ipt
A
uthor Man
uscr
ipt
A
uthor Man
uscr
ipt
A
uthor Man
uscr
T ab le 1A
uthor Man
uscr
ipt
A
uthor Man
uscr
ipt
A
uthor Man
uscr
ipt
A
uthor Man
uscr
ipt
Table 2
p-Values for testing H0b : P(βl ≤ M) = p.
M p p-value (MLE) p-value (REML)
0.151 0.50 0.019 0.021
0.70 0.246 0.273
0.75 0.371 0.406
0.80 0.516 0.556
0.85 0.666 0.706
0.90 0.803 0.835
0.201 0.50 0.006 0.007
0.70 0.135 0.155
0.75 0.229 0.259
0.80 0.357 0.397
0.85 0.513 0.558
0.90 0.681 0.725
0.251 0.50 0.002 0.002
0.70 0.068 0.081
0.75 0.130 0.153
0.80 0.228 0.262
0.85 0.367 0.412
0.90 0.545 0.595
0.301 0.50 0.001 0.001
0.70 0.032 0.040
0.75 0.069 0.084
0.80 0.135 0.162
0.85 0.246 0.285
0.90 0.411 0.462