www.atmos-chem-phys.net/16/10879/2016/ doi:10.5194/acp-16-10879-2016
© Author(s) 2016. CC Attribution 3.0 License.
Size-resolved aerosol composition at an urban and a rural site in the
Po Valley in summertime: implications for secondary aerosol
formation
Silvia Sandrini1, Dominik van Pinxteren2, Lara Giulianelli1, Hartmut Herrmann2, Laurent Poulain2, Maria Cristina Facchini1, Stefania Gilardoni1, Matteo Rinaldi1, Marco Paglione1, Barbara J. Turpin3, Francesca Pollini1, Silvia Bucci4,5, Nicola Zanca1, and Stefano Decesari1
1Institute for Atmospheric Sciences and Climate (ISAC), National Research Council (CNR), Bologna, 40129, Italy 2Leibniz-Institut für Troposphärenforschung (TROPOS), Leipzig, 04318, Germany
3Environmental Science and Engineering, Gillings School of Global Public Health, University of North Carolina at Chapel
Hill, NC 27599-7431, USA
4Institute for Atmospheric Sciences and Climate (ISAC), National Research Council (CNR), Rome, 00133, Italy 5Dept. of Physics, Ferrara University, Ferrara, 44121, Italy
Correspondence to:Silvia Sandrini ([email protected])
Received: 21 December 2015 – Published in Atmos. Chem. Phys. Discuss.: 1 March 2016 Revised: 20 July 2016 – Accepted: 22 July 2016 – Published: 1 September 2016
Abstract. The aerosol size-segregated chemical composi-tion was analyzed at an urban (Bologna) and a rural (San Pietro Capofiume) site in the Po Valley, Italy, during June and July 2012, by ion-chromatography (major water-soluble ions and organic acids) and evolved gas analysis (total and water-soluble carbon), to investigate sources and mecha-nisms of secondary aerosol formation during the summer. A significant enhancement of secondary organic and inor-ganic aerosol mass was observed under anticyclonic con-ditions with recirculation of planetary boundary layer air but with substantial differences between the urban and the rural site. The data analysis, including a principal compo-nent analysis (PCA) on the size-resolved dataset of chemi-cal concentrations, indicated that the photochemichemi-cal oxida-tion of inorganic and organic gaseous precursors was an im-portant mechanism of secondary aerosol formation at both sites. In addition, at the rural site a second formation pro-cess, explaining the largest fraction (22 %) of the total vari-ance, was active at nighttime, especially under stagnant con-ditions. Nocturnal chemistry in the rural Po Valley was as-sociated with the formation of ammonium nitrate in large accumulation-mode (0.42–1.2 µm) aerosols favored by lo-cal thermodynamic conditions (higher relative humidity and lower temperature compared to the urban site). Nocturnal concentrations of fine nitrate were, in fact, on average 5 times
1 Introduction
The knowledge of the size-segregated chemical composition of atmospheric aerosols, i.e., the chemical composition as a function of particle size, is key to the understanding of several important characteristics of particles such as opti-cal properties, hygroscopicity and reactivity, which affect the atmospheric radiation budget, cloud formation and human health. Moreover, the size distribution of inorganic and or-ganic components reflects their origin, and hence provides a wealth of information about aerosol formation mechanisms and atmospheric processing, including secondary formation (Seinfeld and Pandis, 1998).
Accumulation-mode particulate matter mostly originates from aerosol accretion via gas-to-particle conversion of oxidized vapors (Seinfeld and Pandis, 1998). However, accumulation-mode particles can be selectively scavenged by clouds and fogs which, in absence of precipitation, pro-duce chemically processed particles upon evaporation of wa-ter (Meng and Seinfeld, 1994). The resulting size distribu-tion is bimodal with the small mode accounting for sec-ondary aerosols produced uniquely by gas-to-particle conver-sion (“condensation mode”) and the large mode containing particles that underwent cloud processing (“droplet mode”) (Hering and Friedlander, 1982; John et al., 1990). There-fore, knowledge about the concentrations of aerosol organic and inorganic compounds in size-segregated aerosol sam-ples provides information on the nature of secondary forma-tion processes. Measurements of the size-segregated chem-ical composition of aerosols are traditionally performed us-ing multi-stage impactors followed by offline chemical anal-ysis. Recently, the development of online mass spectromet-ric techniques offered new opportunities for size-segregated chemical observations with a much greater time resolution with respect to impactors (Jimenez et al., 2003). However, aerosol mass spectrometers (AMSs) generally suffer from poor sensitivity for thermally refractory compounds and could not be deployed for the analysis of coarse particles (>2.5 µm) chemical composition. Therefore, multistage im-pactors are still unsurpassed in terms of the number of chemi-cal determinations that can be performed on the samples and the range of particle sizes that can be probed. An example of comparison of aerosol chemical measurements performed using a five-stage impactor and AMS is provided by our pre-vious study focusing on the 2009 field campaign in the Po Valley, Italy (Decesari et al., 2014).
The Po Valley is a region in Europe characterized by high levels of pollution due to the concurrent high density of anthropogenic sources and its orographic and meteorologi-cal characteristics particularly unfavorable for pollutant dis-persion. In particular, several studies have shown how this area is dominated by secondary material during the summer (Crosier et al., 2007), with a large presence of secondary in-organic aerosol (SIA). On an annual average, SIA accounts for 40 % of PM10mass at the urban site of Bologna (Matta et
al., 2003; Putaud et al., 2010) while a 50 % contribution has been evaluated at the rural site of San Pietro Capofiume over shorter observation periods during winter and summer (Car-bone et al., 2010). Crosier et al. (2007) observed that most of the time, during the summer, aerosol over the Po Valley was composed of regional ammonium sulfate and organic material, while under anticyclonic conditions, with recircu-lation of air over the region, the composition was dominated by ammonium nitrate close to ammonia emission sources.
The present study focuses on the chemical size-resolved composition of aerosol determined by two five-stage low-pressure Berner impactors during a field campaign per-formed in the summer 2012 in the Po Valley. With respect to the previous campaigns in this area, this is the first experi-ment where a two-site approach was used. One-month inten-sive observations were performed at an urban site (Bologna, BO) and at a nearby rural site (San Pietro Capofiume, SPC). The goal of this paper is to provide insights into factors controlling the variability of aerosol composition and to ex-plore possible formation pathways of secondary compounds in this region during the summer under different meteorolog-ical conditions and air-mass history. The two-site approach was adopted to estimate the contribution and composition of rural background particles with respect to the urban contri-bution, according to the Lenschow perspective (Lenschow et al., 2001), based on the assumption that PM concentration measured at an urban location is the result of the sum of re-gional background, urban contribution given by the sources inside the agglomeration and road traffic for roadside sites.
Source attribution was addressed through the analysis of the time series of the main aerosol species together with meteorological parameters and by the statistical approach of principal component analysis (PCA) applied to the different size classes as independent variables. The study also takes into account the comparison between an urban and a rural site to assess the impact of traffic and other urban sources on the regional background, to explore differences in sec-ondary aerosol formation resulting from different meteoro-logical conditions and to assess the regional and local vari-ability of secondary aerosol formation processes. Finally, the fact that sampling was performed separately during day and night allowed analysis of the concentrations of aerosol con-stituents together with the dynamics of the boundary layer (Gietl et al., 2008).
2 Experimental 2.1 Sampling sites
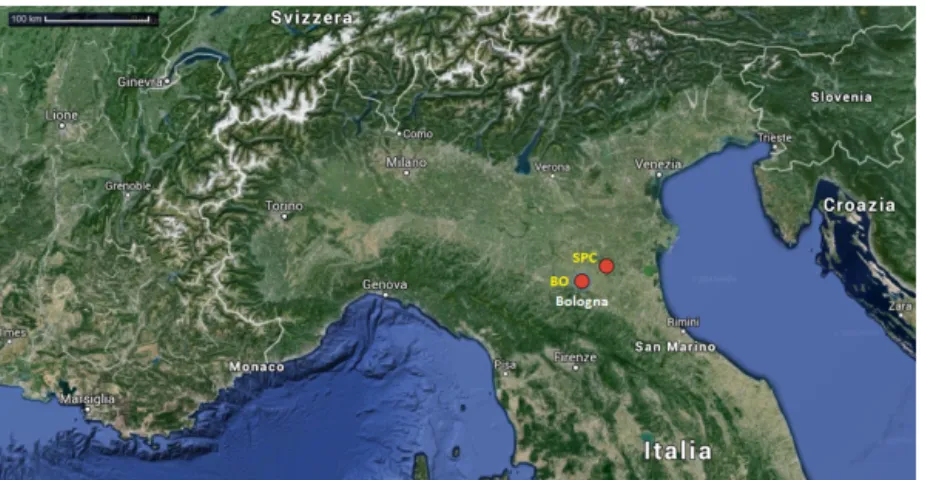
Bologna. Both sites are located in the eastern part of the Po Valley (Fig. 1). Bologna is a city of 400 000 inhabitants, the most populous in the southern Po Valley, with a surround-ing area characterized by widespread agricultural and in-dustrial activities and by the presence of several high-traffic roads. Sampling was performed in the northern outskirts of Bologna, on the roof of the Institute of Atmospheric Sciences and Climate of the National Research Council, at about 20 m above ground. San Pietro Capofiume is a rural site charac-terized by a flat terrain and by croplands extending in all directions and can be considered an ideal receptor site for regional-scale air pollution in the Po Valley. In SPC aerosol samplers were positioned on a platform at about 8 m above ground level.
The west–east orientation of the valley favors westerly or easterly circulations, hence from either the inner Po Valley (including Lombardy and Milan) or the Adriatic Sea. In the presence of SW winds, SPC can be located downwind of BO and an influence from the urban area cannot be excluded. Under the same conditions, a possible inflow of marine air from the Ligurian Sea is also possible.
2.2 Aerosol sampling
Two five-stage Berner impactors (flow rate 80 L min−1)with 50 % particle cut points at 0.14, 0.42, 1.2, 3.5 and 10 µm aerodynamic diameter (Dp) were used at the two sites. The particles were collected on aluminium and Tedlar foils. Alu-minium foils for carbonaceous aerosol analysis were placed on each stage of the impactor with Tedlar half foils for ion-chromatographic analysis placed on top of them, covering 50 % of the aluminium substrates (Matta et al., 2003). A 12 h time resolution was adopted for sampling: one nighttime and one daytime sample collected every day from 21:00 to 09:00 LT and from 09:00 to 21:00 LT respectively. However, it is worth noting that nocturnal sampling actually included several hours of light: from dawn (which in this period of the year occurs at approximately 05:30) to 09:00.
In order to evaluate the presence of sampling artifacts in the Berner impactor sampling, the size-integrated (PM1.2,
sum of the first three stages) impactor concentrations for sul-fate, nitrate and ammonium were compared with those ob-tained by another offline system, a high-volume Digitel PM1
sampler, and by integrated HR-ToF-AMS (PM<1) measure-ments. See Sect. S1 in the Supplement for a detailed discus-sion.
2.3 Analytical measurements
The Tedlar substrates were extracted in 10 mL of mQ wa-ter for 30 min in an ultrasonic bath. The extracts were ana-lyzed by ion chromatography for the quantification of water-soluble inorganic species and organic acids (acetate, for-mate, methanesulfonate (MSA), oxalate). A TOC analyzer (Shimadzu, Japan) was used for the determination of
water-soluble organic carbon (WSOC). An aliquot of each sample was analyzed for total carbon (TC) by combustion at 680◦C in the presence of a catalyst, while another aliquot was acid-ified in a reaction vessel to determine IC, which was decom-posed to CO2. In both cases the evolved CO2was measured
by a nondispersive infrared gas analyzer (NDIR) and the or-ganic fraction (WSOC) was obtained by difference between TC and IC.
Fractions of the aluminium foils were used for the quantifi-cation of TC by evolved gas analysis with a Multi N/C2100 analyzer (Analytik Jena, Germany) equipped with a module for solid samples. Portions of the aluminium foils were ex-posed to increasing temperature (up to 950◦C) in pure oxy-gen carrier gas. Under these conditions all carbonaceous mat-ter (organic, carbonate and elemental carbon, EC) is con-verted to CO2(Gelencser et al., 2000) and TC is measured
as total evolved CO2by an NDIR analyzer.
Aluminium foils in SPC were also used for the gravimet-ric determination of aerosol mass by weighing the substrates before and after sampling on a UMT-2 microbalance with a reading precision of 0.1 µg and a standard deviation of ca. 1 %.
2.4 Back-trajectory calculation
Figure 1.Location of the sampling sites in the Po Valley.
2.5 Aerosol liquid water content (ALWC) calculation Hourly ALWC was calculated by the online version of the Extended Aerosol Inorganic Model III (E-AIM, http://www. aim.env.uea.ac.uk/aim/aim.php; Clegg et al., 1998; Wexler and Clegg, 2002). The inorganic concentrations for sulfate, ammonium, nitrate and chloride measured by two HR-ToF-AMSs, placed in BO and in SPC during the campaign, were used as inputs in conjunction with RH, while temperature was kept fixed at 298.15 K by this model. Sodium was not measured by AMS and it is here ignored in the calculation. Sodium represents only 2 % of the total equivalents of to-tal ionic species used as inputs of E-AIM, on the basis of the impactor composition. The size-segregated concentrations of the inorganic components collected by the Berner impactors could not be used for this purpose due to their low tempo-ral resolution (12 h), resulting in a flattening of RH values averaged over the sampling time, which prevented accurate calculation of ALWC on particles. Particulate water retained by polar organic matter was neglected in the calculations, be-cause the inclusion of ionic organic compounds (oxalic, glu-taric and maleic carboxylic acids) had been shown to play only a minor role in water uptake during the campaign (Ho-das et al., 2014). The formation of solids was allowed in the model because in the absence of hygroscopicity mea-surements it was not possible to know whether aerosols ef-floresced or not in this environment. The ALWC calculated from AMS relates to the fine fraction (<1 µm diameter) of aerosol.
2.6 Principal component analysis
Source categories for the five impactor size intervals of par-ticulate matter were studied by means of PCA using the XLStat software (Addinsoft, version 2013.2.04). Besides the concentrations of particle constituents chloride, sulfate, ni-trate, sodium, ammonium, magnesium, calcium and WSOC, the database for PCA also included the modeled
meteorolog-ical parameters from the HYSPLIT model listed in the previ-ous section, the measured meteorological parameters temper-ature and relative humidity (RH) and the modeled residence times from GIS analysis.
The values below detection limits were replaced by half the respective value of detection limit (Farnham et al., 2002) in the final dataset.
Since a prerequisite of PCA is the normal distribution of the variables used in the analysis, the normal distribution of concentration data has been checked by the Shapiro–Wilk normality test. Data that were not normally distributed were log-10 transformed before the analysis.
The orthogonal transformation method with Varimax rota-tion of principal components was applied to redistribute the variance in order to generate more interpretable factor load-ings and scores (Vandeginste, 1998). As there are no defined criteria for the number of factors which are used in the Vari-max rotation, we performed several PCAs with varying num-bers of rotated factors (4–9) and judged the interpretability of the results by trying to assign a physical meaning to the ex-tracted factors. The number of rotated factors was regarded as too high if factors showed very low contribution to the overall variance and no distinct physical meaning. Contrar-ily the number was regarded too low if previously resolved sources were now folded into one principal component. The most reasonable results were obtained by rotating the first six factors.
3 Results
3.1 Back-trajectory patterns
sam-pling sites at night and in the morning hours, while short, intense easterly breezes dominated during the late afternoon (Fig. 2 in Wolf et al., 2015). However, in days of stronger synoptic forcing, a wind pattern characterized by strong east-erly winds, persisting all day, was observed (especially in the second half of June), while a wind pattern characterized by SW winds from the Apennines was also common in June and accounted for most of the days in July until the end of the campaign. An overview of the main air-mass transport pat-terns intersecting the area during the campaign, from back-trajectory analysis, is reported in a parallel paper (Decesari et al., 2016). A hierarchical cluster analysis (Dorling et al., 1992) of the obtained back trajectories was performed to re-duce the number of “origins of air masses”, appointing every calculated individual back trajectory to the most appropriate cluster, roughly corresponding to a specific synoptic situa-tion. At each step of the process, the appropriate number of clusters was selected by looking at the variations of the total spatial variance (TSV – defined as the sum of the squared dis-tances between the endpoints of the single trajectory and the mean of the trajectories in that cluster). The optimum number of clusters was selected in correspondence with the number after which the TSV did not vary substantially. The analysis led to identification of five main patterns affecting the Po Val-ley during the experimental campaign. A map with the mean trajectories for each cluster and the corresponding percent-age of occurrence for trajectories calculated over 96 h and arriving at 500 m a.g.l. is shown in Fig. 2.
Clusters 1 and 3, defined, respectively, as “WEST low” and “EAST low” according to their low traveling altitude (below 1000 m a.g.l.) and prevalent direction, were character-ized by short trajectory lengths and corresponded to a higher residence time of air masses in the basin. Cluster 1, in partic-ular, had the highest occurrence and accounted for 38 % of the total trajectories. Both included a smaller number of very short trajectories which were defined as “WEST-low local“ and “EAST-low local“, occurring during the days character-ized by stagnant conditions and low wind speed, and were associated with the accumulation of pollutants.
Under stagnant conditions weak winds were accompanied by a shallower boundary layer, as observed from lidar mea-surements and from radiosoundings in SPC (see Supplement, Fig. S1). The planetary boundary layer (PBL) was around 1000 m or lower at noon under stagnant conditions, com-pared to 1600–1700 m observed during other periods of the campaign at the same hour of the day.
3.2 Bulk PM10aerosol composition
The size cut between fine and coarse particles in the Berner impactor size distributions is set to a 1.2 µm aerodynamic diameter (i.e., the size cut between the third and the fourth impactor stage); therefore in this study PM1.2and PM1.2−10
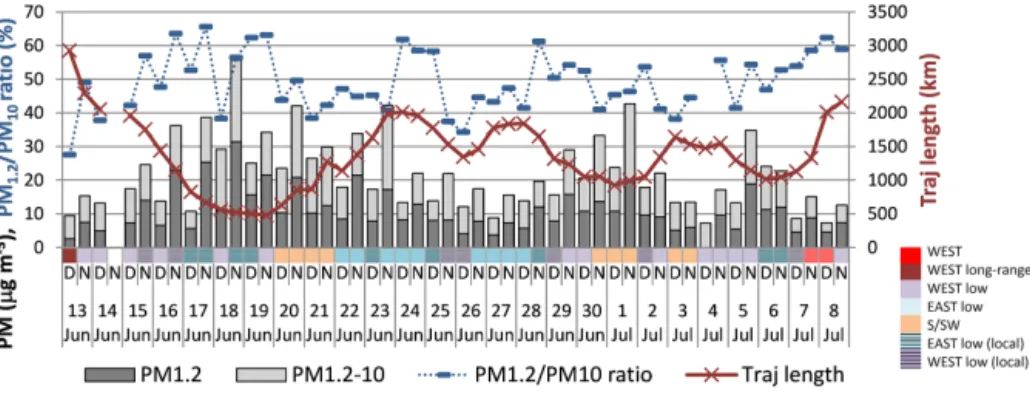
represent the fine and the coarse aerosol fractions respec-tively. Figure 3 shows the time series of PM1.2and PM1.2−10
Figure 2.Map with average trajectories for each obtained clus-ter with, in brackets, corresponding percentage of occurrence. The numbers outside the brackets identify each cluster. Figure refers to 96 h trajectories arriving at 500 m a.g.l.
mass concentrations and of the contribution of PM1.2on
to-tal PM10 for the rural site SPC, together with air-mass
cate-gories and back-trajectory length. The aerosol mass was not available for BO. Air-mass categories indicate the prevalent direction of air masses during each sampling day.
During the campaign, the days showing the lowest aerosol mass concentrations were characterized by the longest tra-jectories, which corresponded to air masses transported over long range from the North Atlantic Ocean (WEST) at the be-ginning and at the end of the sampling period. The aerosol mass increased from 15 to 18 June, with an enhanced contri-bution of the PM1.2fraction to the total PM10, together with a
sharp decrease of the trajectories length, following the onset of an anticyclonic period with low wind and air stagnation over the Po Valley. An episode of Saharan dust transport was observed during a period of air transport from south, starting on 19 June at 5 km height with maximum on 20 June when it reached the PBL, resulting in an increase of PM10mass at
ground level (Bucci et al., 2016). The highest contributions of PM1.2 to PM10 were observed most of the times when
4-day trajectories were very short (<1500 km). During the first, persistent stagnation period, lasting from 16 to 19 June, the PM1.2contribution to PM10 was the highest, with
max-ima during the night, peaking at 67 % of total PM10mass on
17 June.
Figure 3.Time series of PM1.2and PM10mass concentrations (in µg m−3) and of the PM1.2to PM10ratio (%) for SPC. Four-day (96 h)
back-trajectory length (km) is plotted superimposed to the graph, while air-mass classification (in colors) is reported on top of it. The samples are labeled according to collection starting date, with “D” and “N” denoting, respectively, daytime and nighttime samples.
Table 1.Fine (PM1.2), coarse (PM1.2−10) and PM10mean concentrations (in µg m−3, from integrated impactor mass size distributions) for
main inorganic ions, water-soluble organic carbon (WSOC) and total carbon (TC) separately for day (D) and night (N) samples during the PEGASOS summer campaign.
PM1.2 PM1.2−10 PM10
BO (urban) SPC (rural) BO (urban) SPC (rural) BO (urban) SPC (rural)
D N D N D N D N D N D N
Sulfate 2.1 2.6 1.7 2.3 0.27 0.32 0.16 0.28 2.3 2.8 1.8 2.6
Nitrate 0.24 0.47 0.32 2.4 1.6 1.7 0.85 1.5 1.8 2.1 1.2 3.9
Chloride 0.023 0.043 0.0047 0.041 0.17 0.27 0.053 0.14 0.13 0.27 0.058 0.19
Ammonium 0.83 1.1 0.69 1.5 0.055 0.068 0.021 0.15 0.88 1.1 0.69 1.6
Magnesium 0.0077 0.0089 0.0070 0.0064 0.069 0.073 0.038 0.045 0.066 0.081 0.045 0.051
Calcium 0.073 0.067 0.064 0.073 0.50 0.48 0.35 0.41 0.56 0.53 0.40 0.47
Sodium 0.040 0.051 0.026 0.021 0.37 0.48 0.20 0.22 0.41 0.53 0.23 0.24
WSOC 1.4 1.9 0.94 1.6 0.54 0.53 0.28 0.44 1.9 2.4 1.2 2.1
TC 2.5 3.5 1.3 2.2 1.5 1.5 0.8 1.4 4.1 5.2 2.1 3.5
and for day and night samples. All the chemical species con-centrations were higher at the urban compared to the rural site but with small differences in most of the cases. The sig-nificantly higher concentrations of fine TC in BO can result from a higher contribution of EC and organic carbon (OC) from vehicular traffic at the urban site. Coarse-mode Mg2+ and Ca2+ also occurred at higher concentrations at the ur-ban site, suggesting a source from road dust resuspension for these mineral elements. The only exception was represented by the nocturnal concentrations of fine-mode nitrate, on av-erage 5 times higher at SPC compared to BO, and so for the counter-ion ammonium.
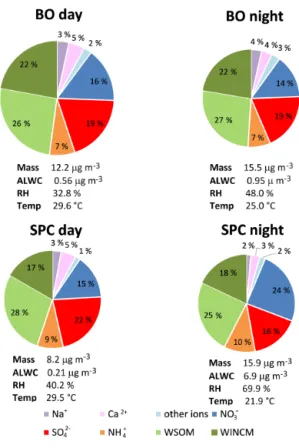
The concentrations of many species were higher at night compared to daytime (Table 1). The nocturnal enhancement can be due either to the accumulation of pollutants in a shal-low boundary layer or to enhanced formation/emission of specific aerosol species at nighttime. Figure 4 shows the av-erage PM10 composition at the urban and at the rural site
separately for day and night, with indication of the percent-age contributions of each species on the total mass of the measured compounds. The change in PM10 chemical
com-position between day and night at the rural site indicates that the enhanced mean concentrations found at night were not purely an effect of atmospheric dynamics but were im-pacted by chemical processes that led to the formation of spe-cific aerosol compounds, especially ammonium nitrate, in the dark hours of the day. The lower average nocturnal tempera-tures (22◦C vs. 25◦C) and the higher average nocturnal RH (70 % vs. 48 %) of SPC with respect to BO probably played an important role.
Figure 4.Average day and night PM10composition at BO and SPC
during the campaign. “Other ions” include chloride, nitrite, potas-sium and magnepotas-sium. WSOM stands for water-soluble organic mat-ter, while WINCM for water-insoluble carbonaceous matter. Aver-age mass, ALWC, RH and temperature are indicated below each pie. The size of each pie chart is proportional to the total measured mass reported.
was multiplied by 1.2 as found in the literature (Zappoli et al., 1999).
The total mass concentration of the chemical species deter-mined on impactor samples averaged 12.2 µg m−3at the ur-ban and 8.2 µg m−3at the rural site during daytime and 15.1 and 15.9 at nighttime respectively. It is interesting to note that in daytime the aerosol loading was higher at the urban compared to the rural site, indicating a higher contribution from urban sources, though the chemical composition was to some extent homogeneous. By contrast, at night the aerosol mass was similar at the two sites but the chemical composi-tion was different, with an enrichment of ammonium nitrate at the rural site, probably also favored by the high ammonia concentrations from agricultural sources, which during the campaign were only observed at the rural site and not in BO (Sullivan et al., 2015).
The measured mass of PM10at the urban site consisted on
average of 42 and 40 % SIA in daytime and nighttime respec-tively. At the rural site, SIA represented 46 % in daytime and 50 % at night due to a higher contribution from fine-mode ammonium nitrate. Carbonaceous matter was the dominant fraction at the urban site with 48 and 49 % of the measured
mass in daytime and nighttime, respectively, and with the sol-uble fraction accounting for 26 and 27 % of the mass in the two cases.
Finally, it is worth reminding that the above results are sensitive to sampling artifacts which can affect aerosol col-lection with low-pressure impactors (e.g., evaporative losses of semivolatile compounds). Figures S8 and S9 report the comparison between SIA measurements with the Berner im-pactor at SPC and co-located measurements using a differ-ent offline system (a HiVol sampler) and an online method (HR-ToF-AMS). The results show that the Berner impactor observations are generally in line with the parallel measure-ments and especially that the main features of the time trend (e.g., the sharp diurnal variations in nitrate concentrations) are reproduced by all the instruments.
3.3 Size-resolved aerosol composition
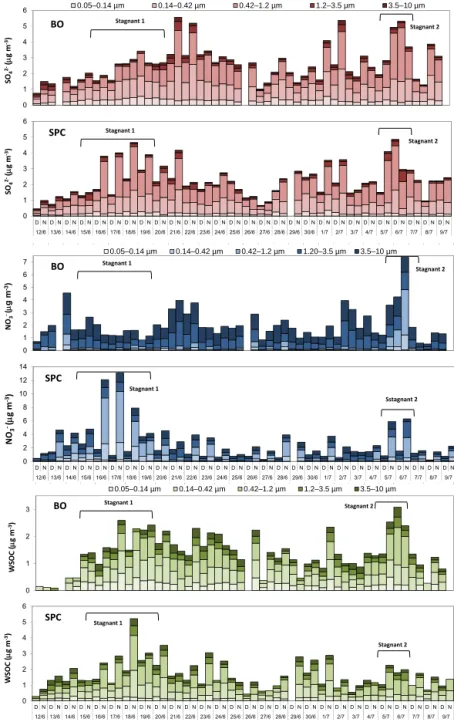
The time series of size-resolved sulfate, nitrate and WSOC concentrations are shown in Fig. 5 (similar plots for addi-tional chemical components and RH are reported in the Sup-plement, Figs. S2–S8). The figure highlights significant dif-ferences between the urban and the rural site in the formation of secondary inorganic and organic aerosol, especially during the two periods of stagnant conditions, i.e., 16–19 June and 5–7 July, which favored the accumulation of aerosol com-pounds from local sources. During the first of such events, the sulfate concentrations increased in BO and SPC to a similar extent in daytime, while higher concentrations were measured in SPC at night. Fine-mode nitrate, consisting pri-marily in ammonium nitrate, was virtually absent during the day throughout the campaign, particularly in BO, as a con-sequence of the high summer temperatures, which favored the thermal decomposition of NH4NO3 into gas-phase
am-monia and nitric acid. Higher fine-mode nitrate concentra-tions were instead measured in SPC, reaching high levels at night. For both sulfate and nitrate the most prominent en-hancements affected the accumulation mode, i.e., size bins 2 (0.14–0.42 µm) and especially 3 (0.42–1.2 µm) of the im-pactor, which correspond to small and large accumulation mode.
Aerosol WSOC exhibited higher concentrations under stagnant conditions, similarly to SIAs. During the first stag-nation event, in particular, higher nocturnal concentrations in the accumulation mode were measured in SPC compared to BO (Fig. 5). Conversely, WSOC concentrations were in general higher in BO than in SPC in the quasi-ultrafine (0.05–0.14 µm) fraction, with an average concentration of 0.39 µg m−3(17 % of total WSOC in the PM10fraction)
com-pared to 0.19 µg m−3(11 % of total WSOC in PM10). Since
0 1 2 3 4 5 6
SO
4
2‐
(
g
m
‐3)
0.05–0.14 µm 0.14–0.42 µm 0.42–1.2 µm 1.2–3.5 µm 3.5–10 µm
BO Stagnant 1
Stagnant 2
0 1 2 3 4 5 6
D N D N D N D N D N D N D N D N D N D N D N D N D N D N D N D N D N D N D N D N D N D N D N D N D N D N D N D N 12/6 13/6 14/6 15/6 16/6 17/6 18/6 19/6 20/6 21/6 22/6 23/6 24/6 25/6 26/6 27/6 28/6 29/6 30/6 1/7 2/7 3/7 4/7 5/7 6/7 7/7 8/7 9/7
SO
4
2‐(
g
m
‐3)
SPC Stagnant 1
Stagnant 2
0 1 2 3 4 5 6 7
NO
3
‐(
g
m
-3)
0.05–0.14 µm 0.14–0.42 µm 0.42–1.2 µm 1.20–3.5 µm 3.5–10 µm
BO Stagnant 1 Stagnant 2
BO
0 2 4 6 8 10 12 14
D N D N D N D N D N D N D N D N D N D N D N D N D N D N D N D N D N D N D N D N D N D N D N D N D N D N D N D N 12/6 13/6 14/6 15/6 16/6 17/6 18/6 19/6 20/6 21/6 22/6 23/6 24/6 25/6 26/6 27/6 28/6 29/6 30/6 1/7 2/7 3/7 4/7 5/7 6/7 7/7 8/7 9/7
NO
3
‐(
g
m
‐3)
SPC SPC
Sstagnant 2
SPC
Stagnant 1
0 1 2 3
WS
O
C
(
g
m
‐3)
0.05–0.14 µm 0.14–0.42 µm 0.42–1.2 µm 1.2–3.5 µm 3.5–10 µm Stagnant 1
Stagnant 2
BO
0 1 2 3 4 5 6
D N D N D N D N D N D N D N D N D N D N D N D N D N D N D N D N D N D N D N D N D N D N D N D N D N D N D N D N 12/6 13/6 14/6 15/6 16/6 17/6 18/6 19/6 20/6 21/6 22/6 23/6 24/6 25/6 26/6 27/6 28/6 29/6 30/61/7 2/7 3/7 4/7 5/7 6/7 7/7 8/7 9/7
WS
O
C
(
g
m
‐3)
SPC Stagnant 1
Stagnant 2
Figure 5.Time series of sulfate, nitrate and WSOC size-segregated concentrations in BO and SPC. Please note the different scale for nitrate and WSOC in BO.
small particles found at the urban site. In addition to freshly nucleated particles, in fact, this aerosol fraction, twice as high in number at urban sites compared to rural areas (Westerdahl et al., 2005), includes particles released by anthropogenic sources such as combustion emissions from vehicular traffic. In addition, this quasi-ultrafine mode excess of WSOC mass could also reflect a direct contribution from anthropogenic primary emissions (Zhang et al., 2012).
On 5 and 6 July, the Po Valley was again influenced by stagnant conditions, with low wind speeds and short air-mass trajectories. However, the stagnation event in early July was
considerably shorter than that of 16–19 June. During such event, high concentrations of fine-mode sulfate were simulta-neously observed in BO and SPC, with the 6 July experienc-ing the highest diurnal concentration of the whole campaign (4.9 µg m−3in PM10 in BO). Nitrate similarly increased at
both sites at night, persisting in daytime in BO only and reaching the diurnal maximum of 4.2 µg m−3on PM10.
re-spectively, averaged over the time span of Berner impactor samplings) and a relatively lower temperature (27◦C at both sites). Clouds were present on the sampling sites and a light rain was recorded in the afternoon. Such conditions appar-ently favored the formation of secondary organic (WSOC) and inorganic aerosol compounds in the Po Valley basin.
Figure 6 shows the size-segregated concentrations of sul-fate, nitrate, ammonium and WSOC during one day charac-terized by background conditions (15 June) and one day char-acterized by stagnant conditions (18 June), separately for di-urnal and noctdi-urnal hours. On the background day (panels a and c), fine particles in BO exhibited a maximum in the spe-ciated aerosol mass in the small accumulation mode (0.14– 0.42 µm), with a relative increase in the large accumulation mode (0.42–1.2 µm) at night. The speciated aerosol mass in SPC was almost evenly distributed between the two modes at night and during the day. Nitrate was always present in the coarse mode, where nonvolatile nitrate salts can form through reaction of gaseous nitric acid with alkaline soil par-ticles or resuspended dust (Harrison and Pio, 1983; Laskin et al., 2005). Under stagnant conditions (panels b and d) the speciated particle mass concentrations increased but the peak in the size distribution, which for BO was again ob-served in the small accumulation mode, shifted to the large accumulation mode in SPC both in daytime and at night. The nocturnal increase of large accumulation-mode partic-ulate matter concentration was much more evident at the ru-ral site (SPC) than at the urban site (BO), mostly because of an increase of ammonium nitrate (showing more than 3 times higher concentrations with respect to background con-ditions) but also accompanied by increases in WSOC and sulfate concentrations. The SIA mass (i.e., the sum of sul-fate, nitrate and ammonium) reached 67 % of the total PM1.2
mass in the night of 16 June, during the first event of stagna-tion. The increase of SIA (and, to a lesser extent, of WSOC) in large accumulation-mode aerosols under stagnant condi-tions was therefore the main process modulating the impactor size distribution of submicron aerosol during the experiment. Our data seem to exclude that this shift in diameter of SIA-containing aerosols from the small to the large accumulation-mode size range is due to impactor sampling artifacts (see Sect. S1 in the Supplement, Fig. S11).
3.4 Secondary aerosol formation under stagnant conditions
3.4.1 Secondary inorganic components
The processes responsible for the accumulation of sulfate, nitrate and secondary organic aerosol (SOA) on stagnation days were further investigated by analyzing the relationship between the (size-segregated) concentrations of secondary inorganic compounds and RH, as well as with ALWC. SPC was characterized by higher levels of RH than Bologna, es-pecially at night. During the campaign RH and temperature
profiles at the two sites showed substantial day–night vari-ations as a consequence of diabatic processes at the surface (nocturnal radiative cooling vs. daytime heating from solar irradiation). As a consequence, the highest RH occurred at both sites just before dawn, from 04:00 to 05:00, and the low-est in the afternoon from 13:00 to 15:00. During the diurnal sampling periods (from 09:00 to 21:00) hourly RH ranged from 15 to 66 % in BO and from 19 to 73 % in SPC, while during the nocturnal sampling periods (from 21:00 to 09:00) RH ranged from 24 to 82 % in BO and from 35 to 92 % in SPC. A plot of RH averaged on the time intervals of the Berner impactor is reported in the Supplement (Fig. S8).
Since the equilibrium constant for the reaction of NH4NO3
formation is both RH and temperature dependent (Stelson and Seinfeld, 1982), thermodynamic conditions were more favorable in SPC than in BO for the existence of condensed-phase nitrate. Both temperature and RH affect the equi-librium of NH4NO3, but the changes in RH were more
marked. During the campaign the hourly nocturnal tem-peratures and corresponding relative humidity of deliques-cence (RHD) for ammonium nitrate and ammonium sul-fate (in brackets) ranged from 12◦C (69.3 % for ammo-nium nitrate and 80.7 % for ammoammo-nium sulfate) to 30◦C (58.6 % for ammonium nitrate and 79.5 for ammonium sul-fate) in SPC and from 16◦C (67.1 % for ammonium nitrate and 80.3 for ammonium sulfate) to 30◦C in BO (Watson et al., 1994; E-AIM model, http://www.aim.env.uea.ac.uk/aim/ model2/mod2rhw.php). Nocturnal periods of time with RH greater than the RHD of hygroscopic salts were consider-ably longer in SPC than in BO, and therefore deliquesced particles were common at the rural and very rare at the ur-ban site. This was confirmed by the simultaneous enhance-ments of the ALWC, calculated from hourly averaged AMS data at the two sites (see the experimental section) by the E-AIM model (Fig. 7). While the ALWC in SPC showed a con-sistent average diurnal trend, with a maximum before dawn when both RH and the concentrations of hygroscopic salts were the highest (Hodas et al., 2014), the diurnal variation in Bologna was less marked, and nighttime ALWC concen-trations were 1 order of magnitude smaller than at the rural station (Fig. 7). Considering the Berner impactor sampling periods, ALWC averaged 0.33 µg m−3 in daytime in BO (min 0, max 11.2 µg m−3)and 0.76 µg m−3at night (min 0, max 16.6 µg m−3), while in SPC it averaged 0.21 µg m−3 during day (min 0, max 10.4 µg m−3)and 6.55 µg m−3 dur-ing night conditions (min 0, max 59.3 µg m−3). The 12 h av-eraged ALWC data show concentrations increasing rapidly for RH above 60 % (Fig. 8). There is a considerable variabil-ity in ALWC levels that must be attributed to the availabilvariabil-ity of hygroscopic material in the aerosol, as particulate water in subsaturated condition is a function not only of RH but also of the molar concentration of dissolved material in the aerosol.
accumula-8 6 4 2 0 dC/dlo gDp ( g m -3 ) 6 8 102
2 4 6 8
103
2 4 6 8
104
Diameter of particle (m)
SO4 NO3 NH4 + WSOC
BO day 15/6 8
6 4 2 0 dC/dlo gDp ( g m -3) 6 8 102
2 4 6 8
103
2 4 6 8
104
Diameter of particle (m)
BO day
stagnation 18/6 SO4
NO3 NH4 + WSOC 8 6 4 2 0 dC/dlogDp ( g m -3) 6 8 102
2 4 6 8
103
2 4 6 8
104
Diameter of particle (m)
SO4 NO3 NH4 + WSOC BO night stagnation 18/6 8 6 4 2 0 dC/dlogDp ( g m -3) 6 8 102
2 4 6 8
103
2 4 6 8
104
Diameter of particle (m)
BO night 15/6 SO4
NO3 NH4 + WSOC 8 6 4 2 0 dC/dlo gDp ( g m -3) 6 8 102
2 4 6 8
103
2 4 6 8
104
Diameter of particle (m)
SO4
NO3
NH4 +
WSOC SPC day 15/6
20 15 10 5 0 dC/dlo gDp ( g m -3) 6 8 102
2 4 6 8
103
2 4 6 8
104 Diameter of particle (nm) SPC night 15/6
SO4 NO3 NH4 + WSOC 20 15 10 5 0 dC/dlogDp ( g m -3) 6 102
2 4 6
103
2 4 6
104 Diameter of particle (nm) SPC night stagnation 18/6 SO4 NO3 NH4 + WSOC 8 6 4 2 0 d C /d log D p ( g m -3 ) 6 8 102
2 4 6 8
103
2 4 6 8
104
Diameter of particle (m)
SPC day
stagnation 18/6 SO4
NO3 NH4 + WSOC
Figure 6.Size-resolved aerosol composition for BO and SPC during day (top) and night (bottom), respectively, during one day characterized by background conditions (15/6) and during one day under stagnant conditions (18/6) (notice the different scale for concentrations in the bottom right panel).
0 10 20 30 40 50 60 70 80 90 0 10 20 30 40 50 60
1 2 3 4 5 6 7 8 9 10 11 12 13 14 15 16 17 18 19 20 21 22 23 24
RH % AL W C ( g m ‐3) Time (LT) SPC 0 10 20 30 40 50 60 70 80 90 0 2 4 6 8 10 12 14 16 18
1 2 3 4 5 6 7 8 9 10 11 12 13 14 15 16 17 18 19 20 21 22 23 24
R H % AL W C ( g m ‐3) q1 Min Median Max q3 RH% BO
Figure 7.Box plot of average diurnal variation of aerosol liquid wa-ter content (ALWC) with superimposed diurnal variation of relative humidity (RH) during the campaign. Please note the different scale of ALWC at the two sites. The labels q1 and q3 in the box plot, respectively, denote the first and the third quartiles.
tion mode (condensation mode) and in the large accumula-tion mode (droplet mode) vs. ALWC for the two sites. The correlation between particulate nitrate and ALWC was strong
for both modes in SPC where ALWC levels above 1 µg m−3 were frequent.
Our data are in agreement with the findings of Hodas et al. (2014), indicating that particulate nitrate was the primary driver of ALWC observed at night in the rural Po Valley in summertime. The same study suggested that ALWC en-hanced the particle-phase partitioning of water-soluble ganic gases and provided a medium for aqueous-phase or-ganic reactions that can form SOA. More generally, ALWC can favor – and sometimes can be necessary for – the forma-tion of SOA and SIA in large accumulaforma-tion-mode aerosols (the droplet mode). Figure 8c shows that no relationship was observed between sulfate and the local estimates of ALWC at either site, with the exception of a moderate positive correla-tion for the droplet mode in SPC but not in BO. These results indicate that most sulfate was formed at the regional scale during this study (through cloud chemistry in the larger ac-cumulation mode or gas-phase chemistry in the smaller accu-mulation mode). However, a small but nonzero increment of droplet-mode sulfate concentration in SPC can be attributed to the greater ALWC characterizing the rural site with respect to the urban site.
1.E‐04 1.E‐03 1.E‐02 1.E‐01 1.E+00 1.E+01 1.E+02
10 100
AL
W
C
(
g
m
‐3)
RH%
BO
SPC
0.01 0.10 1.00 10.00
0.0001 0.001 0.01 0.1 1 10 100
Nitr
at
e‐C
D
(
g
m
‐3)
ALWC (g m‐3)
0.1 1.0 10.0
0.0001 0.001 0.01 0.1 1 10 100
Sulf
at
e‐
CD
g
m
‐3)
ALWC (g m‐3)
0.1 1.0 10.0
0.0001 0.001 0.01 0.1 1 10 100
WSO
C
‐C
D
(
g
m
‐3)
ALWC (g m‐3)
0.0 0.1 1.0 10.0
0.0001 0.001 0.01 0.1 1 10 100
Nitr
at
e‐DL (
g
m
‐3)
ALWC (g m‐3)
0.1 1.0 10.0
0.0001 0.001 0.01 0.1 1 10 100
Sulf
at
e‐DL
g
m
‐3)
ALWC (g m‐3)
0.1 1.0 10.0
0.0001 0.001 0.01 0.1 1 10 100
WSOC‐DL (
g
m
‐3)
ALWC (g m‐3)
(a)
(b)
(c)
(d)
Figure 8.Relationship between ALWC and RH %(a); relationship between nitrate(b), sulfate(c)and WSOC(d)in the condensation (CD, left panel) and in the droplet (DL, right panel) mode of particles and ALWC averaged over the sampling periods of the Berner impactors.
2009; Schaap et al., 2004). We do not consider here the effect of the different distribution of gaseous precursors of ammo-nium nitrate in the Po Valley, especially of ammonia, which is enriched in the rural areas (Sullivan et al., 2016), which will be object of a future study.
3.4.2 Carbonaceous species
The distribution of the carbonaceous components of aerosol (WSOC, WINC=TC−WSOC) over the Berner impactor size intervals, with emphasis on accumulation-mode parti-cles (condensation and droplet modes), is hereby discussed. The dependence of WSOC on ALWC is also investigated analogously to the case of SIA treated in the previous sec-tion.
PM10 WSOC concentrations in this study ranged from
0.13 to 4.6 µg C m−3(average: 2.1 µg C m−3)in BO and from
0.28 to 5.2 µg C m−3(average: 1.6 µg C m−3)in SPC. On av-erage, 79 and 77 % of this PM10WSOC concentration was in
the fine (PM1.2)fraction in BO and SPC, respectively, with
only slightly higher contributions at night than in daytime at both sites.
The water-soluble fraction of total carbon (WSOC / TC) in PM1.2 was 52 % on average in BO and 61 % in SPC. The
WSOC fraction in SPC was comparable to what observed at other rural sites, e.g., 57 % in PM1in K-puszta (Hungary)
during the summer (Krivacsy et al., 2001). The greater water-soluble fraction of carbon found at SPC with respect to BO is in line with literature results, showing higher WSOC frac-tions in rural areas as a consequence of the concurrent higher input of SOA and the reduced fraction of insoluble carbona-ceous particles from traffic sources (Weber et al., 2007).
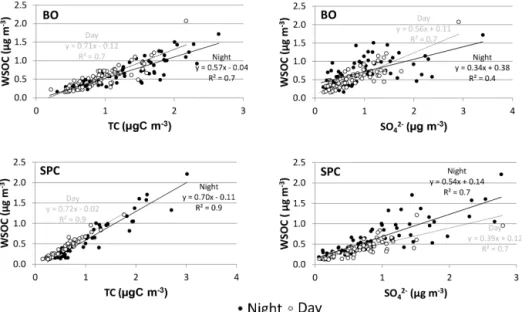
Figure 9.Linear regressions between WSOC and TC (left) and WSOC and SO24−(right) in the size intervals: (1) 0.05–0.14 µm, (2) 0.14– 0.42 µm and (3) 0.42–1.2 µm in daytime and at night for BO (top) and SPC (bottom).
at night in SPC and in similar proportions between WSOC and WINC, thus producing an aerosol with different charac-teristics in SPC with respect to BO.
The correlation of WSOC with a nonvolatile SIA compo-nent (sulfate) in PM1.2is shown in the right panels of Fig. 9.
A good correlation (R2=0.7) was observed at both stations in daytime, suggesting that WSOC shared a photochemi-cal source with sulfate. The correlation in BO was much smaller at nighttime (R2=0.4) than in daytime, which is ex-pected because particulate organic compounds have multiple sources other than photochemistry. Interestingly, the correla-tion between WSOC and sulfate remained high (0.7) at night in SPC, pointing to a common nocturnal source for WSOC and sulfate at the rural site.
Figure 10 shows, for the two sites, the size-resolved concentration time series of WSOC and WINC for quasi-ultrafine mode (0.05–0.14 µm), condensation-mode (0.14– 0.42 µm) and droplet-mode (0.42–1.2 µm) particles. The quasi-ultrafine fraction provided the smallest contribution to aerosol mass, but with significantly higher concentrations at the urban compared to the rural site for both WSOC and WINC. This feature was observed also in previous studies (Sardar et al., 2005; Snyder et al., 2010; Zhang et al., 2012). The urban excess of WINC witnesses the effect of local emis-sions of insoluble primary carbonaceous particles. On aver-age, WSOC accounted for 52 % of quasi-ultrafine TC in SPC and only 42 % in BO, with the lower WSOC fraction at the urban site caused by the higher concentrations of WINC. An urban increment for WSOC in quasi-ultrafine particles can be observed, although smaller than for WINC, and can be ex-plained by local sources of fresh SOA and by condensation on a greater number of ultrafine particles. WINC in this size
range displayed nocturnal excess compared to WSOC, par-ticularly in BO, without a clear relation with the trajectory lengths. We argue that the nocturnal peaks in quasi-ultrafine WINC concentrations could be related to the morning traf-fic rush hours, which, during the summer, had a maximum at 08:00–09:00, before the breakup of the nocturnal bound-ary layer and were therefore included in the nocturnal sam-pling periods. The evening traffic rush time between 19:00 and 20:00 had apparently a minor effect since it occurred while the boundary layer was still well mixed.
0 500 1000 1500 2000 2500 3000 3500 0.0 0.2 0.4 0.6 0.8 1.0 1.2 1.4
SPC (0.05–0.14 µm)
0 500 1000 1500 2000 2500 3000 3500 0.0 0.2 0.4 0.6 0.8 1.0 1.2 1.4
BO (0.05–0.14 µm)
0 500 1000 1500 2000 2500 3000 3500 0 0.5 1 1.5 2 2.5
D N D N D N D N D N D N D N D N D N D N D N D N D N D N D N D N D N D N D N D N D N D N D N D N D N D N D N D N 12 Jun 13 Jun 14 Jun 15 Jun 16 Jun 17 Jun 18 Jun 19 Jun 20 Jun 21 Jun 22 Jun 23 Jun 24 Jun 25 Jun 26 Jun 27 Jun 28 Jun 29 Jun 30 Jun 1 Jul 2 Jul 3 Jul 4 Jul 5 Jul 6 Jul 7 Jul 8 Jul 9 Jul SPC (0.42–1.2 µm)
0 500 1000 1500 2000 2500 3000 3500 0 0.5 1 1.5 2 2.5
D N D N D N D N D N D N D N D N D N D N D N D N D N D N D N D N D N D N D N D N D N D N D N D N D N D N D N D N 12 Jun 13 Jun 14 Jun 15 Jun 16 Jun 17 Jun 18 Jun 19 Jun 20 Jun 21 Jun 22 Jun 23 Jun 24 Jun 25 Jun 26 Jun 27 Jun 28 Jun 29 Jun 30 Jun 1 Jul 2 Jul 3 Jul 4 Jul 5 Jul 6 Jul 7 Jul 8 Jul 9 Jul BO (0.42–1.2 µm)
0 500 1000 1500 2000 2500 3000 3500 0 0.4 0.8 1.2 1.6 2 WS OC, W IN C ( g m‐3
) SPC (0.14–0.42 µm)
0 500 1000 1500 2000 2500 3000 3500 0 0.4 0.8 1.2 1.6 2 Tr aj ec to ry le n gt h ( km )
BO (0.14–0.42 µm)
Figure 10.Time series of WSOC and WINC (=TC−WSOC) concentrations in the size intervals: (1) 0.05–0.14 µm, (2) 0.14–0.42 µm and (3) 0.42–1.2 µm. Four-day back-trajectory length is superimposed to each graph. Results for the urban (BO) and for the rural (SPC) station are shown. Day y = 0.88x ‐ 0.05 R² = 0.88 Night y = 0.65x + 0.22 R² = 0.37 0 0.5 1 1.5 2 2.5 3
0 0.5 1 1.5 2 2.5 3 3.5 4
Sulf at e SPC ( g m ‐3)
Sulfate BO (g m‐3)
St1 day St1 night St2 day St2 night St3 day St3 night St3 16–19 Jun night St2 16–19 Jun night Day all
Figure 11.Scatterplot of sulfate concentration at SPC vs. BO dur-ing day and night for the impactor stages 1 (0.05–0.14 µm), 2 (0.14– 0.42 µm) and 3 (0.42–1.2 µm). The regression lines are referred to the diurnal (gray line) and nocturnal (black line) concentrations in the three stages as a whole. Condensation- and droplet-mode sam-ples for the stagnant nights during 16–19 June are filled in red.
particles in SPC and in the condensation mode in BO. The maximum nocturnal WSOC concentration, found on 18 June, corresponded to an enhancement in the condensation mode of 140 and 325 % in BO and SPC, respectively, with re-spect to the background conditions of 15 June. The same in-crease in the droplet mode amounted to 115 (BO) and 440 % (SPC). Therefore, the change in WSOC concentrations be-tween background and stagnating conditions was more het-erogeneous between sites for nocturnal samples than for the diurnal ones, which is expected because the atmosphere is much more stratified at night and atmospheric composition at ground level is more impacted by local conditions. In this case, a nocturnal enhancement of WSOC concentrations
dur-ing the first stagnation period occurred only in SPC, with a maximum in the droplet mode.
During the second stagnant period, on 5–6 July, WSOC increased considerably in daytime in BO in both size ranges, while only a small increase was observed in SPC and limited to the droplet mode.
3.5 Principal component analysis
In the previous section, we focused on the time trends and size distributions of major carbonaceous and inorganic ionic species and we concluded that at least two secondary forma-tion processes were active in the Po Valley: the first, proba-bly photochemical, is active throughout the campaign at both stations, affecting the concentrations of all species and par-ticularly in the condensation mode during stagnation periods; the second one is associated with deliquesced particles and is selectively important for nitrate (both condensation and droplet mode) and to a lesser extent for sulfate and WSOC in droplet-mode particles. In this section, we will extract source information from all the chemical datasets and from ancil-lary information. PCA was used to analyze the variability of the main variables of interest (the concentration of main SIAs and WSOC) in conjunction with the variability of the concen-trations of minor species and tracers as well as of the physi-cal parameters of the atmosphere. Six principal components were retained for interpretation of the SPC and BO datasets, explaining, respectively, 79 and 77 % of the total variance. Increasing the number of factors progressively raises the ex-plained variance, but each additional factor contributes only a small fractional increase and interpretation of the additional factors is also challenging. For the above reasons, a six-factor solution was chosen as the best one. The results of the PCA are summarized in Table 2 as factor loadings, which repre-sent the correlation of each variable with each factor and hence suggest possible sources, formation mechanisms and source regions. For better clarity, loadings with absolute val-ues below 0.2 (|x| ≤0.2) were omitted and only those with absolute values larger than 0.6 (|x| ≥0.6) were considered “high” (in bold in the table).
The first rotated component (RC1) explained the largest fraction of the dataset variance (22 %) in SPC. It involved high loadings of nitrate and ammonium for all the size classes. Among the meteorological parameters, the fac-tor was strongly positively correlated with RH (0.82) and negatively with temperature (−0.85). Thus RC1 describes the local meteorology and the nighttime condensation of ammonium nitrate in large accumulation-mode particles (0.42–1.2 µm). Ammonium nitrate condensation in SPC was moderately positively correlated with droplet-mode sulfate, WSOC and oxalate, compounds (sulfate and oxalate) that share a source in aqueous secondary formation processes. A similar source was identified in the Bologna dataset in RC6 which, compared to SPC, explained only a smaller fraction (9 %) of the total variance. The relationship with temperature and RH was weaker in BO than in SPC, though in the same direction, and no clear relation was observed with droplet-mode WSOC and sulfate.
RC2 was the second-most important factor in SPC, ex-plaining 15 % of the total variance in the dataset. Sulfate, oxalate, ammonium and WSOC were the species which cor-related most with this factor, especially in the small (0.14–
0.42 µm) and large (0.42–1.2 µm) accumulation mode. This factor was positively correlated with the sun flux integrated along the air-mass trajectory. This factor can therefore ac-count for SIA and SOA photochemical production. An anal-ogous factor in BO (RC2) explained a similar contribution to the total variance (17 %). A positive correlation (0.6) with RH was observed in BO, which was not significant in SPC. The significant contribution represented by this source on the total variance described for the two datasets highlights the importance of regional-scale secondary aerosol forma-tion processes for the Po Valley environment.
The third factor in SPC is RC3, accounting for 14 % of the total variance. This rotated component showed high loadings particularly for Ca2+but also for Mg2+in size bins 3 to 5, corresponding to particles from 0.42 to 10 µm. Oxalate also showed a significant loading in size bin 5 (3.5–10 µm), which suggested the uptake of gas-phase carboxylic acids by min-eral particles, in agreement with past observations (Laongsri and Harrison, 2013; van Pinxteren et al., 2014). This factor is analogous to RC4 in the BO dataset, which explains 11 % of the total variance, and was attributed to road dust resuspen-sion. High loadings in BO were shifted toward larger diame-ters of particles (1.2 to 10 µm).
The fourth rotated component in SPC (RC4), which ex-plained another 12 % of the total variance, displayed the highest loadings for magnesium in coarse-mode particles and sodium in size bins 3 to 5 (from 0.42 to 10 µm). Sulfate in size bin 5 (3.5–10 µm) was also moderately correlated with this factor, and nitrate too, but to a lesser extent. This fac-tor can be interpreted as a contribution from sea salt compo-nents. The corresponding rotated component in BO was RC1, which explained 19 % of the total variance and, compared to SPC, displayed higher loadings for sulfate and nitrate in size bin 4 (1.2 to 3.5 µm).
The fifth rotated component (RC5) in SPC, explaining 8 % of the total variability, only included high loadings for RTIs, without any relevant correlation with other parameters. This factor was identified both in SPC and in BO (RC5), explain-ing, respectively, 8 and 10 % of the total variance. While this factor does not represent an aerosol source, it indicates that during this campaign the impact of air-mass history (long-range transport) was likely small as compared to other im-pacts such as day/night variability or local imim-pacts.
Table 2.Factor loadings of PCA after Varimax rotation. Only absolute values larger than 0.2 are shown. Absolute values larger than 0.60 are considered significant and printed in bold. The number beside each chemical species in the first column indicates the impactor stage.
Site SPC BO
Rotated component RC1 RC2 RC3 RC4 RC5 RC6 RC1 RC2 RC3 RC4 RC5 RC6
Assigned Conden- Photochem. Dust Sea RTI gasSIA+ Sea Photochem. gasSIA+ Resusp. RTI
Conden-source sation SIA+ salt var. gasSOA salt SIA+ gasSOA var. sation
SOA SOA
Nitrate_1 0.81 −0.24 0.24 0.69
Sulfate_1 −0.32 0.28 0.79 0.26 0.84
Oxalate_1 −0.34 0.25 −0.24 0.45 0.37 −0.53 0.24 0.42
Ammonium_1 0.21 0.23 0.84 0.79 0.29
WSOC_1 0.23 0.35 −0.40 0.29 0.46 −0.45 0.37 0.41 0.30 0.38
Nitrate_2 0.79 0.36 0.28 0.84
Sulfate_2 0.83 0.30 0.42 0.75 0.22
Oxalate_2 0.28 0.81 0.31 −0.22 0.71 0.43 0.34
Sodium_2 0.25 −0.23 0.33 0.43 −0.21 0.56 0.23 −0.29
Ammonium_2 0.56 0.69 0.24 0.39 0.77 0.38
WSOC_2 0.30 0.71 0.46 0.72 0.43 0.30
Nitrate_3 0.82 0.40 0.21 0.36 −0.25 0.78
Sulfate_3 0.36 0.79 0.32 0.86
Oxalate_3 0.45 0.73 0.32 0.76
Sodium_3 −0.27 0.21 0.84 0.87
Ammonium_3 0.67 0.67 0.29 0.81 0.32
Magnesium_3 −0.24 0.22 0.80 0.33 0.62 0.24 0.42 0.28
Calcium_3 0.92 0.50 −0.37 0.27
WSOC_3 0.50 0.75 0.32 0.86 0.23
Chloride_4 0.57 0.32 −0.29 0.51 0.22 −0.45 0.31
Nitrate_4 0.82 0.43 0.79 0.28 0.28 0.33
Sulfate_4 0.69 0.32 0.39 −0.23 0.75 0.45 0.24 −0.30
Oxalate_4 0.50 0.35 0.38 −0.23 0.31 0.24 0.24 0.36 −0.37
Sodium_4 0.94 0.90 −0.21
Ammonium_4 0.89 0.27 0.34 0.30 0.24 0.70
Magnesium_4 0.57 0.77 0.88 0.21 0.29
Calcium_4 0.93 0.41 0.64 −0.28 0.29
WSOC_4 0.47 0.31 0.52 0.67 0.42 −0.28
Chloride_5 0.57 0.29 0.23 0.47 −0.66 0.26
Nitrate_5 0.56 0.37 0.37 0.46 0.54 0.65
Sulfate_5 0.47 0.33 0.64 −0.30 0.69 0.60 −0.22
Oxalate_5 0.29 0.64 0.21 0.29 0.55 −0.46
Sodium_5 −0.23 0.75 0.71 −0.50 0.32
Ammonium_5 0.80 0.29 0.26 0.23 0.54 0.50
Magnesium_5 0.29 0.60 0.66 0.69 −0.31 0.56
Calcium_5 0.87 0.24 0.33 0.89
WSOC_5 0.32 0.30 0.65 0.21 0.48 0.55 −0.27
RT_waterandice −0.95 −0.93
RT_naturalveg 0.70 −0.47 0.82 −0.21
RT_agriculture 0.81 0.39 −0.33 0.84
RT_urbanareas 0.90 0.91
RT_bareareas 0.43 0.64 −0.53 0.29 0.25
Sunflux_alongtraj 0.68 0.50 −0.22 0.24 0.68 −0.25
Temperature −0.85 0.30 −0.29 0.69 −0.26 −0.23
RH 0.82 −0.31 0.60 −0.49 0.34
Explained variance (%) 22 15 14 12 8 8 19 17 11 11 10 9
Cumulative variance (%) 22 37 51 63 71 79 19 36 47 58 68 77
generation process (Hamed et al., 2010). The negative rela-tion with RH confirmed that this source was active during the day, when RH was at minimum.
In summary, the PCA analysis provides a synthetic analy-sis of the main sources of variability in the chemical dataset, but it is not intended to resolve all of them. It should be no-ticed, for instance, that the five factors in BO do not recover the local sources of small carbonaceous particles (Fig. 10) which increase at night at the urban site, lowering the noctur-nal correlation between WSOC and sulfate (Fig. 9).
4 Discussion and conclusions
The PCA results indicate that several factors determined the variability in the size-segregated chemical composition in the region during the PEGASOS Po Valley field campaign, but each of them affected preferentially specific size intervals with an overall effect of shaping the aerosol mass distribu-tion at the two sites. Two factors corresponding to sea salt and mineral dust with absorbed nitrate regulated the con-centrations and composition of coarse particles (PM1.2−10),
enrich-ment of ammonium sulfate in the quasi-ultrafine range. Fi-nally, the variability in composition of accumulation-mode aerosol could be reduced to two factors, with one related to regional-scale photochemical formation of SOA and SIA and a second one more dependent on local conditions at surface level and causing a nocturnal increase of SOA and SIA in the droplet mode. However, when the factor for photochemical secondary aerosols was equally represented at the two sites, the other one (for nighttime condensation) was much more important at the rural station (SPC) than in BO. The effect on a simple nonvolatile SIA component, sulfate, is exemplified in the scatter plot in Fig. 11. A good correlation (R2=0.9) was indeed observed between the accumulation-mode sul-fate concentrations at the two sites in daytime (Fig. 11), with only a slight dilution (−12 %) of the concentrations at the background site with respect to the urban site, which is ex-pected for an aerosol component that is typically associated with regional-scale photochemical pollution. By contrast, the correlation between the concentration trends at the two sites is much lower at night, especially as regards the droplet mode, when significantly higher sulfate concentrations oc-curred in SPC compared to BO during the stagnant period from 16 to 20 June. Clearly, stagnating conditions and the onset of thermal inversions at night favored a partial “chemi-cal segregation” of air masses in the surface atmospheric lay-ers within the Po Valley, and the size-segregated chemical composition evolved separately at the urban sites close to the Apennine foothills with respect to the rural areas in the inner Po Valley during dark hours. Specifically, rural areas were characterized by the presence of ammonium nitrate and by ALWC levels above 10 µg m−3. Deliquesced aerosols could host aqueous-phase formation of sulfate (via reaction of SO2
with H2O2).
Similarly to SIAs in the droplet mode, water-soluble prod-ucts of volatile organic compound (VOC) oxidation could readily be taken up by deliquesced particles in SPC at night. A meaningful fraction of the newly formed (1–3 h old) WSOC mass, in fact, has been shown to possess sim-ilar semi-volatile properties to NH4NO3 (Hennigan et al.,
2008; Wilson et al., 2006) and can rapidly partition to aerosol water or cloud/fog droplets. The nature of the noc-turnal enrichment of WSOC in the droplet mode, depend-ing on the reactivity in the aqueous phase, can be described by either a reversible mechanism (condensation of water-soluble organic compounds triggered by the change in RH and ALWC) or an irreversible reaction (oxidation of VOCs or oxygenated VOCs with production of stable compounds). Hodas et al. (2014), based on measurements performed dur-ing the same campaign in SPC, observed an exponential de-crease in gas-phase glyoxal concentrations with increasing ALWC, and a local nocturnal production of aqueous SOA was indeed observed by parallel near-real-time WSOC sam-pled with a particle into liquid sampler (PILS) at the same site (Sullivan et al., 2016). The analysis of impactor sam-ples provides only a few clues to disentangle the two effects.
The only two organic markers for SOA that were quanti-tatively determined in all samples were oxalate and MSA. The robust correlation between WSOC, oxalate and sulfate, both in daytime and at nighttime in SPC, indicates that the accumulation of particulate polar organic compounds con-tributed to the (irreversible) production of stable (oxidized) species. Oxalate is generally known to share with sulfate an important aqueous-phase oxidation pathway (Sorooshian et al., 2006). MSA is a more specific marker than oxalate, be-ing related to the atmospheric processbe-ing of dimethyl sul-fide (DMS) whose emissions are unevenly distributed on the Earth surface, and can be intense in biogenically rich marine waters. Our data indeed showed that fine-mode MSA was maximum in the days between 26 June and 1 July, charac-terized by an easterly or a south-southwesterly circulation, bringing marine air masses into the Po Valley basin. Such increase from long-range transport affected particularly the size intervals 0.05–0.14 µm and 0.14–0.42 µm. MSA concen-trations in the droplet mode (0.42–1.2 µm) showed instead an enhancement at night under stagnant conditions, similarly to ammonium nitrate (see Supplement), particularly marked in SPC during both episodes and in BO only during 5–6 July. The increase of MSA in droplet-mode particles under stag-nating conditions points to a DMS (or other reduced sulfur species) source other than from the marine boundary layer. In inland areas DMS has sometimes been reported as dom-inantly from terrestrial sources (vegetation and soils) and anthropogenic sources (manure and livestock), with higher temperatures and solar radiation enhancing its emission (Per-raud et al., 2015). These findings suggest that the VOCs par-ticipating to the formation of WSOC in the Po Valley also in-cluded organic compounds emitted by agricultural activities or even by natural sources and that ALWC in the atmospheric nocturnal surface layer acted as a medium for their formation during summer time.
background aerosol appears more volatile (hence labile) and more heterogeneously distributed across the Po Valley, with the inner part (where most agricultural activity occurs) acting as a source region, especially in terms of agricultural NH3
emissions, with respect to its southern periphery (more ur-banized). The rural background concentration level is there-fore variable, with a positive gradient from the Apennines border to the central valley, at least for half of the day. These results represent an example of a limitation of the classical Lenschow model.
5 Data availability
Data are available on request by contacting the correspond-ing author by e-mail.
The Supplement related to this article is available online at doi:10.5194/acp-16-10879-2016-supplement.
Acknowledgements. This research was conducted as part of the
“Supersito” Project, supported by Emilia Romagna Region and Regional Agency for Prevention and Environment (ARPA Emilia Romagna) under Deliberation Regional Government n. 428/10. The work was also made possible by the European Commission under the Framework Programme 7 (FP7) projects PEGASOS (grant agreement 265148), BACCHUS (grant agreement 603445) and by the CNR Joint Lab Project Air–Sea Lab, which are highly acknowledged.
Edited by: E. Nemitz
Reviewed by: two anonymous referees
References
Bertram, T. H., Thornton, J. A., Riedel, T. P., Middlebrook, A. M., Bahreini, R., Bates, T. S., Quinn, P. K., and Coffman, D. J.: Direct
observations of N2O5 reactivity on ambient aerosol particles,
Geophys. Res. Lett., 36, L19803, doi:10.1029/2009gl040248, 2009.
Bucci, S., Cairo, F., Cristofanelli, P., Decesari, S., Groess, J., and Fierli, F.: Transport regimes analysis over the Po Valley during summer 2012: impacts on Planetary Boundary Layer variability and aerosol content, in preparation, 2016.
Carbone, C., Decesari, S., Mircea, M., Giulianelli, L., Finessi, E., Rinaldi, M., Fuzzi, S., Marinoni, A., Duchi, R., Perrino, C., Sar-golini, T., Varde, M., Sprovieri, F., Gobbi, G. P., Angelini, F., and Facchini, M. C.: Size-resolved aerosol chemical composi-tion over the Italian Peninsula during typical summer and winter conditions, Atmos. Environ., 44, 5269–5278, 2010.
Clegg, S. L., Brimblecombe, P., and Wexler, A. S.: Thermodynamic
model of the system H+-NH+4-SO24−-NO−3-H2O at tropospheric
temperatures, J. Phys. Chem. A, 102, 2137–2154, 1998.
Crosier, J., Allan, J. D., Coe, H., Bower, K. N., Formenti, P., and Williams, P. I.: Chemical composition of summertime aerosol in the Po Valley (Italy), northern Adriatic and Black Sea, Q. J. Roy. Meteor. Soc., 133, 61–75, 2007.
Decesari, S., Allan, J., Plass-Duelmer, C., Williams, B. J., Paglione, M., Facchini, M. C., O’Dowd, C., Harrison, R. M., Gietl, J. K., Coe, H., Giulianelli, L., Gobbi, G. P., Lanconelli, C., Car-bone, C., Worsnop, D., Lambe, A. T., Ahern, A. T., Moretti, F., Tagliavini, E., Elste, T., Gilge, S., Zhang, Y., and Dall’Osto, M.: Measurements of the aerosol chemical composition and mixing state in the Po Valley using multiple spectroscopic techniques, Atmos. Chem. Phys., 14, 12109–12132, doi:10.5194/acp-14-12109-2014, 2014.
Decesari, S., Facchini, M. C., Sandrini, S., Paglione, M., Gilar-doni, S., Rinaldi, M., Cristofanelli, P., Cairo, F., Gobbi, G. P., Poluzzi, V., Morgillo, A., Bonafè, G., Mentel, T., Kindler-Schaar, A., Manninen, H., Poulain, L., Wolf, F., Baltensperger, U., Ganzeveld, L., Nemitz, E., and Pandis, S.: The 2012 PEGASOS-SUPERSITO Po Valley campaign: an overview, in preparation, 2016.
Dorling, S. R., Davies, T. D., and Pierce, C. E.: Cluster Analysis – A technique for estimating the synoptic meteorological controls on air and precipitation chemistry – Method and applications, Atmos. Enviro. A-Gen., 26, 2575–2581, 1992.
Draxler, R. R. and Rolph, G. D.: HYSPLIT (HYbrid Single-Particle Lagrangian Integrated Trajectory) Model access via NOAA ARL READY Website, available at: http://www.arl.noaa.gov/ready/ hysplit4.html, NOAA Air Resources Laboratory, Silver Spring, MD, 2003 (last access: September 2015).
Farnham, I. M., Singh, A. K., Stetzenbach, K. J., and Johannes-son, K. H.: Treatment of nondetects in multivariate analysis of groundwater geochemistry data, Chemometr. Intell. Lab., 60, 265–281, 2002.
Gelencser, A., Meszaros, T., Blazso, M., Kiss, G., Krivacsy, Z., Molnar, A., and Meszaros, E.: Structural characterisation of organic matter in fine tropospheric aerosol by pyrolysis-gas chromatography-mass spectrometry, J. Atmos. Chem., 37, 173– 183, 2000.
Gietl, J. K., Tritscher, T., and Klemm, O.: Size-segregated analysis
of PM10at two sites, urban and rural, in Munster (Germany)
us-ing five-stage Berner type impactors, Atmos. Environ., 42, 5721– 5727, 2008.
Gilardoni, S., Massoli, P., Giulianelli, L., Rinaldi, M., Paglione, M., Pollini, F., Lanconelli, C., Poluzzi, V., Carbone, S., Hillamo, R., Russell, L. M., Facchini, M. C., and Fuzzi, S.: Fog scavenging of organic and inorganic aerosol in the Po Valley, Atmos. Chem. Phys., 14, 6967–6981, doi:10.5194/acp-14-6967-2014, 2014. Hamed, A., Birmili, W., Joutsensaari, J., Mikkonen, S., Asmi, A.,
Wehner, B., Spindler, G., Jaatinen, A., Wiedensohler, A., Korho-nen, H., LehtiKorho-nen, K. E. J., and LaaksoKorho-nen, A.: Changes in the production rate of secondary aerosol particles in Central Europe
in view of decreasing SO2emissions between 1996 and 2006,
Atmos. Chem. Phys., 10, 1071–1091, doi:10.5194/acp-10-1071-2010, 2010.
Harrison, R. M. and Pio, C. A.: Size-differentiated composition of inorganic atmospheric aerosols of both marine and polluted con-tinental origin, Atmos. Environ., 17, 1733–1738, 1983. Hennigan, C. J., Bergin, M. H., Dibb, J. E., and Weber, R.