Feasibly Financing Campus Sustainability:
Structuring and Financing a Sustainable Revolving Fund at UNC Chapel Hill
By Grace Buie
Senior Honors Thesis
Curriculum for the Environment and Ecology University of North Carolina at Chapel Hill
April 6, 2018
Approved:
Introduction
Human emissions of greenhouse gases have drastically altered Earth’s climate over the past 100 years, increasing average surface temperature of the planet by approximately 0.5°C, and creating more extreme temperature ranges.1 These extreme hot and cold temperatures have led to costly weather events. Further increases in global temperature, particularly if there is a 2.0°C increase above the pre-industrial temperature baseline, are expected to lead to an “increase in frequency and/or severity” of severe heat, heavy precipitation, and decreased snowpack.2 In North America alone, these factors will impact every part of daily life, including decreasing crop yields, reducing access to water, harming human health, and creating economic instability.3 Reducing carbon dioxide emissions is a key part of mitigating these effects.
Most greenhouse gas emissions are categorized according to Scope 1, 2, and 3. Universities contribute emissions in all three categories. Scope 1 emissions include direct emissions, through heating and cooling systems, as well as any energy generated on-campus. Scope 2 emissions refer to emissions that are a result of campus energy usage but are produced off-campus. Scope 3 emissions include all emissions related to campus activities, including transportation of workers or goods, waste disposal, paper use, food, and all energy emissions not covered in Scope 1 or 2.
1 Ulrich Cubasch, et.al. “Introduction.” Climate Change 2013: The Physical Science Basis (2013). Cambridge University Press, Cambridge, United Kingdom and New York, NY, USA. https://www.ipcc.ch/pdf/assessment-report/ar5/wg1/WG1AR5_Chapter01_FINAL.pdf. 2 Patricia Romero-Lankao, Joel B. Smith, et.al. “North America.” Climate Change 2014: Impacts, Adaptation, and Vulnerability. (2014) Cambridge University Press, Cambridge, United Kingdom and New York, NY, USA, pp. 1439-1498.
Figure 1.1: Three categories of emissions4
Universities play a unique role in addressing sustainability challenges. As institutions that shape leaders and foster problem solving, universities bear a larger burden to promote
sustainability than most institutions. As Harvard president Drew Foust put it in her 2008 sustainability commencement to Harvard University, “We must realize, our practices have pedagogical value. We teach with what we do, as well as with what we write or what we say.”5 Universities have a responsibility to not only advocate for sustainable practices, but to act sustainably, setting an example for the students who live and learn within universities during some of the most formative years of their lives. As a part of that burden, universities are
expected to “create financial mechanisms to facilitate investment in viable projects, actions and
4“Greenhouse Gases at EPA.” US Environmental Protection Agency. Accessed October 5, 2017. https://www.epa.gov/greeningepa/greenhouse-gases-epa
innovation technology aimed at sustainable development and incorporate innovative models of investment” as a part of a university’s shift toward sustainable practices.6
Aside from the academic obligation that universities bear to promote sustainability, they can experience the same benefits as any company or organization when they implement
sustainable practices. Reductions in water and energy use, as well reductions in waste bring yearly savings to universities. Lessened dependence on fossil fuels also frees institutions from potential fluctuations in fuel prices, shielding them from some degree of financial volatility. The Carbon Disclosure Project found in an analysis of S&P 500 companies that those who scored higher in sustainability indexes (such as leadership that values sustainable practices, low
emissions, and meeting sustainability targets) experienced 18% higher returns on equity and 50% lower volatility than companies who scored low on the indexes.7 This relationship shows that there can be a strong link between sustainability and profitability. Universities also have the added benefit of attracting more students with increased sustainability. In the Princeton Review’s 2017 College Hopes and Worries Survey, 64% of respondents (a combination of students and parents) said that a University’s commitment to environmental issues was a contributing factor to their college decision.8 Committing to sustainable practices can bring a higher percentage of accepted students onto campus.
6 Fabricio Casarejos, Mauricio Nogueira Frota, Laura Morten Gustavson. "Higher education institutions: a strategy towards sustainability." International Journal of Sustainability in Higher Education, Vol. 18 Issue: 7, pp.995-1017. (2017). https://doi.org/10.1108/IJSHE-08-2016-0159.
7 “Climate action and profitability: CDP S&P 500 Climate Change Report 2014.” CDP. (2014).
https://b8f65cb373b1b7b15feb-c70d8ead6ced550b4d987d7c03fcdd1d.ssl.cf3.rackcdn.com/cms/reports/documents/000/000/84 5/original/CDP-SP500-leaders-report-2014.pdf?1472032950
Sustainability at UNC Chapel Hill
The University of North Carolina at Chapel Hill has a strong record of sustainability efforts. The University is currently ranked 28th in the nation on the Sierra Club’s “Cool School” ranking of sustainable universities. 9 The university has also implemented numerous
sustainability projects, reducing energy use by 29% and potable water usage by 47% since 2003.10 Those reductions have created huge savings for the university. Over the same time period, UNC saved $261 million in energy costs and $28.9 million in water costs. However, the University has emissions targets of 20% reduction in emissions by 2020, and 30% reduction in emissions by 2030. It is not currently on track to meet either of those targets.
UNC Chapel Hill has taken some steps to decrease emissions. UNC has decreased Scope 1 and 2 emissions by 16.24% per 1000sq.ft. of campus space. However, Scope 3 emissions have increased by 8.47%. Scope 1 emissions make up the largest portion of emissions, with the university producing 280,159 metric tons of CO2 (MTCO2). Scope 2 and 3 emissions are similar, with the university generating 129,131 and 131,852 MTCO2 respectively. While this progress is promising, the University still has numerous ways that it can improve its emissions profile.
The University currently targets three sustainability areas in its Three Zeros Initiative, energy, water, and waste. After conversations with University administration, it is clear that further reductions in water usage are going to be costly and difficult to implement, but that the university still has room to improve in energy and waste reductions.11 Reducing campus energy
9 “Cool Schools 2017 Full Ranking.” The Sierra Club. (2018).
https://www.sierraclub.org/sierra/cool-schools-2017/cool-schools-2017-full-ranking.
10 “Strategic Energy and Water Plan – 2015.” The University of North Carolina at Chapel Hill. (2015). http://facilities.unc.edu/files/2015/12/State-Energy-Report-2015.pdf.
usage will directly translate to reductions in Scope 1 and 2 emissions, while reductions in waste will contribute to a reduction in Scope 3 emissions.
Sustainable Revolving Fund at UNC
While UNC Chapel Hill has acknowledged and embraced the social and environmental importance of meeting sustainability standards, it can be difficult for universities to balance investment in sustainable practices with their financial responsibility to students and donors. In order to fill its role as an affordable public institution, UNC must strive to keep tuition as low as possible, while still meeting students’ needs. UNC also has the obligation to responsibly use donor funding, in particular the endowment, to the specifications of the donor and the benefit of the University. UNC has the additional mandate of responsibly managing state funding as an obligation to North Carolina tax-payers. This thesis will provide a viable solution to the problem of paying for sustainability projects while being financially responsible, and will argue that the university should approach this problem by implementing a sustainable revolving fund.
A sustainable revolving fund (SRF) is an investment vehicle that finances sustainable projects, then tracks the savings from those projects and uses them to replenish the fund, in turn financing more sustainable projects. SRFs can provide a consistent, and predictable source of funding for sustainability on campus, without having to allocate increasing amounts of money to fund more and more expensive sustainability projects. The fund grows after the initial capital investment from reinvested savings.
This fund would provide a crucial way for Facilities here at UNC to implement projects that advance the sustainability efforts at the University and fulfill the necessary project
Other universities have seen success in implementing sustainable revolving funds. Boston University implemented a $1 million revolving fund in 2008. By 2011 the fund was averaging annual returns of 57% and by 2015, BU had reduced its emissions by 23%.12 Harvard’s $1.5 million fund established in the late 1990s has grown to $12 million with yearly average returns of 30%. Arizona State University established their fund in 2014 using $3 million in seed money. As of November 2017, they had invested $12-15 million and have seen $7.5 million in savings. As Lisa Frace, ASU’s associate vice president for Planning and Budget put it, “It’s paying for itself!”13
There are a number of barriers to implementing a successful fund. After interviews with UNC administration, it is clear that UNC faces two major barriers.
1. Viable structuring of the fund
2. Achieving adequate returns for the fund
These are common barriers to implementing sustainable revolving funds. The primary barrier that administration at UNC has expressed is the most common barrier for many funds around the country: funding and accounting issues. 14 It is difficult to navigate the flow of money in and out of the fund, especially when it comes to tracking savings and ensuring that those savings can be returned to the fund. It is also difficult to manage the transfer of money between departments and to ensure that a department will be able to put savings back into the fund. The second barrier, achieving adequate returns, is vital to creating a self-sustaining fund. This thesis
12 “Sustainability Revolving Loan Fund.” Boston University Sustainability. (2018).
http://www.bu.edu/sustainability/what-were-doing/energy/sustainability-revolving-loan-fund/. 13 Robert Haight and Lisa Frace of Arizona State University, interview by Grace Buie,
November 8, 2017
14 “Greening the Bottom Line.” Sustainable Endowments Institute. (2012).
will provide a structure for establishing revolving a fund at the University as well as prove that the fund can achieve viable returns implementing sustainable projects through a sustainable revolving fund.
Methods
Surveys
In order to develop a fund structure, 10 public universities with at least 15,000 students, with existing revolving funds, were contacted. These parameters ensured that the information they provided would be largely applicable to UNC. Of those 10 universities contacted, 6 agreed to be interviewed. Administrators, fund managers, and others involved with the implementation of and ongoing management of the fund were interviewed. These interviews focused primarily on how universities managed to implement their funds and the basics of running a sustainable revolving fund. Every interview was based around the following five questions:
1. What arguments were compelling in establishing the fund? 2. What benchmarks do you use to accept or decline projects? 3. What types of projects do you accept?
4. How do you generate interest in applying for projects? 5. How do you track cost savings for projects?
Fund Return Analysis
Project Determination
In order to determine that the fund could actually reach viable returns, the analysis uses potential projects from the Assistant Director of Engineering Services, Cindy Register, as well as projects from the 2015 UNC State Energy Report list of potential energy savings projects.15 The fund proposed would have an initial capital pool of $5 million. This number is based on a
proposal from the Associate Vice Chancellor of Campus Enterprises, Brad Ives, as well as initial capital investments from other universities interviewed. The potential energy savings projects were sorted according to their annual returns. An average of 5.4 projects were completed per year by the facilities department for energy conservation measures under North Carolina General Assembly House Bill 1292, however that average is dramatically increased by the volume of projects completed in 2014.16 Including the difficulty of inter-departmental collaboration and the element of a new project, the maximum possible projects implemented per year is likely to be lower. For purposes of this analysis, a conservative assumption was made that the fund could not complete more than 3 projects in a year, even if it had the capital resources to do so.
The projects selected from this pool were based on requirements gathered from various universities interviewed. Originally the analysis included only projects with at least 10% annual returns, creating a project payback period of at least 10 years or less. However, there were very few projects that met that requirement. Because a purpose of the fund was to finance projects that had lower returns than would ordinarily be financed, but still created returns, projects that
15 “Strategic Energy and Water Plan – 2015.”
had a 15 year payback or less were included in the pool of potential projects. This included projects with annual returns of 6.6% or higher.
Metrics Used
Using MATLAB, I created yearly cash flows for the fund to estimate the Net Present Value (NPV) and Return on Investment (ROI) for differing time periods over the course of the fund’s life (See Appendix A). Future returns were discounted at r = 6.0% because that is the endowment’s expected rate of return not including inflation. While either returns or net present value can be used to accurately determine the success of an investment project, NPV “tends to give better decisions.”17 However, evaluation of the fund in this analysis was primarily based on the ROI, in order to provide a direct comparison to the returns of the endowment and to the revolving funds at other universities. Discounting cash flows also ignores the fact that the future balance of the fund is just at vital to the long-term success of the fund as the current balance and should not be heavily discounted. But in order to be as thorough as possible, this analysis
considers both metrics.
𝑅𝑒𝑡𝑢𝑟𝑛 𝑜𝑛 𝐼𝑛𝑣𝑒𝑠𝑡𝑚𝑒𝑛𝑡 (%) = 𝑝𝑟𝑜𝑗𝑒𝑐𝑡 𝑟𝑒𝑡𝑢𝑟𝑛𝑠 − 𝑝𝑟𝑜𝑗𝑒𝑐𝑡 𝑐𝑜𝑠𝑡𝑠
𝑖𝑛𝑖𝑡𝑎𝑙 𝑐𝑎𝑝𝑖𝑡𝑎𝑙 ∗ 100
𝑁𝑒𝑡 𝑃𝑟𝑒𝑠𝑒𝑛𝑡 𝑉𝑎𝑙𝑢𝑒 = −𝑖𝑛𝑖𝑡𝑎𝑙 𝑐𝑎𝑝𝑖𝑡𝑎𝑙 + ? 𝑦𝑒𝑎𝑟 𝑝𝑟𝑜𝑗𝑒𝑐𝑡 𝑟𝑒𝑡𝑢𝑟𝑛𝑠 − 𝑦𝑒𝑎𝑟 𝑝𝑟𝑜𝑗𝑒𝑐𝑡 𝑐𝑜𝑠𝑡
(1 − 𝑟)ABCD EFG ABCD
ABCDHI
Because future returns will be discounted, projects were sorted in order of highest to lowest returns. The projects with the highest returns were implemented first, with lower return projects implemented in later years. The number of projects, the time-period evaluated, and the types of
projects were all varied to determine how the fund could best invest its capital. Projects were not expected to see returns for a year after the capital was spent on the project, allowing time for project construction. The time-period never exceeded 15 years, so project lifetimes were assumed to extend the entire length of time evaluated.
Fixed costs for fund management were assumed to be the salaries of the two fund managers. Those salaries were estimated using current salaries of UNC administration that would be directly above and on-par with the fund managers under the proposed structure.18 These salaries were estimated to be $85,000.
A number of different “scenarios” were modeled, based on various possible investment strategies in order to determine which investment strategies maximize returns for the fund in order to exceed the return requirements of the endowment.
Fund Structure
Origin of Funds
The initial seed money for the fund will consist of $5 million taken from unrestricted contributions to the endowment. Brad Ives initially suggested $5-10 million would be a viable amount to pull from the endowment.19 However, $5 million is closer to the initial capital of most universities who have started funds, and is still larger than the initial investment of most
university funds. The average fund size for sustainable revolving funds in higher education is $1.4 million.20
18 “Look up salaries of UNC system workers.” Raleigh News and Observer (Raleigh, N.C.). (2018). http://www.newsobserver.com/news/databases/public-salaries/.
The recommendation to draw the seed money from the endowment comes from Mark Orlowski, the director of the Sustainable Endowments Institute and a leader in establishing revolving funds on university campuses. He points out that returns for revolving funds often exceed the returns of an endowment, meaning that the University is acting financially responsible by using non-specified endowment money, or ideally money specified for
sustainability directly, to invest in sustainability projects and the future of the University. 21
Fund Management
The fund will be located within UNC Chapel Hill’s Finance and Operations department, under the sustainability division. This structure is in line with most of the other large public universities surveyed. Most universities and colleges surveyed found that having the fund operate within the sustainability department allowed the funding to be uniformly accessible to students, faculty, and various departments of the university. Additionally, keeping the fund under the sustainability division of Finance and Operations will ensure that the fund remains focused on sustainability projects, and will retain its central mission.
Two people will be hired to manage the fund and to ensure that projects are fed through the project pipeline. The University of Maine saw some failure with student directed projects, as did Oregon State University. They attributed the failure of student led projects to the temporary presence of students and the interruptions in their time on campus due to extended breaks. Both of those factors hurt projects that lasted more than an academic year. These universities both transitioned to a fund run by their sustainability departments and have seen more success with the funds since.22 Dan Dixon at the University of Maine recommended that the department hire
21 Mark Orlowski, interview by Grace Buie, June 30, 2016
specific fund managers to ensure that there was consistency in the application of projects. One of these people should have a background in finance and budget, while one person should have a background in engineering and facilities. The hiring process should be overseen by Brad Ives and Cindy Shea as the new staff will operate within the sustainability department. Having a large enough fund to devote the fixed costs of hiring two workers allows universities to more easily navigate the accounting barrier of revolving funds without placing a burden on current staff.
The final approval for fund projects, and last say in fund management, should come from a five-person committee representing each of the stakeholders in projects. The committee
members should represent departments as follows: 1. Facilities
2. Campus Enterprises/Sustainability
3. Campus Accounting/University Controller 4. Financial Reporting and Management 5. Treasurer’s office
Having a facilities representative will ensure that the project is feasible and that facilities has the capacity to implement the project. Having a sustainability representative will ensure that the project is advancing the University’s sustainability efforts. The other three representatives will ensure that the project is financially sound and the investment is in the best interest of the
Project Pipeline
Figure 1.2: Cycle of the project pipeline
Origination
Project origination may come from any source within the University. This source can be students, faculty, administration, or others. Because the implementation of the project will be in the hands of the fund managers and the fund committee, any member of the University can bring forward a project proposal. If the fund managers determine that the project should be explored they can advance the project to the next stage of the pipeline. While anyone may source projects, most projects will likely come from the facilities department. Shane Stennes at the University of Minnesota says that most projects come from Energy Management at UMinn.23
Evaluation
Projects should have strict parameters that they must meet in order to be approved. Each university interviewed had a minimum requirement for yearly project returns and a maximum
23 Shane Stennes of the University of Minnesota, interview by Grace Buie, January 12, 2018 Evaluate
Committee Approval
Implement Fund
Payback
payback period as baseline requirements for projects to advance. Returns are a measure of the savings from a project in relation to the costs of the project, or how much savings are realized for each dollar invested in a project. A maximum payback period is the amount of time that it takes for a project to return its initial capital investment.
𝑃𝑎𝑦𝑏𝑎𝑐𝑘 𝑃𝑒𝑟𝑖𝑜𝑑(𝑦𝑒𝑎𝑟𝑠) =𝑖𝑛𝑡𝑖𝑎𝑙 𝑐𝑎𝑝𝑖𝑡𝑎𝑙 𝑖𝑛𝑣𝑒𝑠𝑡𝑚𝑒𝑛𝑡
𝑦𝑒𝑎𝑟𝑙𝑦 𝑟𝑒𝑡𝑢𝑟𝑛𝑠
Minimum project returns were anywhere in the range of 6.0% at the University of Maine to 8.0% at Arizona State University. However, most universities reported that they had no trouble
meeting those returns and often exceeded them. Maximum payback periods were in the 5-10 year range. The University of Maine had the lowest maximum payback time at 5 years, but are campaigning to increase the maximum payback period to 7 years. In order for the University of North Carolina to be able to responsibly take funds from the endowment, the fund must meet or exceed the returns required of the endowment. The endowment currently targets an average of 5.5% in real returns, factoring in inflation. Accounting for inflation of approximately 2.0%, the endowment strives for an average of 7.5% in nominal returns.24 Therefore, in order to be financially responsible, the sustainable revolving fund should reach 8.0% returns in nominal terms. Based on projects proposed by the facilities department here at UNC and discussions with other universities, this fund should have a maximum payback period of 12 years. Each project should meet the following criteria:
1. Does not bring average nominal returns below 8.0% 2. Maximum payback of 12 years
24 “Fiscal Year 2017 Annual Report.” The University of North Carolina at Chapel Hill Foundation Investment Fund, Inc. (2018).
3. Can feasibly be implemented within a year
After each project is proposed, the two employees responsible for managing the fund should decide if the project is feasible through their analysis and collaboration with departments that would be involved in the project. Once deemed feasible, the team should perform the necessary steps to ensure that the project meets the above requirements. This would include financial calculations, any necessary energy audits, and feasibility assessments. Having a designated team to execute this process will ensure that it is uniform, impartial, and thoroughly carried out for each project. It will also reduce the burden on the proposer of the project, whether it be an individual or department. This will lead to more project proposals.
Committee Approval
Once the project has been evaluated and meets the above three criteria, it will move on for committee approval. The committee will be designed as discussed above in “Management”. Because of the expertise of each member on the committee, in order to pass the committee stage a project must receive unanimous approval. This will ensure that each project has the full support of each group of stakeholders and that stakeholders will be able to collaborate to execute
projects.
Project Implementation
After a project is committee approved, the fund management will create an
implementation plan for the project. They will draw up a timeline and budget for the project, collaborating with the departments involved. Once an implementation plan has been completed, the fund will release money to the department that is requested. Project funding from the
Fund Payback
Revolving fund payback generally fits into one of two categories, the Loan Model vs the Accounting Model.25 Under the Loan Model, the fund will act as a loaning institution, loaning money to the department that sees savings as a result of the sustainable project. The department then directly pays back the loan from savings seen under the project. The second model, the Accounting Model, is used when budgets are centrally managed. Energy savings from the project are put back into the fund by the centralized budget office. UNC uses an energy purchasing model in which Energy Services purchases any necessary energy beyond what is generated at the cogeneration plant from Duke Energy, directly seeing savings. Because the University
department directly sees the savings of energy reductions, UNC Chapel Hill should use a Loan Model. A loan model also allows the fund to expand to projects beyond energy savings, and allows any department that can find savings through a sustainable project to apply for funding. While some universities charge interest for these loans, the majority do not, and as Dan Dixon from the University of Maine pointed out, having interest rates could potentially deter
departments from proposing projects for the loan.26
The initial capital expenditure will be paid back to the revolving fund from the project’s energy savings. This is possible under North Carolina General Assembly H.B. 1292.1.b., which states:
The Director of the Budget shall not decrease the recommended continuation budget requirements for utilities for constituent institutions by the amount of energy savings
25 “Greening the Bottom Line.”
realized from implementing energy conservation measures, including savings achieved through a guaranteed energy savings contract.
This allows departments to retain the savings from energy expenditure projects without their budget decreasing. The loan from the fund can be paid back from these budget savings. H.B. 1292 requires that 60% of those savings be put toward future energy savings, which repaying the SRF will fulfill. Rather than having to track energy savings, the payback to the fund will be based on savings predictions rather than tracking exact per-project savings. That would require more advanced energy monitoring than UNC currently uses, unnecessarily increasing project costs.27 This prediction-based system brings in an element of uncertainty. It is possible that predicted energy savings will be more or less than the fund managers calculated. When the savings are higher than the agreed amount the department will benefit from increasing savings, while having a guaranteed payback will protect the revolving fund from this uncertainty. As Dan Dixon from the University of Maine argues, the sustainable revolving fund should not suffer because of unpredictability in cost savings.28
Once the initial capital from the project has been paid for, the savings from the project will continue to replenish the fund for the lifetime of the project. If declining savings are expected over the course of the project, the initial analysis will predict those decreases and the savings payments will be diminished accordingly over the project lifetime.
One fund management technique is to share savings between the fund and the department that is seeing the results of the savings. Numerous universities with revolving funds use this technique, including the University of Maine and Weber State University. This is common in the
27 Anna Wu, Cindy Register, and Phil Barner of UNC Chapel Hill, interview by Grace Buie, October 11, 2017
Accounting Model of revolving funds, but would be possible to implement in a Loan Model. The University of Maine sees 50% of savings for the lifetime of the project, while 50% of the savings go to the department who benefits from those savings.29 Weber State University structures its fund so that 75% of savings go back into the fund, while 25% remain as savings in the budget.30 However, Weber State has designated 5% of its endowment to maintaining the fund, so the fund has a consistent source of capital. UNC’s fund would only have the initial $5,000,000 in capital, the rest of the fund would be built on returns from previous projects. Sharing savings has the potential to incentivize project sourcing from departments, because departments also see benefits of the savings, but it can deplete the fund and drastically reduce savings.
Role of the Renewable Energy Special Projects Committee
UNC Chapel Hill currently has a student-managed sustainability fund, the Renewable Energy Special Projects Committee (RESPC) focused on “funding of renewable energy, energy efficiency, maintenance, and energy education projects on campus”.31 RESPC currently takes $4
from every student’s tuition to devote to those ends, with the ability to use their funds as a
revolving fund would. While RESPC plays an important role in campus sustainability, they are
not currently filling the role that a revolving fund would fill. Revolving funds have not had much
success with student-led sustainable energy efforts. Due to the transient nature of students and
their multiple commitments, it is difficult for students to follow through on long-term energy
projects in the way someone in a permanent, full-time position would follow through. Numerous
universities cited difficulty with student managed programs, including Oregon State University
29 Dan Dixon of the University of Maine, interview by Grace Buie, January 12, 2018 30 “Greening the Bottom Line.”
and the University of Maine. Many of these universities have seen problems when it comes to
delegating accounting problems to students.32
Students do play an important role in proposing projects and can potentially have a role
in project approval. RESPC will likely, and should be encouraged to, be closely involved with
project sourcing and implementation. As former student co-chair Eli Murrey pointed out, RESPC
is in a unique role because their projects do not have to have returns.33 Having a renewable
energy revolving fund efficiently implementing high-return renewable energy projects will allow
RESPC to take on a more experimental role in sustainability on campus, making UNC a more
innovative and open place for sustainability projects that play an important role in decreasing
UNC’s environmental impact and foster an emphasis on campus sustainability.
Fund Returns
Returns for the fund were evaluated under a number of different scenarios. Each of these scenarios determine how returns would respond to different investment strategies and different fund parameters. In order to support pulling the money out of the endowment, the fund must reach at least 8.0% return on investment (ROI). Graphically, this will be represented as a ROI of at least .08. However, the average ROI for revolving funds in higher education is 32.0%, so ideally the fund will come close to or exceed that average. A complete list of projects and project implementation schedules are shown in Appendix C.
32 “Greening the Bottom Line.”
Scenario 1
• Differing number of maximum projects per year • Projects implemented in order of highest returns • $5,000,000 in initial capital
The initial analysis of net present value and return on interest for the firm was determined using all available projects, with the highest return projects used first, and subsequent lower return projects implemented later. If there is not enough capital to invest in the next highest return project the fund will wait until it has enough capital to invest in the project (Appendix A). Table 1 summarizes the results of this scenario.
3 projects/year 2 projects/year 1 project/year
Return on Investment -19.41% -5.97% -35.54%
Net Present Value -$1,807,452 -$1,356,881 -$1,935,150
Project Expenditure $7,615,173 $6,434,272 $5,860,526
Savings $8,344,704 $7,835,535 $5,783,603
Table 1: 10-year time frame
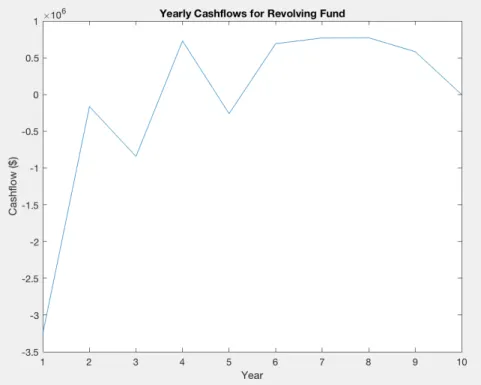
3 Project-per-year Maximum
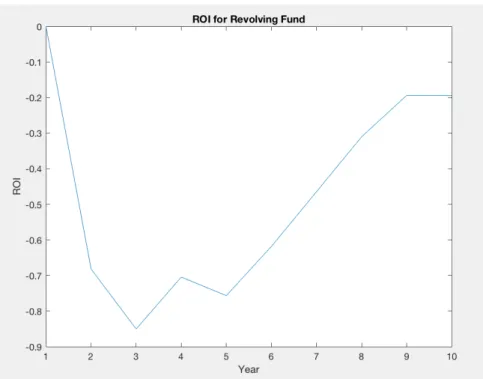
largest environmental impact. Looking at the project returns are a good way to gauge the environmental impact of the project, because increased returns directly correspond to reduced emissions. While this scenario allows the university to spend the money on the most projects of the three scenarios, the returns for the fund are not positive so this scenario does not create a compelling argument for drawing funds out of the endowment.
Under this scenario, the fund balance never dips below $748,490 as seen in Figure 2.2, meaning that there is always unused capital in the fund. That capital is not invested in sustainable projects, meaning that it is acting as “wasted-capital” in the fund and is bringing down the
returns for the fund.
Figure 2.2: Yearly fund balance
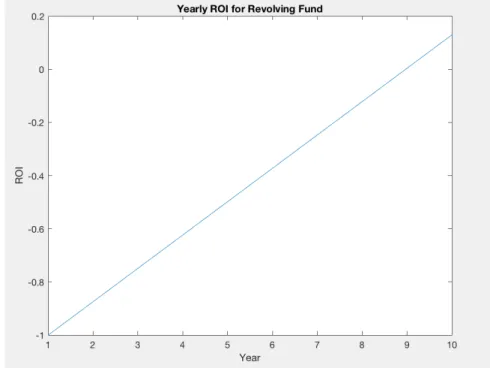
Figure 2.3: Yearly ROI: 10 year time frame
2 Project-per-year Maximum
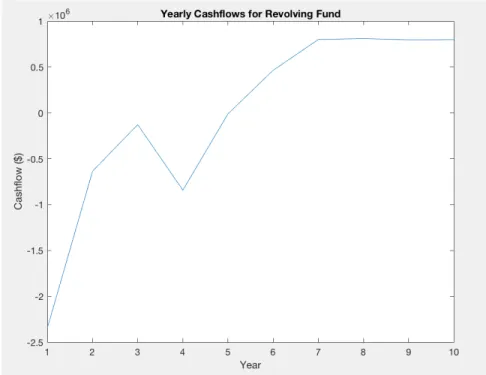
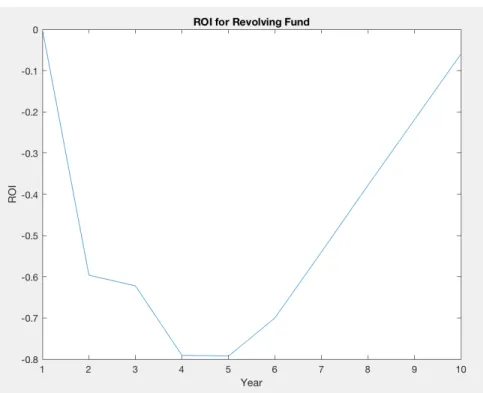
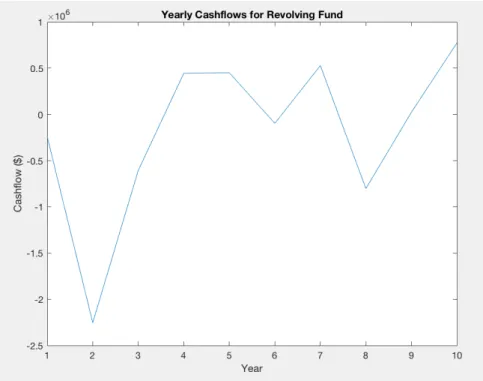
year-time frame was used so that the two different project levels could be compared. Trends for cash flows and returns on interest look similar, because the projects are being implemented in the same order. The swing to negative cash flows in year 4, as seen in Figures 2.4 and 2.1 come as a result of the capital intensive project in Fordham Hall (Appendix C, Tables 1 and 2). This continuing trend shows the resilience of the fund and its long-term ability to invest in higher-capital projects without creating a cycle of negative cash flows. Decreasing the number of projects completed each year increases the funds returns, but because all projects implemented are not held to the strong standards of project returns, the return on investment still remains below the amount required to beat the returns of the endowment. The NPV is still negative, at -$1,356,881. It increases the 10-year ROI to -5.97%, still significantly lower than returns of the endowment and not acceptable returns for any fund. Fewer projects would be implemented under this model than under the three-project model, so the fund’s impact is not as large. It only spends $6,434,272 on projects. However returns are similar to the 3-project scenario, with $8,143,438 in total returns over the course of 10 years. The similarity in returns comes from the high-return projects done in the early years of the funds.
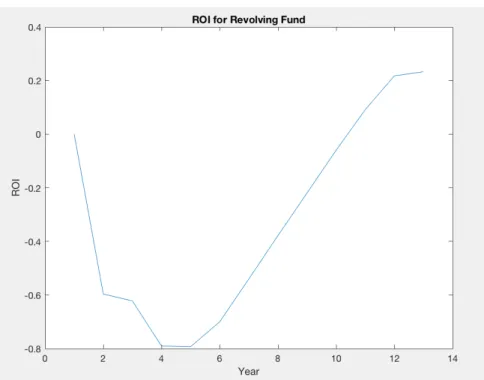
In this scenario, no project has an annual return of under 7.14%, because the fund does not implement enough projects to necessitate implementing lower-return projects. The increase in returns as a result of only implementing higher return projects shows the strong argument for having projects that are above a certain threshold of returns.
While returns remain low in the first ten years of the fund, as Figure 2.7 shows, the fund’s returns dramatically increase beyond a ten-year time frame. The returns for the fund have increased to 9.17%, beating the endowment’s returns in year 11. By year 13 the fund sees 23.30% returns, approaching the average for university sustainable funds. While a positive indicator of the resilience of the fund, this still does not create a strong argument for establishing the fund because of the long time frame required for the fund to reach appropriate returns.
Figure 2.5: Yearly fund balance
Figure 2.7: Yearly ROI: 13 year time frame
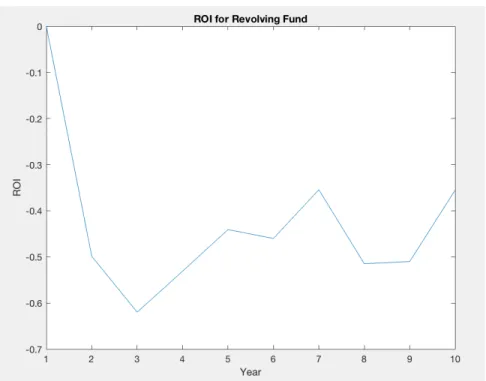
1 Project-per-year Maximum
Implementing a maximum of one project per year decreased the impact for the fund, the ROI for the fund, and dramatically decreased the NPV of the fund. Only implementing one project per year for 10 years, the fund’s expenditure on projects fell to $5,860,526, while the returns for the fund fell to $5,783,603 indicating decreased environmental impact. As Figures 2.7-9 show, only implementing one project per year increases the volatility of year to year cash flows, fund balance, and returns with the current project portfolio. This volatility leaves the fund vulnerable to uncertainty in project costs and returns, potentially having serious negative
amounts of capital are going toward sustainable projects, while the fund is not growing as quickly as under other models, creating less environmental benefit for the university.
Figure 2.7: Cash flows: 1 project/year
Figure 2.9: Yearly ROI: 10 year time frame
Scenario 2
• Maximum number of projects per year is 3 • Projects only implemented in year 1 • Varying levels of initial capital
3 projects 2 projects 1 project
Return on Investment 31.80% 12.92% 8.00%
Net Present Value -$12,753 -$343,859 -$418,138
Project Expenditure $3,075,000 $2,175,000 $2,105,000
Savings $5,806,909 $4,177,909 $3,987,000
Table 2: 10 year time frame
reinvest the returns in other projects, but rather to just let them accumulate. Using this investing strategy, the fund can dramatically increase its returns above Scenario 1.
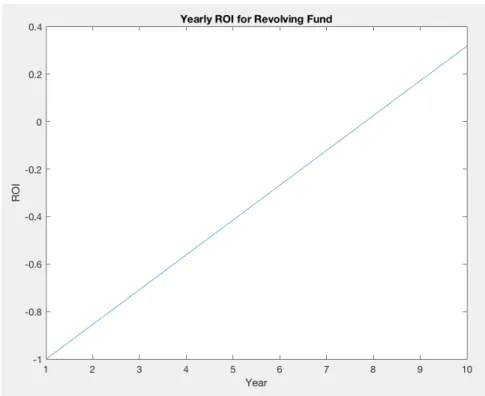
3 Projects in Year 1
Returns dramatically increase when 3 projects are implemented in year 1. When $3,245,000 is withdrawn from the endowment and invested in projects, the 10-year ROI increases to 31.80%, much closer to the average returns for SRFs in higher education. These returns exceed returns for the endowment in year 8, as shown in Figure 3.1, and blow the returns for the endowment out of the water by year 10. These are the highest returns presented in this analysis.
Figure 3.1: Yearly ROI: 3 projects in year 1
2 Projects in Year 1
When the number of projects implemented in year 1 decreases to two, the returns
the endowment. The NPV is still negative under this approach, at -$343,859. This shows that the future discounted returns do not exceed the initial capital investment. However, when directly comparing returns to the endowment, this approach is more successful than Scenario 1.
Figure 3.2: Yearly ROI: 2 projects in year 1
3 Projects in Year 1
Figure 3.3: Yearly ROI: 1 project in year 1
While Scenario 2 presents substantially higher returns, it faces a major tradeoff. Because the fund is only investing in one, two, or three projects, the sustainability impacts of the fund are greatly reduced. When investing in two projects, the fund only sees $4,177,909 in savings, and when only investing in one project, the savings drop to $3,987,000. Both of these scenarios are less of the savings that were seen in Scenario 1, showing a dramatically reduced environmental impact, and hurting the central mission of the fund.
Scenario 3
• Differing number of maximum projects per year • Projects implemented in order of highest returns • Varying levels of initial capital
only withdraws enough capital to fund the projects feasible in year 1. Table 3 shows the results of this model with enough initial capital to fund 3 projects, 2 projects, and 1 project in year 1.
3 projects/year 2 projects/year 1 project/year
Return on Investment -28.97% -14.84% -24.94%
Net Present Value -$1,495,966 -$877,414 -$986,883
Project Expenditure $6,302,916 $3,749,930 $5,860,526
Savings $7,062,892 $5,101,944 $4,812,605
Table 3: 10-year time frame
3 Project-per-year Maximum
Figure 4.1: Yearly fund balance
2 Project-per-year Maximum
Returns when two projects are implemented per year are also lower than the returns for the same parameter in Scenario 1. The initial capital expenditure was $2,345,000 to cover the two highest return projects as well as the fixed costs. The low returns in this scenario could again be due to the lapse in time between projects, and the re-investment in lower return projects as soon as the fund is replenished. Under this scenario, after year 1, another project is not completed until year 6 (Appendix C, Table 8). This reinvestment in year 6 once again drives down returns for the fund, shown in Figure 4.4, meaning that positive returns for the fund are delayed as the money is reinvested in lower return projects than the initial two projects. Investing in fewer projects also lessens the environmental impact of the fund from Scenario 1.
Figure 4.4: Yearly ROI
1 Project-per-year Maximum
Figure 4.5: Yearly fund balance
Conclusion
While the results of this analysis are limited, this thesis provides a viable argument for establishing a revolving fund here at UNC Chapel Hill. Through interviews with other higher learning intuitions, this thesis was able to construct a viable model for a sustainable fund at UNC, based on best-practices, successes, and failures of more experienced funds. With additional hires to manage the fund, the fund should be able to overcome its accounting and financial barriers.
Limitations
Analysis of fund returns were primarily limited by the availability of projects. In order to fill the time periods with projects, the project pool had to include lower-return projects than would likely be accepted by the fund. Three of the five highest return projects that were used in this analysis came directly from the facilities department at UNC, and had been sourced in the three years since the 2015 Energy Report, the source of the majority of the project bank. This shows that UNC facilities are constantly innovating and finding high-return projects. It is likely that the lower-return projects implemented in the later years of this model would be replaced with higher return projects that become available over the next decade, especially as costs of sustainability technologies fall. As a result, the estimations of returns from this model are likely on the lower end of possible returns.
methane and nitrous oxide are $540 and $4,700 respectively.34 In reality, the financial benefits for UNC and North Carolina as a whole of implementing this fund would extend far beyond the scope of this analysis.
This analysis was also limited by the time-frame. Many returns under the scenarios became positive in time frames between 10 and 15 years, (as demonstrated in the 2-project model in Scenario 1) with returns increasing as the time-frame increases. However, in order to create a compelling argument for establishing the fund, this analysis maintained a time frame of 10 years.
Recommendations
This analysis shows that it is feasible to reach returns that beat the endowment within a 10 year time frame. Under Scenario 2, the fund is able to achieve the highest returns by
withdrawing from the endowment only enough capital to cover the costs of the three highest return projects, implementing those projects in year 1, and then allowing returns from those projects to accumulate. The negative returns shown in Scenarios 1 and 3 show the importance of sourcing higher return projects, and the dependence of the fund on those higher return projects. If the returns from the initial capital investments are re-invested in lower return projects, the fund will not see high enough returns within a 10 year time frame.
The University of North Carolina at Chapel Hill should implement a revolving fund with the security that it currently has projects that can be implemented to create returns that beat the endowment within the 10-year time frame. Before the money is withdrawn from the endowment, the fund managers should estimate the initial capital needed to invest in projects, then submit a
proposal to withdraw only that amount from the endowment, to avoid “wasted capital.” If project managers are able to originate more higher return projects than were available for this analysis, they should propose withdrawing more capital from the endowment. The fund should operate with strict limitations on the returns for projects that it implements, only implementing projects that do not bring returns for the fund under the limit for returns set by the endowment. This analysis proves that UNC currently has projects waiting to be funded that would allow for a fund to beat the endowment in under 10 years if the returns from those initial projects are allowed to accumulate and are not re-invested in projects with lower returns.
In order to increase the environmental impact of the fund, the fund managers should continually source and analyze projects to re-invest the fund capital if the projects will not bring the returns of the fund below 8.0%.
Provided with a viable structure and proven returns, UNC has an obligation to investigate the possibility of creating a revolving fund. A revolving fund would help push UNC toward its emissions reduction goals and uphold its promise of financial responsibility to its student body and the state of North Carolina. It would also help UNC keep pace with the rest of the higher-learning community. The number of revolving funds implemented quadrupled from just 2008-2011.35 As more and more universities implement sustainable revolving funds, UNC must not be left in the past.
Bibliography
“About us.” Renewable Energy Special Projects Committee. University of North Carolina at Chapel Hill. http://respc.web.unc.edu/about-us/.
Bierman, Harold Jr., Smidt, Seymour. The Capital Budgeting Decision, 6th edition. New York: Macmillan Publishing Company, 1984.
Casarejos, Fabricio ., Nogueira Frota, Mauricio,. Morten Gustavson, Laura. "Higher education institutions: a strategy towards sustainability." International Journal of Sustainability in Higher Education, Vol. 18 Issue: 7, pp.995-1017. (2017). https://doi.org/10.1108/IJSHE-08-2016-0159.
“Climate action and profitability: CDP S&P 500 Climate Change Report 2014.” CDP. (2014).
https://b8f65cb373b1b7b15feb-c70d8ead6ced550b4d987d7c03fcdd1d.ssl.cf3.rackcdn.com/cms/reports/documents/000/0 00/845/original/CDP-SP500-leaders-report-2014.pdf?1472032950
“Cool Schools 2017 Full Ranking.” The Sierra Club. (2018).
https://www.sierraclub.org/sierra/cool-schools-2017/cool-schools-2017-full-ranking. Cubasch, Ulrich et.al. “Introduction.” Climate Change 2013: The Physical Science Basis (2013).
Cambridge University Press, Cambridge, United Kingdom and New York, NY, USA. https://www.ipcc.ch/pdf/assessment-report/ar5/wg1/WG1AR5_Chapter01_FINAL.pdf. “Fiscal Year 2017 Annual Report.” The University of North Carolina at Chapel Hill Foundation
Investment Fund, Inc. (2018).
https://uncmc.unc.edu/Editor/files/CHIF%20FY%202017%20Annual%20Report.pdf. “Greenhouse Gases at EPA.” US Environmental Protection Agency. Accessed October 5, 2017.
“Greening the Bottom Line.” Sustainable Endowments Institute. (2012).
http://greenbillion.org/wp-content/uploads/2012/11/Greening-the-Bottom-Line-2012.pdf. Ide, Justin. “Gore Boosts a Greener Harvard.” John Harvard’s Journal. Harvard Magazine.
January-February, 2009. https://harvardmagazine.com/2009/01/gore-boosts-greener-harvard.
“Look up salaries of UNC system workers.” Raleigh News and Observer (Raleigh, N.C.). (2018). http://www.newsobserver.com/news/databases/public-salaries/.
“The Princeton Review 2018 College Hopes and Worries Survey Report.” The Princeton Review. (2018). https://www.princetonreview.com/college-rankings/college-hopes-worries.
Romero-Lankao, Patricia., Smith, Joel B. et.al. “North America.” Climate Change 2014:
Impacts, Adaptation, and Vulnerability. (2014) Cambridge University Press, Cambridge, United Kingdom and New York, NY, USA, pp. 1439-1498.
https://www.ipcc.ch/pdf/assessment-report/ar5/wg2/WGIIAR5-Chap26_FINAL.pdf. “Strategic Energy and Water Plan – 2015.” The University of North Carolina at Chapel Hill.
(2015). http://facilities.unc.edu/files/2015/12/State-Energy-Report-2015.pdf. “Sustainability Revolving Loan Fund.” Boston University Sustainability. (2018).
http://www.bu.edu/sustainability/what-were-doing/energy/sustainability-revolving-loan-fund/.
“The Social Cost of Carbon.” US Environmental Protection Agency. (2016).
Appendix B: Other University’s Interview Participants
University Position Email
Robert Haight Arizona State
University Strategic planning, budget analyst [email protected] Lisa Frace Arizona State
University
Associate vice president for Planning and Budget
Brandon Trelstad Oregon State University
Sustainability Officer
Dennis Carlberg Boston
University
Sustainability Director
Dan Dixon University of
Maine
Sustainability Director
[email protected] Shane Stennes University of
Minnesota
Director of Sustainability
Appendix C: Project implementation tables
Project Name Description # Cost Annual
Savings Payback Annual Returns Year implemented Genetic Medicine
Research Bldg Install synchronous drive belts per ESPC 1 70000 21212.12121 3.3 0.3030303 1 Lineberger Cancer
Research Building Airflow reduction and controls upgrade 2 2105000 443000 4.8 0.21045131 1 Glaxo Airflow reduction and
controls upgrade 3 900000 181000 5 0.20111111 1
Phillips Hall Provide VFD on chilled
water pumps 4 30580 4368.571429 7 0.14285714 2
Health Affairs
Buildings Upgrade Wall Packs to LED-70 5 28600 3972.222222 7.2 0.13888889 2 Molecular Biology
Research Lab/Glaxo MBRB Ventilation Reduction per ESCO 6 580000 80555.55556 7.2 0.13888889 2 Kenan Labs Repair mechanical
insulation per ESPC 7 35750 4766.666667 7.5 0.13333333 3 Fordham Hall Airflow reduction and
controls upgrade 8 1370900 160500 8.5 0.11707637 3
Carroll Hall VAV zone controls upgrade 9 706000 78100 9 0.11062323 5 Davis Library High output T8 Lighting
upgrade 10 33696 3702.857143 9.1 0.10989011 5
Friday Center,
William & Ida Lighting Upgrade 11 250000 27472.52747 9.1 0.10989011 5 Graham Student
Union Lighting Upgrade 12 97390 10585.86957 9.2 0.10869565 6
Greenlaw Hall Install dedicated gateway
for EMCS connectivity 13 25000 2500 10 0.1 6
Hamilton Hall Install dedicated gateway
for EMCS connectivity 14 25000 2500 10 0.1 6
Kerr Hall Add VFD’s on preheat 15 20000 2000 10 0.1 7
Manning Hall Install dedicated gateway
for EMCS connectivity 16 25000 2500 10 0.1 7
Education Center
Bldg NC Area Health Upgrade incandescent and MH lighting in health affairs buildings
17 40000 4000 10 0.1 7
Kenan Labs Water retrofit per ESPC 18 23496 2136 11 0.09090909 8
Knapp-Sanders Bldg Lighting upgrade - Atrium 19 45000 4090.909091 11 0.09090909 8 Finley Golf Course
Road, 212 Lighting Upgrade 20 22860 1693.333333 13.5 0.07407407 8
Hanes Art Center Upgrade Halogen and Incandescent to LED - Auditorium
21 57782 4127.285714 14 0.07142857 9
Genetic Medicine
Research Bldg Water retrofit per ESPC 22 55419 3902.746479 14.2 0.07042254 9 Ehringhaus, Hinton
James Replace discontinued fluorescent fixtures with LED
23 175000 11666.66667 15 0.06666667 9
Tarrson Hall Install exhaust fan control to enable occupant scheduling
24 75000 5000 15 0.06666667 10
Knapp-Sanders Bldg Lighting Upgrade 25 57200 3303 17.3175
901 0.05774476 10
Tarrson Hall Upgrade pneumatic terminal unit controls to DDC
26 760500 25671 29.6248
685 0.03375542 10
Project Name Description # Cost Annual Savings Payback Annual
Returns Year implemented Genetic Medicine
Research Bldg Install synchronous drive belts per ESPC 1 70000 21212.12121 3.3 0.3030303 1 Lineberger
Cancer Research Building
Airflow reduction and
controls upgrade 2 2105000 443000 4.8 0.21045131 1
Glaxo Airflow reduction and
controls upgrade 3 900000 181000 5 0.20111111 2
Phillips Hall Provide VFD on chilled
water pumps 4 30580 4368.571429 7 0.14285714 2
Health Affairs
Buildings Upgrade Wall Packs to LED-70 5 28600 3972.222222 7.2 0.13888889 3 Molecular
Biology Research Lab/Glaxo
MBRB Ventilation
Reduction per ESCO 6 580000 80555.55556 7.2 0.13888889 3
Kenan Labs Repair mechanical
insulation per ESPC 7 35750 4766.666667 7.5 0.13333333 4 Fordham Hall Airflow reduction and
controls upgrade 8 1370900 160500 8.5 0.11707637 4
Carroll Hall VAV zone controls
upgrade 9 706000 78100 9 0.11062323 5
Davis Library High output T8 Lighting
upgrade 10 33696 3702.857143 9.1 0.10989011 5
Friday Center,
William & Ida Lighting Upgrade 11 250000 27472.52747 9.1 0.10989011 6 Graham Student
Union Lighting Upgrade 12 97390 10585.86957 9.2 0.10869565 6
Greenlaw Hall Install dedicated gateway for EMCS connectivity
13 25000 2500 10 0.1 7
Hamilton Hall Install dedicated gateway for EMCS connectivity
14 25000 2500 10 0.1 7
Kerr Hall Add VFD’s on preheat 15 20000 2000 10 0.1 8
Manning Hall Install dedicated gateway for EMCS connectivity
16 25000 2500 10 0.1 8
Education Center
Bldg NC Area Health Upgrade incandescent and MH lighting in health affairs buildings
17 40000 4000 10 0.1 9
Kenan Labs Water retrofit per ESPC 18 23496 2136 11 0.09090909 9 Knapp-Sanders
Bldg Lighting upgrade - Atrium 19 45000 4090.909091 11 0.09090909 10 Finley Golf
Course Road, 212 Lighting Upgrade 20 22860 1693.333333 13.5 0.07407407 10
Project Name Description # Cost Annual Savings Payback Annual
Returns Year implemented Genetic Medicine
Research Bldg Install synchronous drive belts per ESPC 1 70000 21212.12121 3.3 0.3030303 1 Lineberger
Cancer Research Building
Airflow reduction and
controls upgrade 2 2105000 443000 4.8 0.21045131 2
Glaxo Airflow reduction and
controls upgrade 3 900000 181000 5 0.20111111 3
Phillips Hall Provide VFD on chilled
water pumps 4 30580 4368.571429 7 0.14285714 4
Health Affairs
Buildings Upgrade Wall Packs to LED-70 5 28600 3972.222222 7.2 0.13888889 5 Molecular
Biology Research Lab/Glaxo
MBRB Ventilation
Reduction per ESCO 6 580000 80555.55556 7.2 0.13888889 6
Kenan Labs Repair mechanical
insulation per ESPC 7 35750 4766.666667 7.5 0.13333333 7 Fordham Hall Airflow reduction and
controls upgrade 8 1370900 160500 8.5 0.11707637 8
Carroll Hall VAV zone controls
upgrade 9 706000 78100 9 0.11062323 9
Davis Library High output T8 Lighting
upgrade 10 33696 3702.857143 9.1 0.10989011 10
Project Name Description # Cost Annual Savings Payback Annual
Returns Year implemented Genetic Medicine
Research Bldg Install synchronous drive belts per ESPC 1 70000 21212.12121 3.3 0.3030303 1 Lineberger
Cancer Research Building
Airflow reduction and
controls upgrade 2 2105000 443000 4.8 0.21045131 1
Glaxo Airflow reduction and
controls upgrade 3 900000 181000 5 0.20111111 1
Table 4. Scenario 2: 3-projects
Project Name Description # Cost Annual Savings Payback Annual
Returns Year implemented Genetic Medicine
Research Bldg Install synchronous drive belts per ESPC 1 70000 21212.12121 3.3 0.3030303 1 Lineberger
Cancer Research Building
Airflow reduction and
controls upgrade 2 2105000 443000 4.8 0.21045131 1
Table 5. Scenario 2: 2-projects
Project Name Description # Cost Annual Savings Payback Annual
Returns Year implemented Genetic Medicine
Research Bldg Install synchronous drive belts per ESPC 1 70000 21212.12121 3.3 0.3030303 0 Lineberger
Cancer Research Building
Airflow reduction and
controls upgrade 2 2105000 443000 4.8 0.21045131 1
Project Name Description # Cost Annual Savings Payback Annual
Returns Year implemented Genetic Medicine
Research Bldg Install synchronous drive belts per ESPC 1 70000 21212.12121 3.3 0.3030303 1 Lineberger
Cancer Research Building
Airflow reduction and
controls upgrade 2 2105000 443000 4.8 0.21045131 1
Glaxo Airflow reduction and
controls upgrade 3 900000 181000 5 0.20111111 1
Phillips Hall Provide VFD on chilled
water pumps 4 30580 4368.571429 7 0.14285714 3
Health Affairs
Buildings Upgrade Wall Packs to LED-70 5 28600 3972.222222 7.2 0.13888889 3 Molecular
Biology Research Lab/Glaxo
MBRB Ventilation
Reduction per ESCO 6 580000 80555.55556 7.2 0.13888889 4
Kenan Labs Repair mechanical
insulation per ESPC 7 35750 4766.666667 7.5 0.13333333 4 Fordham Hall Airflow reduction and
controls upgrade 8 1370900 160500 8.5 0.11707637 7
Carroll Hall VAV zone controls
upgrade 9 706000 78100 9 0.11062323 8
Davis Library High output T8 Lighting
upgrade 10 33696 3702.857143 9.1 0.10989011 8
Friday Center,
William & Ida Lighting Upgrade 11 250000 27472.52747 9.1 0.10989011 9 Graham Student
Union Lighting Upgrade 12 97390 10585.86957 9.2 0.10869565 10
Greenlaw Hall Install dedicated gateway for EMCS connectivity
13 25000 2500 10 0.1 10
Hamilton Hall Install dedicated gateway for EMCS connectivity
14 25000 2500 10 0.1 10
Table 7. Scenario 3: 3-projects/year
Project Name Description # Cost Annual Savings Payback Annual
Returns Year implemented Genetic Medicine
Research Bldg Install synchronous drive belts per ESPC 1 70000 21212.12121 3.3 0.3030303 1 Lineberger
Cancer Research Building
Airflow reduction and
controls upgrade 2 2105000 443000 4.8 0.21045131 1
Glaxo Airflow reduction and
controls upgrade 3 900000 181000 5 0.20111111 6
Phillips Hall Provide VFD on chilled
water pumps 4 30580 4368.571429 7 0.14285714 6
Health Affairs
Buildings Upgrade Wall Packs to LED-70 5 28600 3972.222222 7.2 0.13888889 7 Molecular
Biology Research Lab/Glaxo
MBRB Ventilation
Reduction per ESCO 6 580000 80555.55556 7.2 0.13888889 8
Project Name Description # Cost Annual Savings Payback Annual
Returns Year implemented Genetic Medicine
Research Bldg Install synchronous drive belts per ESPC 1 70000 21212.12121 3.3 0.3030303 Lineberger
Cancer Research Building
Airflow reduction and
controls upgrade 2 2105000 443000 4.8 0.21045131 1
Glaxo Airflow reduction and
controls upgrade 3 900000 181000 5 0.20111111 6
Phillips Hall Provide VFD on chilled
water pumps 4 30580 4368.571429 7 0.14285714 7
Health Affairs
Buildings Upgrade Wall Packs to LED-70 5 28600 3972.222222 7.2 0.13888889 8 Molecular
Biology Research Lab/Glaxo
MBRB Ventilation
Reduction per ESCO 6 580000 80555.55556 7.2 0.13888889 9
Kenan Labs Repair mechanical
insulation per ESPC 7 35750 4766.666667 7.5 0.13333333 10