A systematic review of the literature
By
Crystal PressleyA Master's Paper submitted to the faculty of the University of North Carolina at Chapel Hill
In partial fulfillment of the requirements for the degree of master if Public Health in the Public Health Leadership Program.
Table of Contents
Abstract ... 3
Rationale ... 5
Background ... 6
Methods ... 8
Results ... 12
Other studies not included in analysis ... 19
Discussion ... 26
References ... 35
Abstract
Aim To examine whether intensive glucose control reduces complications including renal insufficiency, visual impairment, neuropathy, or cardiovascular disease in patients with type 2 diabetes.
Methods Systematic review of randomized control trials and prospective observational studies investigating the effect of intensive blood glucose control on diabetic complications in patients with type 2 diabetes published between 1990 and 2007. Studies were identified using
MEDLINE, The Cochrane Library and CINAHL. Reference lists of relevant papers were hand searched for further articles.
Results Two good quality studies met inclusion criteria, UKPDS 33 and UKPDS 35. In UKPDS 33, median HbA,c in the intensive group was 7.0% (95% Cl: 6.2-8.2) and the conventional group was 7.9% (95% Cl: 6.9- 8.8). The reduction in HbA1c correlated with a decrease in certain diabetic complications including blindness and amputation. There was no difference between the control and intervention groups for worsening visual acuity, absent ankle or knee reflexes, orthostatic hypotension, erectile dysfunction, silent Ml, absent peripheral pulses, or evidence of peripheral vascular disease detected by doppler. A 16% reduction in myocardial infarction was border line insignificant with p
=
0.052.Conclusions Limited evidence is available to support the treatment of all patients with type 2 diabetes with intensive blood glucose control. Age, duration of disease, co-morbid
complications, and compliance are some of the factors to be considered in A 1 c target values and these should be determined on an individual patient basis. Several trials are currently underway to provide more insight into the benefits of intensive glucose control to near-normal values. Studies to determine the magnitude of any benefit to lower A1c values to normal and below are not available.
Rationale
In the United States, diabetes is becoming increasingly common as the number of Americans with this disease increased from 5.8 million in 1980 to 14.7 million in 2004. Although some of the increase in incidence is likely accounted for by an increase in screening, diabetes and its complications are major health concerns.' An estimated one-sixth of all health care costs are accounted for by 4.5% of all people with diabetes, and approximately ninety to ninety-five percent of patients diagnosed with diabetes have type 2 diabetes.2
Among people 25-75 years of age, diabetes is the leading cause of end-stage renal disease, non-traumatic amputation, and blindness in the United States. It is also an independent risk factor for stroke and myocardial infarction. Complications from diabetes can be debilitating, so appropriate management early in the disease process is critical.
In efforts to prevent this progression, most current guidelines recommend treating to goal A,c values< 7.0%, fasting blood glucose< 100 mg/dL and postprandial blood glucose levels between 80-150 mg/dL.',.·26'33 However, whether or not these values have been
supported by the evidence remains uncertain. The prevailing assumption suggests that clinical outcomes and quality of life are improved with increasingly tight control of blood glucose to normal values in patients with diabetes; however, this may not be the case. Evidence from the Diabetes Control and Complications Trial (DCCT) has shown that tight control of blood glucose in patients with type I diabetes is beneficial, but it is uncertain whether or not these results can be extrapolated to patients with type 2 diabetes. Additionally, it is possible that most of the benefit from glucose control can be achieved with Hgb A1c levels in the 7-8% range rather than
less than 7.0%.3
Background
In the past, type 2 diabetes mostly occurred in older adults, but today it is becoming more prevalent in younger adults and children. This trend is likely due to increased inactivity and an increase in weight gain and obesity due to poor eating habits and increased
consumption of high fat foods. Initial treatments of elevated blood sugar include changes in diet and increased exercise. In addition, if the patient is overweight, weight loss is necessary and effective. If this is not effective, then drug therapy may be initiated.
In treating type 2 diabetes, it is often difficult to regulate blood glucose with oral medications alone, and therefore insulin must often be utilized as well. The use of insulin can cause other problems such as hypoglycemia, and weight gain, which can also be seen with some oral medications.
In addition to the effect of blood glucose control on the prevention of diabetic
complications, other interacting factors contribute to these processes. Regulation of lipid levels as well as blood pressure values is important. Some of the complications seen in diabetes are due to hypertension and hyperlipidemia; thus, the true value in controlling for blood glucose may not be evident without normalization of blood pressure and lipid levels.
People with type 2 diabetes may be difficult to manage, and the harms of hypoglycemia complicate this problem. High blood sugars affects various organ systems and may progress to serious complications including blindness, kidney damage, lower-limb amputations,2 nerve damage, recurrent infections, and illnesses from a weakened immune system. Renal failure and blindness are major microvascular complications to be avoided.6
Diabetic Complications
developing this disease. This population also has an increased risk for the development of open-angle glaucoma, and cataracts.
Neuropathy. Patients experience reduced vibratory and pinprick sensation, as well as decreased or absent ankle reflexes. Pain, paresthesias, or hyperesthesia also occur. The development of neuropathies in patients with diabetes often leads to further complications such as ulcers and trauma to the feet unknown to the patient because of the lack of sensation. These lesions become infected in part by the lack of care to these injuries, but also in part by vascular insufficiency which contributes to poor healing. The development and progression of an infection can lead to osteomyelitis which is extremely difficult to treat in patients with diabetes and possibly to amputation.2 More than 60% of nontraumatic lower limb amputations are due to diabetes.3
Neuropathy of the cardiac nerves most likely contributes to the large number of silent myocardial infarctions seen in patients with diabetes.
Autonomic neuropathy is also responsible for erectile dysfunction which occurs in up to 75% of men with a long history of diabetes.
Macrovascu/ar. The development of coronary artery disease is two-fold higher in men and three-fold higher in women with diabetes.3 Cerebrovascular disease including stroke, peripheral vascular disease, and amputations are also major complications. Low HDL levels are associated with insulin resistance, and low HDL contributes to atherosclerosis.
Intensive therapy
the intervention group to 7%.5 The goals of the UKPDS also had the goal of normalizing blood sugar levels, but used oral agents as well in their definition of intensive therapy. The current inclusions of intensive therapy also include aggressive treatment for associated conditions such as hypercholesterolemia and hypertension. Weight loss, exercise, diet modifications, and frequent monitoring of plasma glucose levels are included as other intensive therapies.
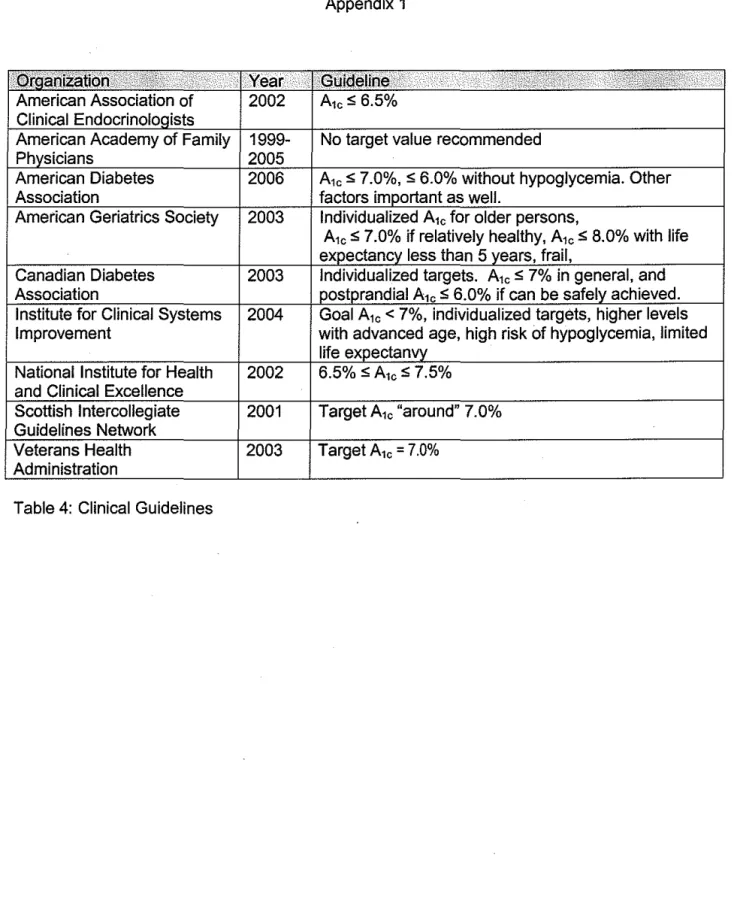
Studies have shown that glucose control in patients with type 2 diabetes decreases the complications from this disease, and guidelines for treatment are created based on these results. These guidelines recommend intensive treatment to maintain tight glycemic control and obtain A,c values below 7%. A summary of the guidelines is included in the appendix.33 Most of the evidence for type 2 diabetes, however, is either based on intermediate outcomes such as retinopathy and microalbuminuria, or is concluded from findings in studies of type 1 diabetes.
The purpose of this systematic review is to examine patients with type 2 diabetes to see (1) whether the current available evidence supports intensive glucose control to near-normal levels in order to decrease or prevent diabetic complications, including renal insufficiency, visual impairment, neuropathy, and cardiovascular events, and (2) the magnitude of the benefit, if any, of achieving A,c values below 7.0%.
Methods Population
Population for review comprise all patients with type 2 diabetes and complications include visual impairment, renal insufficiency, neuropathy, and cardiovascular events.
Search Strategy
English. I focused on studies that addressed blood glucose control in human subjects with type 2 diabetes, and the occurrence of complications at varying A,c levels. Initial MeSH terms included "Diabetes Mellitus, Type 2" and "Hemoglobin A, Glycosylated". This search yielded 894 articles which I further narrowed by relevance to blood glucose control. 553 articles remained and further narrowed by those that discussed diabetic complications with the MeSH subheading "complication". This resulted in 101 articles for title and abstract review. Exclusion of articles occurred if the primary focus of reducing the progression of complications was any method other than glucose control and lowering A 1 c values. Other methods include blood pressure control, lipid reduction. Studies where the primary outcome was to compare the efficacy between two drugs in lowering blood glucose, the primary outcomes were intermediates of clinical disease such as retinopathy, neuropathy, or nephropathy, and screening or diagnosis was the focus were also eliminated. Searches specific to cardiovascular disease, renal
insufficiency, visual impairment, and nerve damage in conjunction with blood glucose control in type 2 diabetics resulted in smaller subsets of articles reviewed for relevance with the same criteria as above applied. The references for relevant papers were hand searched for further articles. Two papers met the outlined criteria and are the focus of this review. A summary of these studies is presented in table 2 below. Two other studies also addressed the purpose of this review and warrant discussion. This search process is outlined in diagram 1.
Inclusion/exclusion criteria
Articles were chosen if they addressed type 2 diabetes, diabetes management,
52
e.
4483
a.
894
b.551
c. I101
d.~I
153
f.
I I2
g.
3589
Not meet b.
343
Not meet c.
450
Not meet d.
151
excluded
2
h.
Diagram 1: Search strategy for the effect of intensive glucose control on diabetic complications in type 2 diabetics.
Numbers represent remaining studies after lettered criteria.
a: Initial search with MeSH "Diabetes Mellitus, Type 2", "Hemoglobin A, glycosylated" yielded 4483 results
b. Search then limited to English, RCTs, Human subjects, 1990- September 2007 and yielded 894 results
c. MeSH subheading "blood glucose control" applied to search and resulted in 551 articles. d. Search further limited by applying subheading "complication" and its derivatives. 101 results.
e. studies found in separate searches of renal insufficiency (32), visual impairment (12), amputation (3) with MeSH "Diabetes Mellitus, Type 2", "Hemoglobin A, glycosylated" and hand searched articles (5). f. Studies for which titles and abstracts reviewed
g. Remaining studies for review of evidence
Quality Criteria
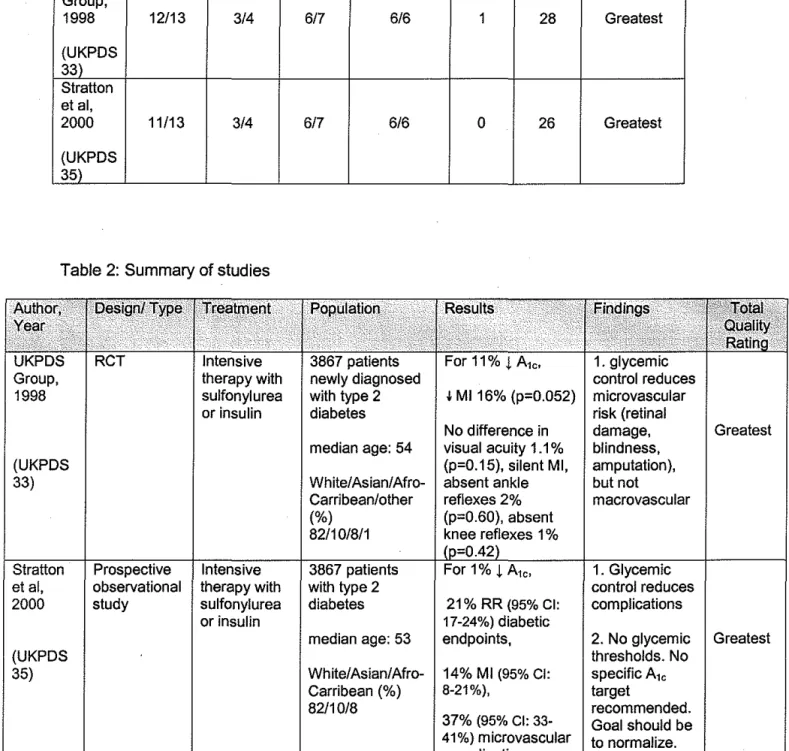
The studies were reviewed with the quality checklist for RCT's and Observational Studies of Treatment Studies.10 The full checklist is included in Appendix 2 and ratings of the studies are listed in Table 1 below. The studies are graded on reporting, external validity, internal validity with respect to bias and confounding, and the use of a power calculation.
The studies were also graded on the suitability of the study design for assessing effectiveness. The categories of greatest, moderate and least characterize the suitability. A quality score of greatest indicates the study design contains comparison groups and prospective exposure and outcome measurements. Moderate indicates retrospective designs or multiple pre/post measurements with no concurrent comparison group. Least indicates a design with a single pre/post measurement, no concurrent comparison group or simultaneous measurement of exposure and outcome. Descriptions of these are included in Appendix 3.
Results
Table 1: Quality rating of studies
Author, Reporting External Internal Internal Power. Total Suitability of Year Validity Validity: Validity: · .. Quality study to
•• · ...
. ·.
···
. .Elias Confounding Score assess
I .· .. effectiveness
UKPDS Group,
1998 12/13 3/4 6/7 6/6 1 28 Greatest
(UKPDS 33) Stratton et al,
2000 11/13 3/4 6/7 6/6 0 26 Greatest
(UKPDS 35)
Table 2: Summary of studies
Intensive therapy with
sulfonylurea t Ml 16% (p=0.052) microvascular
or insulin risk (retinal
No difference in damage, Greatest median age: 54 visual acuity 1.1% blindness,
(UKPDS (p=0.15), silent Ml, amputation),
33) White/Asian/Afro- absent ankle but not
Carribean/other reflexes 2% macrovascular (%) (p=0.60), absent
82/10/8/1 knee reflexes 1%
et al, observational therapy with with type 2 control reduces 2000 study sulfonylurea diabetes 21% RR (95% Cl: complications
or insulin 17-24%) diabetic
median age: 53 endpoints, 2. No glycemic Greatest
(UKPDS thresholds. No
35) White/ Asian/ Afro- 14% Ml (95% Cl: specific A10
Carribean (%) 8-21%), target
82/10/8 recommended.
37% (95% Cl: 33- Goal should be 41%) microvascular to normalize.
UKPD833
In 1997 the UK Prospective Diabetes Study (UKPDS) group completed a randomized control trial enrolling 3867 of 7616 referred, newly diagnosed patients, ages 25-65, recruited by referral from general practitioners in 23 different area hospitals. Patients were followed over a median of 1 0 years to investigate the risk of diabetic complications in patients with type 2 diabetes when treated with intensive blood glucose control. Intensive control aimed to have fasting plasma glucose levels less than 6 mm/L (108 mg/dl). The control group was treated with diet modifications to achieve a fasting plasma glucose less than 15 mmoi/L (270 mg/dl).
Patients were eligible for enrollment if they had fasting plasma glucose greater than 6 mmoi/L (108 mg/dl) on two mornings that were one to three weeks apart. This value is slightly above the upper limit of normal for the study reference range. Patients were excluded if any of the following conditions were present: ketonuria greater than 3 mmoi/L ( 17 mg/dl), serum creatinine greater than 175 t~moi/L (1.97 mg/dl), myocardial infarction within the last year, current angina or heart failure, more than one major vascular event, retinopathy requiring laser treatment, malignant hypertension, uncorrected endocrine disorder, an occupation preventing insulin therapy, severe concurrent illness limiting life expectancy or requiring extensive systemic treatment, an inadequate understanding of the study and its purpose, or unwillingness to enter the study.22
Patients were stratified by body weight, and those not overweight randomized to intensive treatment with conventional diet (30%), insulin (30%), sulfonylurea (40%).
initially comparable with respect to age (mean 53 yrs), ethnicity (81% white), BMI (27.5), A1c (7.05%), fasting plasma glucose (8.0 mmoi/L, 144mg/dl), and plasma creatinine (81mmol/l, 0.91 mg/dl), among other factors. The conventional group had a marginally higher percentage of men (1.63% vs 1.46%) and the intensive group had a slightly higher percentage of patients on digoxin (1.3% vs 0.9%). The potential for selection bias is minimal and controlled with
randomization.
This study also examined the differences in medications used to achieve glycemic control. Those medications used for intensive glucose control included one of three different sulfonylureas (chloropropamide, glibenclamide, or glipizide) or insulin.
Approximately 4.4% of the participants were lost to follow up. The vital status was not available for 76 (2%) patients, with 57 from the intensive group and 19 from the conventional group .. An additional 91 patients (2.4%) were unable to be reached near the end of the study to gather final information. The randomization was done with an intensive control ratio of 70/30 to ensure adequate comparison, so approximately equal numbers were lost from each group. It was also necessary to use medications for some of the patients randomized to the conventional group in order to maintain a fasting plasma glucose level below 15.0 mmoi/L. Only 58% of person-years of follow up in the conventional group were treated with diet alone. A sulfonylurea was used alone or in combination with another medication in 25% of person-years of follow up, insulin in 16%, and metformin, alone or in combination, in 20%. Selection bias at this stage is also minimal since recommendations to add medications were made centrally based on glucose levels received. The patients were then randomized to various other medications for treatment as needed.
year, and then annually. A random urine sample was taken yearly to measure albumin and creatinine. A full exam was done every three years with exams of visual acuity,
electrocardiogram, chest x-ray, retinal photographs, lower extremity reflexes and measurements of autonomic neuropathy. Treatment allocation of the patients was concealed from the staff performing and analyzing these exams. Visual acuity, sensation and reflex, as well as renal failure are measured rather than solely retinopathy, micoalbuminuria, and nerve conduction velocity, which are intermediate outcomes. This improves the accuracy or validity of the study. The measurements are performed in a lab with strict protocols or with consistent staff which improves the reliability.
Measurement bias could however occur with the survey questions that are asked at each visit. It requires the patient to recall information which may be incorrect. Also in reporting home glucose measurements, patients may report better blood glucose readings than they actually had to in order to please the physician, or make themselves look better. They may also be influenced when reporting side effects that may or may not be significant. The method of randomization is valid and data from table one on the control and intervention groups shows gdod comparability. Definitions of twenty one clinical endpoints were predefined including myocardial infarction, major stroke, blindness, and renal failure. Overall, measurement bias is low since most of the data is quantitative.
Results showed a median HbA1c that was significantly lower in the intensive versus conventional group with values and 95% confidence intervals of 7.0% (6.2-8.2) and 7.9% (6.9-8.8) respectively, p<0.0001. This represents an 11% decrease in the HbA1c value (from 7.9% to 7.0%) over ten years. The reduction in HbA1c correlated with a decrease in certain diabetic complications including retinal damage, blindness and amputation. Those in the intensive group had a 25% (p=0.0099, 95% Cl: 0.06-0.93) risk reduction in microvascular endpoints compared to the conventional treatment group. The majority of this reduction was due to a decrease in the number of cases of photocoagulation treatment. There was no difference between the control and intervention groups for worsening visual acuity, the proportion of patients blind in both eyes, absent ankle or knee reflexes, orthostatic hypotension, erectile dysfunction, silent Ml, absent peripheral pulses, or evidence of peripheral vascular disease detected by doppler. Although the number of patients who developed renal failure or died from renal disease was small, a
decrease in the percent of patients with a two-fold increase in plasma creatinine or plasma urea occurred by 67% and 74% respectively. A 16% reduction in myocardial infarction was border line insignificant with p = 0.052.
The results of this study provide useful information to create guidelines for treating patients with type 2 diabetes. Lowering blood glucose decreased microvascular disease including renal failure, death from renal failure, retinal photocoagulation, and vitreous
hemorrhage, but achieved no definitive effect on visual acuity, peripheral vascular disease, or nerve sensation. Benefits not directly related to clinical symptoms, included decreases in intermediate markers such as serum creatinie and urine albumin. Also, the study showed improvements in diabetic complications with a median A1c of 7.0%. However, this value was difficult to achieve and maintain over the ten years of the study and may not be a realistic target. The significance of the benefit to maintain A1c values at and below 7% remains unclear.23
UKPDS35
The UKPDS group performed several other embedded studies to further characterize the relationship between factors such as hypertension and hyperglycemia on macrovascular and microvascular complications in patients with type 2 diabetes.5•6•7 Of these studies, one
specifically addresses the effect of intensive glycemic control on clinical outcomes of diabetic complications. The UKPDS 35 is a prospective observational study which investigated the development of diabetic complications over time in relation to plasma glucose. This data was compared to the results of the UKPDS intensive glucose control trial. 5 Any end point or death related to diabetes was a primary clinical aggregate outcome. Secondary aggregate outcomes included myocardial infarction, stroke, amputation (including peripheral vascular disease), and microvascular disease (primarily retinal photocoagulation). Non-fatal heart failure and cataract extraction were single endpoints.
conventional treatment or intensive treatment with a sulfonylurea or insulin. Conventional treatment consisted mainly of diet modification. The average age was 53 years, sixty percent of participants were male, eighty-one percent white, BMI of 27.5 and an A,c of 7.1.
Results were stratified by A1c value and were < 6.0% with a median value of 5.6%, 6.0%
to 7.0% with median value of 6.5 %, 7.0% to 8.0% with median value 7.5%, 8.0% to< 9% with median value of 8.4%, 9.0% to 10% with median value of 9.4%, and ;;:1 0% with a median value of 1 0.6%. The range was 4.6 to 11.2%.
The data presented in table 1 of the study showed good correlation between the patients in the two comparison groups, observational and UKPDS trial. Confounders were controlled for in the proportional hazards regression model used, the Cox model. Potential confounders accounted for include sex, age, ethnic group, smoking (current/ever/never) at the time of diabetes diagnosis, baseline HDL and LDL, triglycerides, presence of albuminuria after three months, dietary treatment, and systolic blood pressure."·7
The results showed an adjusted incidence rate of diabetic complications that increased with increasing A,c values. Over the range of increasing glycemic index values, the increase in incidence rate for microvascular end points was greater than the incidence rate for myocardial infarctions. For each 1% reduction in A1c level, there was an associated decrease in risk of 37%
for microvascular endpoints, 43% for amputations or death from peripheral vascular disease, and 14% for myocardial infarction. The incidence of a myocardial infarction was two to three times that of microvascular complications around normal values of A,0 , but as the A,c reached higher values in near the maximum range (A1c of 10% or greater) , the risks were similar.
30
Other Studies
outcomes can progress to complications, they do not directly correlate with the degree of clinical symptoms and health deterioration of the patient. The following studies measured intermediate outcomes as well as clinical outcomes such as visual acuity, or neuropathy, but report
intermediate outcomes. The findings in these studies are relevant to discuss because they have been used to create the guidelines in practice today, and it is important to determine whether the evidence in any way substantiates tight glycemic control and target HbA,c values below?%.
Kumamoto Study This study focused on Japanese patients with type 2 diabetes.2'8 In this eight
year randomized control study, researchers determined the effects of glucose control on preventing diabetic complications as well as the effects of glucose control on preventing the progression of diabetic complications. Two intervention groups were created. Intensive insulin therapy for patients with type 2 diabetes, but no retinopathy or nephropathy at baseline
comprised the first group. The effect of intensive insulin therapy on the progression of simple retinopathy and nephropathy (urinary albumin excretion level < 300 mg/24 hour period) at baseline was investigated in a second cohort. 8
The goal of the control group was to have a fasting blood glucose level less than
characteristics of patients within the two groups did not differ significantly with respect to age, sex, duration of diabetes, BMI, urinary c-peptide excretion, HbA1c. serum cholesterol,
triglycerides, and HDL, degree of retinopathy, urinary albumin excretion and nerve conduction velocity.
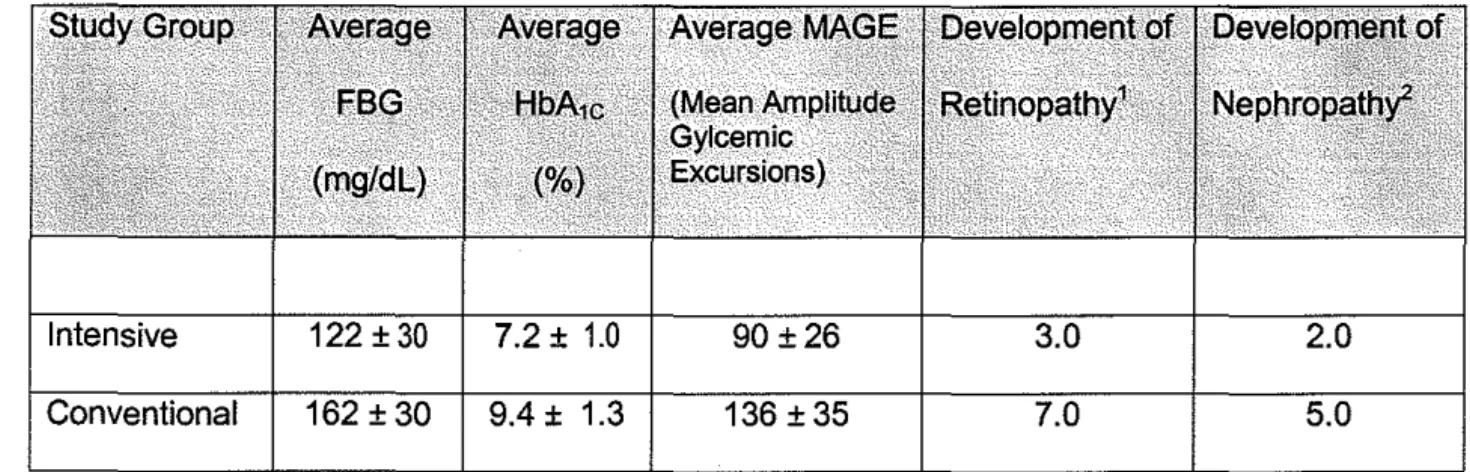
The eight year results showed that normoglycemia was nearly achieved and maintained for the duration of the study in the intensive intervention group as opposed to the group with less stringent control. Results are summarized in table 3 below. There seemed to be significant differences in neuropathy between the two groups with improved nerve conduction velocities in the group where blood glucose levels and HbA1c were lower. Intensive blood glucose control
with insulin delayed the onset and progression of retinopathy and nephropathy as well. While improvement in microvascular complications seemed to be improved, no definitive conclusions could be drawn with regards to macrovascular complications, There was a slight increase in microvascular complications iri the conventional therapy group compared to the more tightly controlled group, but the significance could not be determined likely due to the small sample size used in the study. The recommendations from this study of HbA1c below 6.5%, fasting
blood glucose below 110 mg/dL, and 2-hour postprandial glucose concentration below 180 mg/dL were made based on the observation of no worsening retinopathy or nephropathy below these levels.
Table 3: Kumamoto Study Results over the eight year study period
122±30 7.2± 1.0 90±26 3.0 2.0
162 ± 30 9.4 ± 1.3 136 ± 35 7.0 5.0
FBG: fasting blood glucose p < 0.05 MAGE: mean amplitude of glycemic excursions 'Events per 100 patient years p=0.023 2Events per 100 patient years p=0.043
It should be noted that the target values used in this study are above the more stringent recommended guidelines offasting blood glucose level of less than 100 mg/dl and postprandial levels of 80-150 mg/dl. The study population also consisted of non-obese, hypoinsulinemic insulin requiring type 2 diabetic patients. The study was small with only 110 subjects and they were all men. Also, this study is not likely not generalizable to people in America where there is a higher prevalence of obesity and sedentary lifestyle. The subjects in this study were actually quite lean, which is not characteristic of the majority of type 2 diabetic patients seen in the US. This study did not comment on other changes that may have been contributory to improved outcomes such as diet and exercise.
for the HbA1c values for the two groups over eight years were 7.2% ± 1.0% in the tightly controlled group versus 9.4% ± 1.3% in the control group and fasting blood glucose averages were 122 ± 30 versus 162 ± 30 respectively. 8 With this comparison it is not clear as to whether the differences seen would be as significant as or equivocal to a decrease in HbA,c values that are much higher. It still needs to be determined whether or not a greater a health benefit is achieved to decrease HbA1c values from 11% and 12% to 8% and 9% than there is to reduce
HbA1c values in patients with type 2 diabetes below 7.0%. No study has examined this question.
Molyneaux et ai9_An Australian study by Molyneaux, Constantino, McGill, et al was organized to determine the correlation between glycemic control and risk reduction in patients with type 2 diabetes. In addition they compared these results to those found in the Diabetes Control and Complications Trial, which addressed the same question for patients with type 1 diabetes. Data on patients was taken from a database containing information on patients with type 2 diabetes who attended a Complications Assessment Service more than once. Patients were referred by their primary care physician for and initial evaluation and at varying follow-up intervals from 1-4 years. Evaluation included retinal examination, visual acuity, morning spot urine sample to determine microalburninuria, and lower extremity sensory exam, as well as reflexes and pulses. A,c, lipids, and routine biochemistry tests were also performed. The data represented diabetic complications over time from initial development with respect to glycemic control. Retinopathy constituted any diabetic retinopathy development on retinal exam, and microabbuminuria as a urinary albumin concentration greater than 30mg/l.
399 of these patients had no signs of microalbuminuria initially and were followed for its
development. There was a 60% follow-up rate and the only reported difference between those who did follow-up with a subsequent visit and those who did not was the percent of each group treated for diabetes with an oral hypoglycemic agent. 63% of those who returned versus 55% of those who did not were using an oral agent.
The mean of serial HbA1c values was used in calculations and the results showed a linear relationship between the In (HbA1c) versus both retinopathy and microalbuminuria.
Similar results were found in the DCCT study. Risk reductions for each of these complications were calculated for a 10% HbA1c reduction. The annual incidence for retinopathy was 5. 7% (95% Cl: 4.0-7.2) and 8.3% (95% Cl: 5.7-10.9) for microalbuminuria. There was a statistically significant relative risk reduction, 24% (95% Cl: 16-32) associated with a 10% lower mean HbA1c value for retinopathy. The reduction found in the DCCT was 35% (95% Cl: 29-41 ). The relative risk reduction of 9% (95% Cl: -2-19) for microalbuminuria was not statistically significant. The DCCT trial showed a reduction of 25% (95% Cl: 19-32) for patients with type 1 diabetes. In regards to retinopathy, reducing the A1c value from 11% to 9.9% reduced the absolute risk by three cases per 100 patient years. Reducing the A1c value from 8.0% to 7.2% reduced the
absolute risk by one case per 100 patient years. This suggests that with higher A,c values, there is a greater risk reduction associated with controlling blood glucose levels and lowering the A1c value. This trend is not seen to the same extent with microalbuminuria. An A,c reduction from 11% to 9.9% reduced the absolute risk 0.8 cases per 100 patient years and 0.6 cases per 100 patient years when decreasing A1c levels from 8.0%-7.2%. Also, with A,c levels ;::8.0% and
,;;8.0%, there was no significant difference in the risk gradient for retinopathy or microalbuminuria and therefore no threshold for A,c level could be determined.
likely due to other factors that may relate to albumin excretion. It was also noted that they did not account for confounders such as blood pressure and lipid values.
Although this study has raised some interesting findings and tried to address the question of whether or not there is a limit to the benefit of reducing A,c levels, there are some problems. This study was not a randomized control trial, but rather an observational study that included beginning and end points in the analysis without a sense of the progression of disease. Patients were referred by their physicians for both initial and follow-up visits. Physicians may have referred patients they felt would be compliant more than those they felt would not follow-up. It was also stated that the only difference between those in the study and those lost to follow-up was the proportion taking oral medications, but only ranges are given as opposed to a more detailed, direct comparison of the groups. Also the factors used for analysis are retinopathy and microalbuminuria. While it is known that these conditions eventually progress to visual
Discussion
The purpose of this search was to determine whether or not the evidence supports intensive glucose control, and if so, how much of a benefit is realized with A 1 c values below 7.0%. Limited published evidence is currently available to support the treatment of all patients with type 2 diabetes to near normal levels.
Hyperglycemia is an independent risk factor for microvascular and macrovascular complications and glycemic control does improve health and decrease these complications. However, studies have not proven the degree of glycemic control that results in maximal benefit. Using normal A1c values as targets intuitively seems to be a logical goal, but achieving A1c values less than 7.0% in patients with diabetes may not have the degree of benefit anticipated. The impact of A1c values below 7.0% on complications may be insignificant as lower values are approached. There may also be legitimate benefit to control A1c values below 7.0%, but the studies are not present to provide data that will allow such determinations to be made. It is necessary to perform studies that examine clinical end-point outcomes, instead of intermediate outcomes, to determine the relationship between glucose control and improved health. The gain from maintaining glucose levels to normal levels may decrease as A 1 c level decreases below 7%. There may be more benefit to decreasing A1c values from high values (>8.0%) than in decreasing A 1 c values in patients from 7% to below. Furthermore, the risk of hypoglycemia may outweigh any benefit that can be obtained with stringent control.
Two trials are currently underway which are looking to determine the relationship between glycemic control and clinical outcomes.
prior cardiovascular events, or the presence of cardiovascular disease risk factors. Patients must also have a baseline A1c value of 7.5% and above. The target for glucose control in the control group was chosen to avoid the increase in microvascular events seen with A 1 c levels above 8%.
This study also aims to investigate whether or not the benefits of glycemic control outweigh the risks of potential hypoglycemia. No chronic effects have been shown in previous studies, but the ACCORD trial is evaluating this in an older patient population with
cardiovascular risk factors. The efficacy of current medications in achieving normoglycemia is also a goal of this study. If glucose control is not possible with current available therapies, it will be difficult to study intensive glycemic control. The results of this study will provide evidence of the relationship between glycemic control and a specific clinical outcome. Whether or not stringent glycemic control actually decreases the events of cardiovascular disease can be ascertained. This study does not however indicate which cardiovascular events it will target.
In February 2008 the National Institute of Health announced the termination of the intensive blood glucose lowering treatment portion of the trial.34 257 deaths occurred in the intensive treatment group compared to 203 deaths in the standard treatment group. This is equivalent to about 3 deaths per 1,000 participants a year over a four year average. Data review indicated that lowering blood glucose with intensive treatment causes harm in high risk cardiovascular patients with type 2 diabetes. A specific cause of death has not been
determined. The intensive group will begin the same treatment as the standard treatment group. These findings are strong evidence against recommendations for intensive glucose control, but this study population consisted of high risk patients. This result may not be true for patients with lower risk or who are younger, as ages ranged from 40 to 85. The trial is expected to conclude in June of 2009.
outcome. Change in visual acuity is also an endpoint of interest. The study was started in December of 2000 with a 2 year accrual period and 5-7 years of follow-up. 1700 patients were enrolled. The subjects in this study are 41 years of age or older and have an A 1 c level ~8.3%, which is four standard deviations above the mean for normal levels. These patients have failed oral therapy and possibly insulin therapy. This study will be useful to determine the role of tight glucose control in preventing major cardiovascular events, as well as in determining if tight glucose management causes cardiovascular complications as suggested in previous studies. Quality of life and cost analysis is also a part of this study.
This study observes those patients with the worse glucose control and may still not directly correlate to benefits or risks that may be seen in patients with less extreme
hyperglycemic issues. While it answers an important question, studies are still needed to address renal failure, and neuropathies. A patient population must also be studied that is representative of subpopulations including various ages, complications, and degrees of hyperglycemic control.
Other Evaluations based on available evidence
Woolf, Davidson, Greenfield, et. al. also examined the benefits and risks of glycemic control specifically for patients with type 2 diabetes and the implications that these benefits and risks have on clinical practices. 26 The evidence used was obtained from randomized control trials and observational studies on glycemic control and the effects on microvascular and macrovascular complications, as well as adverse outcomes. Evidence from randomized control trials showed that lowering blood glucose to normal or near normal levels reduces the risk of microvascular and neuropathic complications although the affect on macrovascular
outcomes as a primary endpoint. Therefore, an effect could not be proved because of a lack of statistical power and duration in the studies. 26
The use of intermediary observations such as retinopathy does not necessarily correlate with the degree of visual deterioration, which is the outcome of importance. Analysis of the evidence using retinopathy as an outcome as opposed to visual acuity therefore does not accurately predict the affect of the degree of blood glucose control. However, in both the control and intervention groups in the DCCT and UKPDS trials, the occurrence of end stage
microvascular complications including blindness, amputation, and end stage renal disease was relatively uncommon. 19 This may account, at least in part, for the reason these values are not used. The study length would need to be much longer to capture, or a different study population used. The alternative is that normalization of blood glucose has beneficial health outcomes in reducing blindness, neuropathy and renal failure, but the risks outweigh the benefits with goals that are too stringent.
The conclusions drawn by Woolf, Davidson, Greenfield, et al. emphasize that several factors must be taken into consideration when determining the degree of blood glucose reduction in order for a particular patient to receive maximal health benefits. This degree will vary by patient and is dependent on the state of overall health of the patient including the life expectancy as well as the presence of a comorbid disease. The development of symptomatic disease from microvascular complications takes years to develop, so it is necessary to
determine whether or not the risk of complications within a certain time frame warrants a particular level of blood glucose control. 26 The risk of occurrence and degree of severity of hypoglycemia is also important. The risk of hypoglycemia to a degree that causes further complications or a decrease in quality of life as well as complications caused by the medications themselves should be considered. Serious, although uncommon, complications include
issue for some patients. It is uncertain as to how the amount of weight gain observed affects overall outcomes.
Complications from diabetes can result in impaired vision or neuropathy can impair a patient's ability to recognize hypoglycemia as well as one's ability to adjust medication doses. Insulin overdose can occur in patients who have renal disease secondary to a decrease in breakdown of insulin. These reasons make it necessary to modify the desired level of blood glycemic control. Determining the level of benefit from glucose control is also complicated because the degree of benefit is related to the patient's baseline disease severity with respect to preexisting microvascular complications, and A1c value. 26
Other considerations for guideline development
In many studies, patients with significant microvascular disease
were
excluded from the trials. Therefore, decreases seen in microvascular complications is relevant to patients with none or mild microvascular complications from diabetes and without other medical issues.19 Similar improvements in microvascular complications secondary to diabetes can not beA large percentage of the population who have type two diabetes have A1c values above 9.5 percent. For this population it may be more beneficial in the management of their diabetes to lower the A1c values to moderate levels. Greater absolute health benefits are seen when hyperglycemia which is increased substantially is reduced compared to the same magnitude of reduction in a person with hyperglycemia that is moderate and below. It is possible that there is more value in lowering patients with A1c values > 9.5 to less than 9.5, than to lower patients with
moderate glycemic levels to normal values.26 There is disagreement in the literature as to whether or not thresholds exist for diabetic complications. Therefore, the assumption that decreasing A1c values below 7.0 is of benefit is less clear. Although it seems that patients with
3
°
Further research is needed in this area. The cost of achieving lower values may far outweigh any benefit that may be gained. A specific recommendation to implement for the general
population of patients with diabetes does not take into account several of the above mentioned factors, including life expectancy, co-morbidities, and absolute health benefit.
Hyperglycemia over a sustained period of time leads to several complications. The progression to blindness, renal failure, nerve damage, and cardiovascular events is based on several factors including the degree and period of exposure to hyperglycemia. This progression is often monitored by intermediates that include retinal changes on visual examination,
microalbuminuria, and nerve conduction velocities. These intermediates are useful for
determining worsening disease, but these measures do not indicate the magnitude of worsening disease. Current guidelines are based on evidence related to improvement in these
intermediate outcomes.
The implications of these guidelines not only directly affect the health of patients with diabetes, but also shape the way treatment is provided. Pay for performance measures are based on the use of certain guidelines. Physicians must meet certain standards and have certain patient outcomes based on set guidelines. Treating to achieve laboratory values risks neglecting possible unique needs of the individual patient and may not improve the quality of life.
As mentioned above in the ACCORD trial, it is necessary to make sure that it is possible to achieve the targets set in guidelines with current available therapies. It is also important to recognize the role of other factors such as the patient's lipid profile in microvascular and macrovascular disease and making certain that glucose control is primarily responsible for complications. The use of a large portion of health resources are used in diabetes management and it is essential that the intended benefit is realized. New data from future studies will
hopefully make treatment goals more clear and lead to appropriate allocation of resources and patient care.
Some conclusions in favor of a benefit for aggressive blood glucose control are based on modeling. In particular, the Markov model has been used to extrapolate data from type 1 diabetic studies and predict the effects of varying degrees of glucose control in patients with type 2 diabetes.22 Increasing costs of more aggressive diabetes control necessitates the need to determine if a true health benefit exists for aggressive control. Some studies report a decrease in the risk of microvascular complications by 40% for every one point decrease in percentage point in A, c. 2 With this generalization it is important to determine whether this benefit occurs for all values of A1c. or if there reaches a point at which further decreases in A,c
do not correlate to this degree of benefit, if any at all.
It is important to remember that many people have other health problems that complicate the effects of their diabetes mellitus on various organ systems and must be considered in developing therapies for diabetes management.
outcomes.22 With or without depression, mental confusion increases the likelihood of improper medication administration that could lead to hypoglycemia and adverse effects.
The presence of disability from neuropathies or arthritic joint changes also affects overall health. The signs of hypoglycemia in elderly patients are often confusion, dizziness, and
delirium, as opposed to more adrenergic side effects.22Various therapies, both oral and with insulin have different effects on hypoglycemia, and can be especially dangerous in patients with impaired renal function, which can occur naturally in older patients irrespective of their diabetic state and level of glucose control.
Regulation of blood sugar to normal values requires more than diet and exercise in most type 2 diabetics, and complications from oral medications such as hypoglycemia and insulin must be taken into account. The age of onset and duration of diabetes in the patient contributes to the plan and goals for treatment. Mixed information exists as to the benefits of glucose control in people who have recently developed this metabolic disorder and those who have been living with diabetes for several years.4
Limitations
A major limitation is the lack of randomized control trials available that address the particular question. However, two trials are currently underway as noted above. The search criteria eliminated any studies with drug comparisons as the main focus. These studies may offer some information on the topic and indirectly answer the questions. This could be examined in a future review.
created that are effective in order to achieve normal levels of control. In addition, the degree of benefit to normalization of glucose levels should be significant enough to warrant
References
1. Camacho P, Pitale S, Abraira C. Beneficial and detrimental effects of intensive glycaemic
control, with emphasis on type 2 diabetes mellitus. Drugs & Aging. 2000;17(6):463-476.
2. Diabetes Data and Trends. Center for disease control and Prevention. Available at
http://www.cdc.gov/diabetes/statistics/prev/national/figpersons.htm. Accessed April14,
2007.
3. Liberman, SA. Diabetes Mellitus. Fishman MK, Hoffman AR, Klauser RD, Thaler MS.
Medicine. 5'h ed. Philadelphia, PA: Lippincott and Williams, 2004: 213.
4. Gaster B, Hirsch lB. The effects of improved glycemic control on complications in type 2
diabetes. Archives Internal Medicine. 1998;158:134-140.
5. American Diabetes Association. Implications of the United Kingdom Prospective Diabetes
Study. Clinical Diabetes. 1999;17
6. Diagnosis of Diabetes. National Diabetes Information Clearinghouse (NDIC). Available at:
http://diabetes.niddk.nih.govldm/pubs/diaqnosis/index.htm Accessed April 17, 2007
7. Stratton IM, Adler AI, Neil AW, et al. on behalf of UKPDS group. Association of
glycemia with macrovascular and microvascular complications of type 2 diabetes
8. Adler AI, Stratton IM, Neil HA, et al. Association of systolic blood pressure with
macrovascular and microvascular complications of type 2 diabetes (UKPDS 36): prospective observational study. BMJ. 2000; 321:412-9.
9. Shichiri M, Kishikawa H, Ohkubo Y. Long term results of the Kumamoto Study on optimal diabetes control in type 2 diabetic patients. Diabetes Care. 2000;23(Suppl. 2):B21-B29.
10. Molyneaux LM, Constantino Ml, MvGill M, Zilken R, Yue DK. Better glycaemic control and risk reduction of diabetic complications in Type 2 diabetes: comparison with the DCCT. Diabetes Research and Clinical Practice. 1998;42: 77-83.
11. Downs SH, Black N. The feasibility of creating a checklist fir the assessment of methodological quality both of randomized and non-randomized studies of health care interventions. J Epidemiology Community Health, 1998; 52:377-87.
12. Abraira C, Duckworth W. The need for glycemic trials in type 2 diabetes. Clinical Diabetes. 2003;21 :107-111.
13. American Diabetes Association. Standards of Medical Care in Diabetes- 2007. Diabetes Care. 2007;30(Suppl 1 ):S4-S41.
15. Centers for Disease Control and Prevention. National diabetes fact sheet: g_eneral
information and national estimates on diabetes in the United States, 2005. Atlanta, GA: U.S. Department of Health and Human Services, Centers for Disease Control and Prevention, 2005.
16. Chan JL, Abrahamson MJ. Pharmacological management of type 2 diabetes mellitus: Rational use of insulin. Mayo Clinic Proc. 2003;78:459-467.
17. Dailey Ill GE. Improving oral pharmalogic treatment and management of type 2 diabetes. Managed Care. 2004;41-49.
18. Davidson, MH. Global risk management in patients with type 2 diabetes mellitus. American Journal of Cardiology. 2007;99(suppl):41 B-508.
19. Duckworth WC, McCarren M, Abraira C. Glucose control and cardiovascular complications: The VA diabetes trial. Diabetes Care. 2001 ;24(5):942-945.
20. Fonesca V. Effect of intensive treatment on vascular and other complications of diabetes mellitus. Clinical Cornerstone. 2004;6(2):40-50.
22. UK Prospective Diabetes Study (UKPDS) group. Intensive blood-glucose control with sulfonylureas or insulin compared with conventional treatment and risk of complications in patients with type 2 diabetes (UKPDS 33). The Lancet. 1998;352:837-853.
23. Pogach LM, Brietzke SA, Cowan CL, et al. Development of evidence-based clinical practice guidelines for diabetes: The department of Veterans Affairs/Department of Defense
guidelines initiative. Diabetes Care. 2004;27(Suppl. 2):882-889.
24. Riddle MC. Oral pharmacologic management of type 2 diabetes. American Family Physician. 1999;60(9):2613-2620.
25. Sinclair AJ. Special considerations in older adults with diabetes: meeting the challenge. Diabetes Spectrum. 2006;19(4):229-233.
26. UK Prospective Diabetes Study (UKPDS) group. Quality of life in type 2 diabetic patients is affected by complication but not by intensive policies to improve blood glucose or blood pressure control (UKPDS 37). Diabetes Care. 1999;22:1125-1136.
27. Vijan S, Hofer TP, Hayward, RA. Estimated benefits of glycemic control in microvascular complications in type 2 diabetes. Annals of Internal Medicine. 1997;127(9):788-795.
29. Cerveny JD, Leder RD, Wear! CW. Issues surrounding tight glycemic control in people with type 2 diabetes mellitus. The Annals of Pharmacotherapy. 1998;32: 896-905.
30. Gerstein HC, Riddle MC, Kendall OM, et al. Gylcemia treatment Strategies in the Action to Control Cardiovascular Risk in Diabetes (ACCORD) Trial. American Journal of Cardiology. 2007;99[suppl]: 34i-43i.
31. Abraira C, Duckworth W, McCarren M, et al. Design of the cooperative study on glycemic control and complications in diabetes mellitus type 2 Veterans Affairs Diabetes Trial. Journal of Diabetes and its complications. 2003; 17:314-322.
32. Ohkubo T, Kishikawa H, Araki E, et al. Intensive insulin therapy prevents the progression of diabetic microvascular complications in Japanese patients with non-insulin-dependent diabetes mellitus: a randomized prospective 6-year study. Diabetes research and Clinical Practice. 1995; 28:103-117.
33. Qaseem A, Vijan S, Snow V, et al. Glycemic control and type 2 diabetes mellitus: The optimal Hemoglobin A1c targets.
A
guidance statement from the AmericanCollege of Physicians. Annals oflnternal Medicine. 2007; 147:417-422.
34. For safety, NHLBI changes intensive blood sugar treatment strategy in clinical trial of
diabetes and cardiovascular disease. CNIH News National Institutes of Health. Available at http://public.nhlbi.nih.gov/newsroom/home/GetPressRelease.aspx?id=2551.
American Association Clinical
American Academy of Family
i
American Diabetes Association
American Geriatrics Society
Canadian Diabetes Association
Institute for Clinical Systems Improvement
Table 4: Clinical Guidelines
2002
1999-2005 2006
2003
2003
2004
2002
Appendix 1
No target value recommended
A1c s 7.0%, s 6.0% without hypoglycemia. Other
factors as well.
Individualized A,c for older persons,
A1c s 7.0% if relatively healthy, A1c s 8.0% with life
less than 5
targets. A1c s 7% in ial s 6.0% if can be""'!'""' Goal A1c < 7%, individualized targets, higher
Appendix: 2
Quality Checklist for RCTs and Observational Studies
(used in the AHRQ study of perinatal depression and based on a Methodological Quality
checklist developed by Downs and Black,
JEpidemiology and Community Health,
1998).
Reviewer's initials _ _ _ _ _
First Author _ _ _ _ _ Journal: _ _ _ _ _ _ _ _ _ _ _ _ _ _ Year published _ _
Reporting
Is the hypothesis/aim/objective of the study clearly described?
2. Is the underlying theory described?
3. Are the main outcomes to be measured clearly described in the Introduction or Methods section? 4. Are the characteristics of the study population
included in the study clearly described?
5. Are the interventions under-study clearly described? 6. Was exposure to the intervention measured?
7 Are the distributions of principal confounders in each group of study participants to be compared clearly described?
8. Are the main findings of the study clearly described? 9. Does the study provide estimates of the random
variability (e.g., standard error, standard deviation, confidence intervals, inter-quartile range) in the data for the main outcomes?
10. Have all important adverse events/negative outcomes that may be a consequence of the intervention been reported?
II. Have the characteristics of study participants lost to follow up been described?
12
Have actual probability values been reported (e.g., 0.035 rather than <0.05) for the main outcomes except where the probability value is less than 0.00 I?
Yes No
I 0
I 0
I 0
I 0
I 0
I 0
Yes P* No
2 I 0
Yes No
I 0
I 0
I 0
I 0
I 0
Total Reporting score: _ _
Yes No U/D
External Validity
13 Were the study participants asked to participate 1 representative of the entire population from which they were recruited?
14. Were study participants who agreed to participate 1
representative of the entire population from which they were recruited?
15. Were the staff, places, and facilities where the study I participants received the intervention representative of the intervention the majority of subjects receive?
16. 1
Were the screening criteria for study eligibility specified?
0 0
0 0
0 0
0 0
Total External Validity Score: _ _ _
Internal Validity-Bias Yes No U/D
Answer this 17 and 18 only if this was a
randomized controlled trial:
17. Was an attempt made to blind study participants to the 1 0 0 intervention they received?
18. Was an attempt made to blind those measuring the I 0 0 main outcomes of the intervention?
Answer alternative 17 and 18 if this was not a randomized controlled trial:
17. Were appropriate methods used to adjust for the 1 differences between groups with and without the
intervention (to control for selection bias)?
18. Were appropriate methods used to account for any 1
biases related to differential ascertainment of the outcome in groups with or without the intervention? 19. If any of the results of the study were based on "data 1
dredging," was tbis made clear?
20. In trials and cohort studies, do the analyses adjust for I different lengths of follow-up of study participants, or in case-control studies, is the time period between the intervention and outcome the same for cases and controls?
21. Were the statistical tests used to assess the main 1 outcomes appropriate?
22. Was compliance with the intervention reliable? 1 23. Were the main outcome measures used accurate (valid 1
and reliable)? 0 0 0 0 0 0 0 0 0 0 0 0 0 0
Internal Validity- Confounding Yes No
vm
24. Were the study participants in the different I 0 0 intervention groups (trials and cohort studies) or were
the cases and controls (case-control studies) recruited from the same population?
25. Were study participants in the different intervention 1 0 0 groups (trials and cohort studies) or were the cases
and controls (case-control studies) recruited over the same period of time?
26. Were study participants randomized to intervention 1 0 0 groups?
27. Answer this Q.27, if randomization occurred: was 1 0 0 the randomized intervention assigrnnent concealed
from both study participants and intervention staff until recruitment was complete and irrecoverable?
27. Answer this Q.27, if randomization did not occnr: 1 0 0 were study participants in the research or evaluation,
unaware of the study hypotheses?
28. Was there adequate adjustment for confounding in the 1 0 0 analyses from which the main findings were drawn?
29. Were losses of study participants to follow-up taken 1 0 0 into account?
Total Confounding Score:
Power
30. Did the study mention having conducted a power analysis to determine the sample size needed to detect a significant difference in effect size for one or more outcome measures?
No
Yes, one measure
Yes, two or more measures
*P ~Partially
U/D = Unable to Determine
0 1 2 Total Power Score
Instructions for Select Questions for the Quality Checklist for RCTs and Observational
Studies
2. If the authors describe the formative research, theoretical basis(es) or constructs upon which the intervention was developed the question should be answered yes.
3. If the main outcomes are first mentioned in the Results section, the question should be answered no.
4. In cohort studies and trials, inclusion and/or exclusion criteria should be given. In case control studies, a case-defmition and the source for controls should be given.
5. Interventions and placebo (where relevant) that are to be compared should be clearly described.
7. Give one point if some confounders are described and two only if most of these principal confounders are described.
8. Simple outcome data (including denominators and numerators) should be reported for all major findings so that the reader can check the major analyses and conclusions. (This question does not cover statistical tests that are considered below).
9. In non-normally distributed data the inter-quartile range of results should be reported. In normally distributed data the standard error, standard deviation or confidence intervals should be reported. If the distribution of the data is not described, it must be assumed that the estimates used were appropriate and the question should be answered yes.
10. This should be answered yes if the study demonstrates that there was a comprehensive attempt to measure adverse events/negative outcomes of the intervention.
II This should be answered yes where there were no losses to up or where losses to follow-up were so small that findings would be unaffected by their inclusion. This should be answered no where a study does not report the number of patients lost to follow-up.
13. The study must identify the source population for study participants and describe how the study participants were selected. Study participants would be representative if they comprised the entire source population, an unselected sample of consecutive participants, or a random sample. Random sampling is only feasible where a list of all members of the relevant population exists. Where a study does not report the proportion of the source population from which the study participants are derived, the question should be answered as unable to determine.
14. The proportion of those asked who agreed should be stated. Validation that the sample was representative would include demonstrating that the distribution of the main confounding factors was the same in the study sample and the source population.
15. For the question to be answered yes, the study should demonstrate that the intervention was representative of that in use in the source population. The question should be
17. For randomized studies where the subjects would have no way of !mowing which intervention they received, this should be answered yes.
18. For randomized studies where the researchers would have no way of !mowing which
intervention subjects received, this should be answered yes.
For non-randomized studies, if methods were used to adjust for initial differences between
groups, the answer should be yes.
18. For non-randomized studies, if the same methods were used for ascertainment of the outcome
in both groups, the answer should be yes.
19. Any analyses that had not been planned at the outset of the study should be clearly indicated. If no retrospective unplanned subgroup analyses were reported, then answer yes.
20. Where follow-up was the same for all study subjects the answer should be yes. If different lengths of follow-up were adjusted for by, for example, survival analysis the answer should be yes. Studies where differences in follow-up are ignored should be answered no.
21. The statistical techniques used must be appropriate to the data. For example, nonparametric methods should be used for small sample sizes. Where little statistical analysis has been undertaken but where there is no evidence of bias, the question should be answered yes. If the distribution of the data (normal or not) is not described it must be assumed that the estimates used were appropriate and the question should be answered yes.
22. Where there was non compliance with the allocated treatment or where there was contamination of one group, the question should be answered no. For studies where the effect of any misclassification was likely to bias any association to the null, the question should be answered yes.
23. For studies where the outcome measures are clearly described, the question should be answered yes. For studies which refer to other work or that demonstrates the outcome measures are accurate, the question should be answered as yes.
24. For example, subjects for all comparison groups should be selected from the same population. The question should be answered unable to determine for cohort and case control studies where there is no information concerning the source of subjects s included in the study.
25. For a study which does not specify the time period over which subjects were recruited, the question should be answered as unable to determine.
26. Studies which state that subjects were randomized should be answered as yes except where method of randomization would not ensure random allocation. For example, alternate allocation would score no because it is predictable.
27. If randomization occurred, and assignment was concealed from subjects but not from staff, it
should be answered no.
27. If randomization did not occur, if methods used ensure that those in the intervention group and
28. This question should be answered no for trials if: the main conclusions of the study were based on analyses of treatment rather than intention to treat; the distribution of known
confounders in the different treatment groups was not described; or the distribution of known confounders differed between the treatment groups but was not taken into account in the analyses. In non-randomized studies if the effect of the main confounders was not investigated or
confounding was demonstrated but no adjustment was made in the fmal analyses the question should be answered as no.
29. If the numbers of patients lost to follow-up are not reported, the question should be answered as unable to determine. If the proportion lost to follow-up was too small to affect the main findings, the question should be answered yes.
SOURCE: Based on a modified version of the form from Downs SH, .Black N. The feasibility of creating a checklist for the assessment of the methodological quality both of randomized and non-randomized studies of health care interventions. J Epidemic! Community Health,
Appendix3