AN ANALYSIS OF A QUALITY IMPROVEMENT INITIATIVE TO REDUCE PRIMARY CESAREAN SECTION RATE AMONG NORTH CAROLINA NULLIPAROUS, TERM,
SINGLETON, VERTEX PRESENTATION PATIENTS
by
Jessica Phipps
A paper presented to the faculty of The University of North Carolina at Chapel Hill in partial fulfillment of the requirements for the
degree of Master of Public Health
in the Department of Maternal and Child Health.
Chapel Hill, N.C. April 20th, 2012
Objectives: The Perinatal Quality Collaborative of North Carolina (PQCNC) worked with 24 North Carolina Hospitals in 2011 to attempt to reduce the cesarean rate among participating hospital by 25%.
Methods: The first 40 patients of every month at each hospital were included in the analysis. Logistic regression was performed on the aggregated data to assess trend over time by month for cesarean rate.
Results: The cesarean rate did not change significantly in the aggregate data set over the course of the initiative. However, the cesarean rate decreased significantly over the course of the initiative for patients with an existing risk factor for cesarean.
Conclusions: The PQCNC initiative was successful in reducing the cesarean rate, but only among patients with risk factors.
Introduction
Cesarean section in the United States is an area of growing concern for perinatal and
public health. Cesareans are associated with increased risk of morbidity and mortality for both
current and subsequent deliveries and affect the overall public health landscape of perinatal
outcomes in the United States. In an effort to address these issues in North Carolina, in 2011
the Perinatal Quality Collaborative of North Carolina managed a quality improvement initiative to
improve the rate of cesarean section in North Carolina.
The cesarean section rate in the United States has been increasing every year since
1996,1,2 without showing clear signs of improving maternal or neonatal outcomes.3 In 2009, the
most recent year for which official data are available, 32.9% of all deliveries in the US were via
cesarean.2 Primary cesareans accounted for 23.8% of all deliveries in 2008,4 compared to
14.6% in 1996.5 Repeat cesareans occur in 75-90% of women who have had at least one prior
cesarean, so reducing the primary cesarean rate could have a significant impact on the overall
cesarean rate with time.3,6,7 Healthy People 2020 has also identified this as an area for
improvement and set a goal of reducing the primary cesarean rate by 10% by 2020.7
Cesareans increase the risk of complications in current pregnancies including
hemorrhage, infection, injury to organs adjacent to the uterus, laceration of the neonate, fetal
pregnancies, such as placental implantation abnormalities (placenta previa or placenta accreta)
and obstetric emergencies such as rupture, emergency hysterectomy, and hemorrhage. 3,6,8,9,10
Research has also shown that when cesareans are performed at a rate greater than 10-20%,
maternal and neonatal morbidity and mortality rates may increaseand begin to outweigh the
benefits of cesarean section.11,12,13 Reducing the rate of avoidable cesarean section could
therefore improve maternal and neonatal health outcomes.
In 2009 and 2010, the Perinatal Quality Collaborative of North Carolina (PQCNC)
oversaw the “39 Weeks” initiative, which sought to eliminate elective deliveries prior to 39 weeks
gestation. Building from the momentum of this initiative, PQCNC worked with area hospitals to
identify cesarean section as a new improvement area in 2010. In North Carolina in 2009, 31.7%
of all births were via cesarean section.14 This work led to PQCNC’s “Support for Intended
Vaginal Birth” (SIVB) initiative, which sought to reduce the rate of primary cesarean section by
25% among nulliparous, term, singleton, vertex (NTSV) patients at 24 participating hospitals in
North Carolina in 2011. The NTSV population was selected based on previously documented
efforts to reduce cesarean rates and assessments of the NTSV population as a valid measure of
cesarean rate.15,16
Participants and Methods
Participants
Hospitals agreed to participate in part because The Joint Commission began collecting
information on cesarean rates and PQCNC was offering to collect and report these rates back to
participating hospitals, in addition to offering educational opportunities regarding practices that
could be used to help reduce cesarean rates. PQCNC’s education efforts focused on waiting for
labor to begin before admitting patients, employing cervical ripening for induction patients with
Hospitals were invited to participate in monthly webinars, which focused on one or more
of these education efforts. Monthly reports were also delivered to each hospital. These reports
included summary statistics of the data entered by that hospital for the month compared to the
same statistics for the aggregate group of hospitals for that month. In all, 27 hospitals began
baseline data collection, but only 24 continued collection past baseline. An initial learning
session occurred in January 2011, a mid-point learning session occurred in June 2011, and a
final learning session in November 2011. These learning sessions offered up-to-date data
review, evidence-based labor and delivery messages, relevant talks from related organizations,
and continuing medical or educational credits for participants.
Data
Data were collected at each facility on either the first 40 NTSV patients of the month, or
all patients if the facility delivered less than 40 NTSV patients per month, using a standardized
data collection form. Data were then entered into the PQCNC database using a web-based
interface maintained on PQCNC servers. Complete data were entered by nineteen facilities, one
facility missed one month of data collection, and four facilities missed more than one month of
data collection. Facilities missing more than one month of data were coded as “missing” in the
analysis and all statistics adjust for this variable.
Data excluded from analysis included any entries beyond the required 40 per month,
non-NTSV patients, patients who experienced a scheduled cesarean, patients who experienced
a contraindication to vaginal birth, and patients who did not have a living fetus at admission. The
data analyzed were collected in October and November 2010 (baseline period) and from
February to December 2011.
In addition to exclusion criteria, data collected on each participant included labor status
at admission, patient risk factors for cesarean, Bishop score criteria, rupture of membranes prior
augmentation and method employed, labor support methods, mode of delivery, primary and
secondary indications for cesarean (if applicable), cervical dilation at the time of “failure to
progress” diagnosis, intrauterine pressure catheter (IUPC) use and presence or absence of
adequate contractions among “failure to progress” cesareans, any applicable neonatal or
maternal complications, and birth weight.
All analyses were performed using Stata12. Due to the complex survey design, which is
stratified by non-randomly selected hospital and clustered by month, we corrected for these
concerns using Stata’s correction algorithms for standard errors.
The University of North Carolina Institutional Review Board exempted the PQCNC
project from requirement for consent.
Measures
The outcome of interest was NTSV cesarean rate by month, which was calculated by
dividing the number of cesareans each month by the number of patients each month who
intended to have a vaginal birth, regardless of actual mode of delivery. We anticipated an overall
decrease in cesarean rate over the course of the initiative.
Because education efforts also surrounded cervical ripening, cesarean for failure to
progress, and delaying admission until labor, these outcomes were also measured by month.
We also examined outcomes by risk population. The risk population was defined as patients
experiencing one or more of the following risk factors for cesarean: hypertensive disease, any
type of diabetes, intrauterine growth restriction (IUGR), suspected macrosomia (birthweight
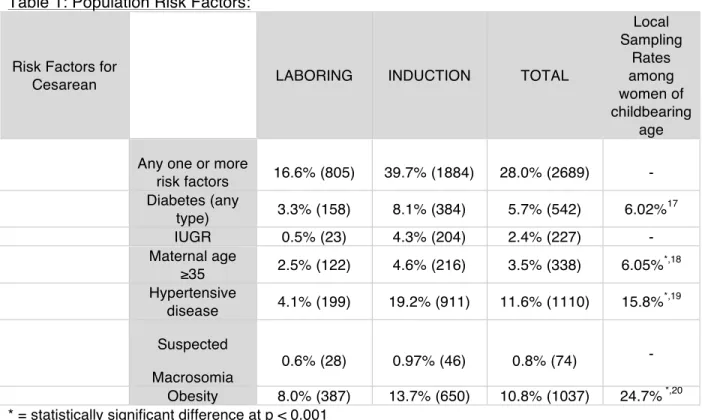
4000g), maternal age 35 or older, and obesity. In all, 28.0% of the sample (2689 patients)
experienced one or more risk factors (Table 1). In general, the rates of these risk factors were
lower than other state or national samples, suggesting underreporting or a lower rate of
Maternal and neonatal complications were also monitored to ensure that the initiative
was not leading to poor outcomes.
Table 1: Population Risk Factors:
Risk Factors for
Cesarean LABORING INDUCTION TOTAL
Local Sampling
Rates among women of childbearing
age Any one or more
risk factors 16.6% (805) 39.7% (1884) 28.0% (2689) - Diabetes (any
type) 3.3% (158) 8.1% (384) 5.7% (542) 6.02%
17
IUGR 0.5% (23) 4.3% (204) 2.4% (227) - Maternal age
≥35 2.5% (122) 4.6% (216) 3.5% (338) 6.05%
*,18
Hypertensive
disease 4.1% (199) 19.2% (911) 11.6% (1110) 15.8%
*,19
Suspected Macrosomia
0.6% (28) 0.97% (46) 0.8% (74) - Obesity 8.0% (387) 13.7% (650) 10.8% (1037) 24.7% *,20 * = statistically significant difference at p < 0.001
Results
In total, data from 9,590 NTSV patients who intended to have a vaginal birth at
admission and met inclusion criteria were analyzed, 7,454 of which ended in a vaginal birth and
2,136 of which ended in a cesarean. Among the sample, 4,748 patients were in labor at
admission and 4,842 were induced (Table 2). “Failure to progress” was the most common
indication for cesarean among induction patients (43.0% of cesareans) and “non-reassuring
fetal status” was the most common indication for cesarean among patients in spontaneous labor
Table 2: Sample statistics for all deliveries included in analysis Sample Size 9590
Sample descriptions % of sample (n) Gestational age
37 0/7-38 6/7 23.8% (2284) 39 0/7-40 6/7 63.97% (6135)
41+ 12.2% (1171) Labor Status at
admission
In Labor 49.5% (4748) Induction 50.5% (4842) Use of ripening among
induction patients
Ripening used 43.4% (2062) Ripening not used 56.6% (2686)
Mode of Delivery LABORING INDUCTION TOTAL
Cesarean 14.3% (690) 30.5% (1446) 22.3% (2136) Vaginal 85.8% (4152) 69.6% (3302) 77.7% (7454)
Dilation at admission LABORING INDUCTION TOTAL
0 0.6% (30) 19.7% (914) 9.99% (944) 1-2 22.9% (1102) 60.6% (2812) 41.4% (3914) 3-4 48.5% (2331) 18.5% (858) 33.8% (3189) 5+ 27.97% (1345) 1.2% (54) 14.8% (1399)
Reason for Cesarean LABORING INDUCTION TOTAL
Failure to Progress 26.96% (186) 43.0% (622) 37.8% (808) Non-reassuring
fetal status 33.0% (228) 29.4% (425) 30.6% (653) Failure to Descend 25.7% (177) 12.7% (184) 16.9% (361) Presumed CPD 3.5% (24) 3.7% (54) 3.7% (78) Failed operative
vaginal delivery 2.2% (15) 0.8% (12) 1.3% (27) Chorioamnionitis 1.0% (7) 1.1% (16) 1.1% (23) Malpresentation 1.2% (8) 0.9% (13) 0.98% (21)
The primary outcome of interest was cesarean rate over time, with the anticipation that
the rate would decrease over the course of the initiative. A logistic regression of cesarean
outcomes against time and adjusting for hospitals missing more than one month of data
collection was performed, showing no statistical difference in cesarean rate over time from
Baseline to December 2011 (AOR: 0.99 [.97 – 1.00], p=0.086). The variable accounting for
facilities missing more than one month of data was statistically significant in the model,
suggesting that there is something fundamentally different about those facilities or their
participation. All subsequent analyses adjusted for this variable.
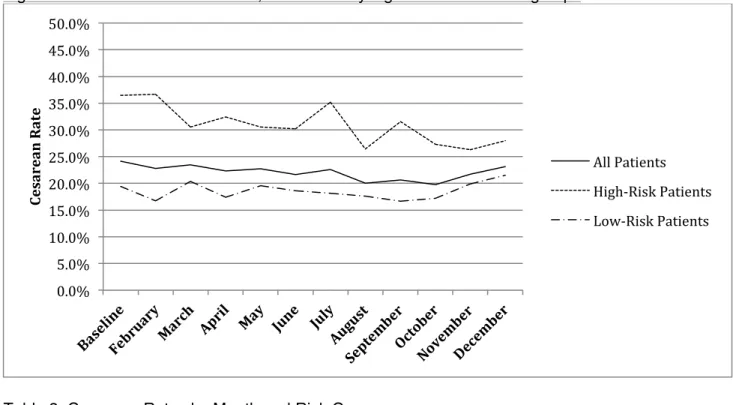
The decline in cesarean over time is significant only in the population with cesarean risk
factors (Figure 1), with an AOR of 0.97 [0.94 – 0.99], p=0.015 versus an AOR 1.00 [0.99 – 1.02],
p=0.787 for low risk patients. The effects of time on cesarean section are significantly different
between patients with risk factors and patients without risk factors (p=0.0232) (Table 3). As of
November 2010, the month with the lowest cesarean rate among high-risk patients, the rate of
cesarean among high-risk patients decreased 27.9% compared to baseline, which exceeded the
goal of reducing the cesarean rate by 25% in that risk group. Because there was no statistically
significant reduction in cesarean rate in the aggregate or low-risk groups, the goal of a 25%
Figure 1: Cesarean rates over time, broken out by high-risk and low-risk groups
Table 3: Cesarean Rates by Month and Risk Group
Cesarean Rates by Month
MONTH High-Risk Low-Risk Total
Baseline 36.5% 19.4% 24.1%
February 36.7% 16.8% 22.8%
March 30.5% 20.4% 23.4%
April 32.4% 17.4% 22.3%
May 30.5% 19.6% 22.7%
June 30.2% 18.6% 21.7%
July 35.2% 18.2% 22.6%
August 26.4% 17.6% 20.1%
September 31.6% 16.6% 20.6%
October 27.3% 17.2% 19.8%
November 26.3% 19.9% 21.7%
December 27.98% 21.5% 23.1%
Induction was strongly correlated with cesarean (p<0.0001), supporting similar results
seen in prior studies.21,22,23,24,25,26 Induction patients experienced a 30.5% cesarean rate, while
0.0% 5.0% 10.0% 15.0% 20.0% 25.0% 30.0% 35.0% 40.0% 45.0% 50.0%
Ce
sa
re
an
R
at
e
All Patients
dilation at admission, patient risk factors, and facilities missing more than one month of data,
induction was associated with an adjusted odds ratio for cesarean of 1.39 [1.23 - 1.57],
p<0.0001. However, the rate of induction did not significantly change from the beginning to the
end of the initiative, even when stratifyed by risk population.
Cervical ripening among induction patients in our sample was associated with a
significantly higher rate of cesarean: 25.7% for unripened patients and 36.7% for ripened
patients (p<0.0001). However, after adjusting for cervical dilation at admission, patient risk
factors, and facilities missing more than one month of data, the difference became
non-significant with an adjusted odds ratio of 1.10 [0.95 - 1.28], p=0.181. No non-significant change in
rates of cervical ripening among induction patients was seen from the beginning to the end of
the initiative, even when stratifying by risk population.
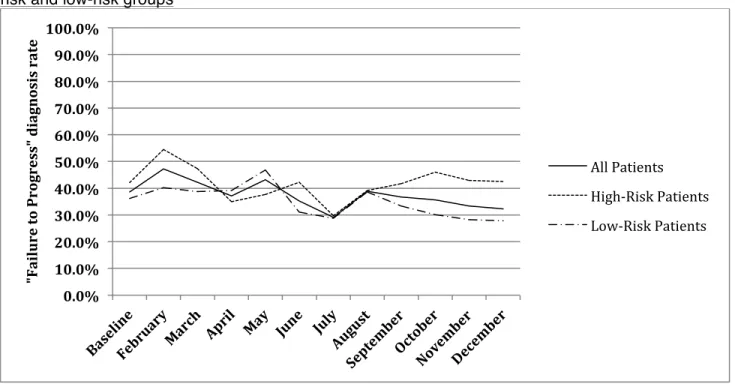
The proportion of patients who received a cesarean for “failure to progress” was highest
among induction patients, with 43.0% of cesareans among induction patients being diagnosed
as such, versus 26.96% of laboring patient cesareans. Over the course of the initiative, the rate
of cesarean for “failure to progress” decreased significantly overall (AOR 0.97 [0.94 – 0.999]
p=0.039). When disaggregating by risk group, the decrease in rate of FTP was significant
among low-risk patients (AOR 0.96 [0.93 – 0.999], p=0.043), but did not decrease significantly
among high-risk patients (AOR 0.99 [0.95 – 1.02], p=0.485) (see Figure 2). The effects of time,
Figure 2: Rate of “failure to progress” diagnosis among cesareans over time, broken out by at-risk and low-at-risk groups
Table 4: Failure to Progress Rates by Month and Risk Group
Failure to Progress Rates Among Cesareans by Month
MONTH High-Risk Low-Risk Total
Baseline 42.1% 36.2% 38.6%
February 54.6% 40.2% 47.2%
March 47.4% 38.8% 42.2%
April 34.9% 39.1% 37.1%
May 37.7% 46.8% 43.3%
June 42.3% 31.1% 35.2%
July 29.7% 28.7% 29.1%
August 39.2% 38.6% 38.9%
September 41.7% 33.3% 36.7%
October 46.0% 30.1% 35.7%
November 42.9% 28.3% 33.3%
December 42.6% 27.8% 32.3%
Monitored maternal complications included the following: Chorioamnionitis, 3rd/4th
degree laceration, postpartum hemorrhage, shoulder dystocia, transfusion, endometritis, 0.0%
10.0% 20.0% 30.0% 40.0% 50.0% 60.0% 70.0% 80.0% 90.0% 100.0%
"F ai lu re to P ro gr ess" d ia gn osi
s
ra
te
All Patients
stillbirth, and uterine rupture. There was no statistically significant increase in any of these
complications individually or aggregated as “any complication” over the course of the initiative.
Neonatal complications that were tracked include: Apgar at 5 minutes ≤6, admission for
nonstandard newborn care, meconium aspiration syndrome (first 24 hrs), cord pH ≤7.0, seizure
activity in first 24 hours, brachial plexus injury, cephalohematoma, subgaleal hematoma,
clavicular fracture, humerus fracture, laceration of neonate, and “other.” There were no
statistically significant increases in any of these complications individually or aggregated as “any
complication” over the course of the initiative. Hence, this initiative did not lead to any
unintended poor outcomes.
Discussion
While outcomes did not vary much when considering the aggregate population, there
were some changes in specific patient categories over time for the outcomes of interest. The
cesarean rate did not change over the course of the initiative for patients at low risk of cesarean,
but the rate did decrease over time in the group of patients experiencing one or more prior risk
factors for cesarean. Limited discussions with participating facilities did not yield a clear reason
for this differential in success between high and low risk patients. This is especially puzzling, as
none of the outcomes that are expected to change concurrently with cesarean rate changed
significantly for high-risk patients. “Failure to progress” rates even decreased for the low-risk
group, but not for the high-risk group.
As expected, induction was associated with an increased risk of cesarean. However, no
change in induction rates was seen over the course of the initiative, in either risk category or at
the aggregate level. Among patients who were induced, there was no improvement in rates of
cervical ripening over the course of the initiative, but after accounting for cervical dilation at
admission, presence of risk factors, and facilities missing more than one month of data, cervical
There are several limitations to the study. Many of the risk factors for cesarean were
reported at a lower rate than the general population. Part of this discrepancy may be due to our
population being risk-adjusted; however risks such as obesity, which was reported at less than
half the population rate, appear to be truly underreported. Data collection staff indicted that BMI
was not regularly reported on patient charts, so many cases of obesity may have been missed.
Suspected macrosomia was also underreported; 0.8% of patients were suspected of having a
macrosomic fetus, while 8.8% of neonates were actually macrosomic.
Another limitation to the study is that hospitals self-selected into the program, leading to
a non-random sample at the hospital level. However, this limitation was accounted for in the
analysis statistics.
Cesarean rate change also cannot be proven to be associated with the PQCNC
initiative. There may have been additional pressures on participating hospitals to work on their
cesarean rates, such as The Joint Commission or popular demand.
Strengths of the study include the large number of patients in the database and the
extensive information collected on each. The wide array of information collected allowed us to
adjust for a number of variables in our analyses and the large number of patients allowed for
more precision in our point estimates. Additionally, the data collected was very specific and
based on chart-review, making the data especially reliable.
Conclusion
The efforts to reduce the cesarean rate among participating hospitals in North Carolina
was only successful in the population of patients experiencing pre-existing risk factors for
cesarean and managed to meet the goal of a 25% reduction in cesarean rate over the course of
the initiative. This dataset is not equipped to explain this differential between the two risk
References
(1) Menacker F, Hamilton BE. Recent trends in cesarean delivery in the United States. NCHS Data Brief 2010 Mar;(35)(35):1-8
(2) Births: Final Data for 2009. National Vital Statistics Reports. Supplemental Tables. Vol. 59, No. 3. Hyattsville, MD: National Center for Health Statistics, 2004.
(3) Blanchette H. The rising cesarean delivery rate in America: what are the consequences? Obstet Gynecol. 2011; 118(3):687-690
(4) Osterman MJ, Martin JA, Mathews TJ, et al. Expanded data from the new birth certificate, 2008. [Journal Article] Natl Vital Stat Rep 2011 Jul 27; 59(7):1-28.
(5) Ventura SJ, Martin JA, Curtin SC, Mathews TJ. Births: final data for 1997. Natl Vital Stat Rep. 1999;47(18):1-96. Accessed 3/16/2012 9:36:30 PM.
(6) Macones GA, Peipert J, Nelson DB, et al. Maternal complications with vaginal birth after cesarean delivery: a multicenter study. Am J Obstet Gynecol. 2005;193(5):1656-1662. Accessed 3/16/2012 7:52:57 PM. 10.1016/j.ajog.2005.04.002.
(7) U.S. Department of Health and Human Services. Office of Disease Prevention and Health Promotion. Healthy People 2020. Washington, DC. Available at
http://www.healthypeople.gov/2020/topicsobjectives2020/pdfs/HP2020objectives.pdf. Accessed March 16, 2012.
(8) Wu S, Kocherginsky M, Hibbard JU. Abnormal placentation: twenty-year analysis. Am J Obstet Gynecol. 2005;192(5):1458-1461. 10.1016/j.ajog.2004.12.074.
(9) American College of Obstetricians and Gynecologists. Evaluation of cesarean delivery. Washington, DC: ACOG; 2000.
(10)Guise JM, Berlin M, McDonagh M, Osterweil P, Chan B, Helfand M. Safety of vaginal birth after cesarean: a systematic review. Obstet Gynecol. 2004;103(3):420-429. 10.1097/01.AOG.0000116259.41678.f1.
(11)Villar J, Valladares E, Wojdyla D, Zavaleta N, Carroli G, Velazco A, et al. Caesarean delivery rates and pregnancy outcomes: the 2005 WHO global survey on maternal and perinatal health in Latin America. Lancet 2006 Jun 3;367(9525):1819-1829
(12)Betran AP, Merialdi M, Lauer JA, Bing-Shun W, Thomas J, Van Look P, et al. Rates of caesarean section: analysis of global, regional and national estimates.
(13)Gould JB, Danielsen B, Korst LM, et al. Cesarean delivery rates and neonatal morbidity in a low-risk population. Obstet Gynecol. 2004;104(1):11-19. Accessed 3/23/2012 11:01:05 PM. 10.1097/01.AOG.0000127035.64602.97.
(14)State Center for Health Statistics. NC Department of Health and Human Services. Risk Factors And Characteristics for 2009 North Carolina Resident Live Births: All Mothers. Available at http://www.schs.state.nc.us/SCHS/births/matched/2009/all.html. Accessed March 16, 2012.
(15)Main EK, Bloomfield L, Hunt G, Sutter Health, First Pregnancy and Delivery Clinical Initiative Committee. Development of a large-scale obstetric quality-improvement program that focused on the nulliparous patient at term. Am J Obstet Gynecol. 2004;190(6):1747-56; discussion 1756-8. Accessed 3/19/2012 9:29:06 PM. 10.1016/j.ajog.2004.02.055.
(16)Main EK, Moore D, Farrell B, et al. Is there a useful cesarean birth measure?
Assessment of the nulliparous term singleton vertex cesarean birth rate as a tool for obstetric quality improvement. Am J Obstet Gynecol. 2006;194(6):1644-51; discussion 1651-2. Accessed 3/19/2012 9:41:41 PM. 10.1016/j.ajog.2006.03.013.
(17)Core State Preconception Health Indicators Women Aged 18 to 44. NC Department of Health & Human Services State Center for Health Statistics. 2009. Available at
http://www.schs.state.nc.us/SCHS/data/preconception/brfss/2009/I1_2009.html. Accessed March 30, 2012
(18)North Carolina Resident Births for 2010 By Age of Mother and Birth Order. NC
Department of Health & Human Services State Center for Health Statistics. August 5, 2011. Available at
http://www.schs.state.nc.us/schs/births/babybook/2010/northcarolina.pdf. Accessed March 30, 2012
(19)Core State Preconception Health Indicators Women Aged 18 to 44. NC Department of Health & Human Services State Center for Health Statistics. 2009. Available at
http://www.schs.state.nc.us/SCHS/data/preconception/brfss/2009/I3_2009.html. Accessed March 30, 2012
(20)2008 North Carolina Pregnancy Risk Assessment Monitoring System Survey Results - Preconception Health Indicators Women 18-44 - Mother's Body Mass Index (BMI) Before Pregnancy. NC Department of Health & Human Services State Center for Health Statistics. July 12, 2010. Available at
(21)Ehrenthal DB, Jiang X, Strobino DM. Labor induction and the risk of a cesarean delivery among nulliparous women at term. Obstet Gynecol. 2010;116(1):35-42. Accessed 3/22/2012 4:57:02 PM. 10.1097/AOG.0b013e3181e10c5c.
(22)Cammu H, Martens G, Ruyssinck G, Amy JJ. Outcome after elective labor induction in nulliparous women: a matched cohort study. Am J Obstet Gynecol. 2002;186(2):240-244. Accessed 3/22/2012 5:27:04 PM.
(23)Moore LE, Rayburn WF. Elective induction of labor. Clin Obstet Gynecol. 2006;49(3):698-704. Accessed 3/23/2012 8:31:36 AM.
(24)Selo-Ojeme D, Rogers C, Mohanty A, Zaidi N, Villar R, Shangaris P. Is induced labour in the nullipara associated with more maternal and perinatal morbidity? Arch Gynecol Obstet. 2011;284(2):337-341. Accessed 3/23/2012 8:38:17 AM. 10.1007/s00404-010-1671-2.
(25)Seyb ST, Berka RJ, Socol ML, Dooley SL. Risk of cesarean delivery with elective induction of labor at term in nulliparous women. Obstet Gynecol. 1999;94(4):600-607. Accessed 3/23/2012 8:39:24 AM.