Baker, M., Chiasson, K., Mahar, P., Schroeder, S., & Terras, K. (2016). Students’ Desired and Experienced Levels of Connectivity to an Asynchronous, Online, Distance Degree Program. Online Learning 20 (3) 244 - 263.
Students’ Desired and Experienced Levels of
Connectivity to an Asynchronous, Online, Distance
Degree Program
Shawnda Schroeder, Mary Baker, Katherine Terras, Patti Mahar, & Kari Chiasson
University of North Dakota, School of Medicine & Health Sciences
Abstract
This study examined graduate students’ desired and experienced levels of connectivity in an online, asynchronous distance degree program. Connectivity was conceptualized as the students’ feelings of community and involvement, not their level of access to the Internet. Graduate students enrolled in a distance degree program were surveyed on both desired and experienced connectivity to their program, students, instructors, and advisors. Overall, student’s desired and experienced high connectivity to the program, their advisors, and their instructors. However, they did not want, or experience, high connectivity with fellow students. Specifically, three findings emerged: (1) students desired high connectivity overall, with greatest connectivity desired with advisors and less with other students; (2) participants desired connectivity with both instructors and other students presented statistically significant variation by age category; and (3) students experienced high connectivity overall. The relationships between graduate online learners and their instructors and advisors were correlated with the level of connectivity students experienced with their program. It was not as important to foster high connectivity among peers in the online learning environment. Further study should compare desired and experienced connectivity between departments, and across other universities to determine variables that may influence the desire for and perception of connectivity.
Baker, M., Chiasson, K., Mahar, P., Schroeder, S., & Terras, K. (2016). Students’ Desired and Experienced Levels of Connectivity to an Asynchronous, Online, Distance Degree Program. Online Learning 20 (3) 244 - 263.
Introduction
Asynchronous distance education is not new. It has its roots back in the latter part of the 19th century and the early part of the 20th century when people could not travel great distances to institutions of higher education. Instead, they undertook “correspondence” education in which the US Postal Service would deliver materials and the student would send work back to the institution of higher education. By the 1920s, lectures could be recorded and reproduced for rebroadcasting to students anywhere in the world (Heerema, 2001). In the 1980s, with the advent of microcomputers, computer-based distance education was born. By the mid-1990s, institutions of higher education were showing an increasing interest in using the Internet for broadcasting their distance education offerings (Reiser, 2001) and student interest was on the rise.
In an effort to provide the highest quality of instruction, the traditional format of instructors teaching and students’ learning must be modified to fit distance education. Accordingly, as use of this medium has progressed, distance education has significantly changed the instructional element of teaching and learning as well as the social context. Research on the effectiveness of online learning has been largely focused on the instructional process relative to meeting course objectives, which is measured through the acquisition of knowledge and skills. Yet, the online learning experience is more expansive and includes social, relational elements as well to include community, social presence, and connectivity.
Despite the continual growth of distance education programs, a significant challenge for higher education institutions is that student retention in online programs is lower than in traditional ones (DiRamio & Wolverton, 2006; Hoyer, 2006; Stanford-Bowers, 2008; Terry, 2007). This dropout rate is one of the greatest challenges facing online educators and administrators (Lee & Choi, 2011). Literature suggests there are a number of reasons for low retention among students taking coursework online. These include, but are not limited to, lack of institutional support, lack of connection between the student and the institution, quality of interaction between the student and faculty, sense of isolation, disconnection, issues with technology, and student self-discipline (Heyman, 2010, Stanford-Bowers, 2008; Veenstra, 2009). Consequently, “failure to fully consider the relational dynamics in the online setting may produce greater feelings of isolation among distance learners, reduced levels of student satisfaction, poor academic performance, and increased attrition” (Woods & Baker, 2004, p. 1).
Schwartz and Holloway (2012) reported the assumption that student-faculty relationships are not valued in graduate education due to the short length of a master’s program and the increased focus on careers. However, when they investigated the relationship between faculty and master’s seeking students and found the connections between professors and students were forces for growth and forward movement. Students felt energized by their connections, had boosts in self-esteem increase.
A primary objective for online learning has become the creation of an environment where learners are at ease and experience comfort in their communication with others (e.g., social presence); however, replicating the sense of community experienced in a face-to-face environment by establishing social relations is a daunting task in the online environment (Mykota & Duncan, 2007). Nonetheless, it is
people who make the online learning environment productive, thus it is important to focus on the human activities more so than the capabilities or limitations of technology (Kehrwald, 2008). Accordingly, the type of “connectivity” this research was focused on is the social aspect—the students’ feelings of community and involvement in the online environment—not their technological level of “connectivity” via the internet. The importance of this type of connectivity is further defined and supported by Reupert, Mayberry, Patrick, and Chittleborough’s (2009) study on instructor presence in distance programs. They found that the majority of students needed instructors to provide a personal presence by being engaging, approachable, understanding, patient, and passionate about the subject. In opposition to this study, recent research has suggested that not all students want a social connection with their instructors and classmates (Drouin & Vartanian, 2010), rather the flexibility of online learning is paramount (Mayberry et al., 2009).
Baker, M., Chiasson, K., Mahar, P., Schroeder, S., & Terras, K. (2016). Students’ Desired and Experienced Levels of Connectivity to an Asynchronous, Online, Distance Degree Program. Online Learning 20 (3) 244 - 263.
This phenomenon can be explained by a study conducted by Capdeferro and Romero (2012) who investigated online master’s students’ perceptions of collaborative learning activities. Students identified these activities as the most important source of frustration in online learning due to the following: group disorganization, lack of shared goals amongst team members, imbalance in level of commitment and quality of individual contributions, excess time spent on these tasks, and difficulties in communication.
Research on the emotional aspect of online learning has focused on the importance of the learners’ feelings in relation to sense of community (Rovai & Wighting, 2005). This research also emphasized the importance of the affective dimension, and that the “full promise of web-based education will not be realized, unless affective aspects are properly acknowledged” (Zembylas, Theodorou & Pavlakis, 2008, p. 109). Pigliapoco and Boglio (2008) found that students’ perceived sense of community in online courses was relevant to student satisfaction, performance, and persistence.
Limited empirical evidence exists on the degree of connectivity learners feel toward others in their learning communities, especially in distance degree programs. Further research must focus on the nature, role, and function of social presence in online learning environments (Kehrwald 2008). This study sought to assess and understand the level of connectivity distance learners and experienced in an online, asynchronous distance degree program. The following is a discussion of the literature and theoretical support for this study, followed by a description of the research questions. The method is presented with detail on the analysis run to determine what connectivity are high and low. Finally, the paper concludes with a thorough review of the results and a discussion of what it means to be connected in an online learning environment, and what factors have the greatest influence on online graduate students’ feeling of connectivity.
Literature Review
Social Presence
Social presence theory involves the affective domain as it relates to interpersonal communication. It is the critical affective ingredient for online learning because social presence is one of the more important constructs to determine the level of interaction in an online learning environment (Mykota & Duncan, 2007). Short, William, and Christie (1976) defined social presence as “the degree of salience of the other person in a mediated interaction and the consequent salience of the interpersonal interaction” (p. 65).
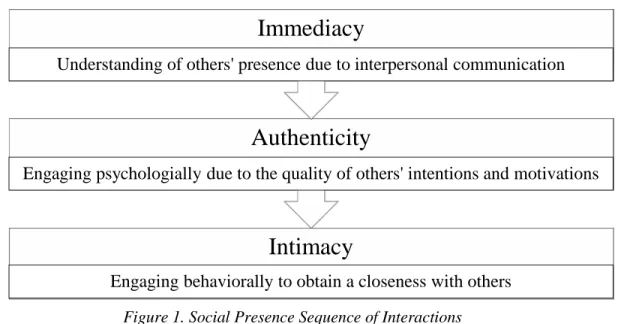
Contemporary definitions of social presence include “the degree to which participants in computer-mediated communication feel affectively connected to one other” (Swan & Shih, 2005) and “the degree to which a person is perceived as a real person in mediated communication” (Gunawardena & Zittle, 1997, p. 9). Thus, social presence is a factor of both the medium and the quality of communication in a sequence of interactions (see Figure 1). (Gunawardena & Zittle, 1997).
Three constructs comprise social presence: immediacy, authenticity, and intimacy (Starr-Glass, 2011). Immediacy is a learner’s perceived social and psychological distance influenced by interpersonal communication behaviors, both verbal and nonverbal (Arbaugh, 2001; Starr-Glass, 2011). Understood within immediacy is co-presence, when the learner “senses he/she is not alone or isolated, is aware of the presence of an ‘other,’ and believes that others are aware of him/her” (Starr-Glass, 2011, p. 142).
The second construct is authenticity. This is the quality and extent of personal disclosure and the expression of a genuine self (Starr-Glass, 2011; Cranton, 2001). Authenticity calls for psychological involvement which is understood as “a higher level of social presence in which the individual focuses
Baker, M., Chiasson, K., Mahar, P., Schroeder, S., & Terras, K. (2016). Students’ Desired and Experienced Levels of Connectivity to an Asynchronous, Online, Distance Degree Program. Online Learning 20 (3) 244 - 263.
attention, empathizes, responds to feelings, and considers that he/she is aware of the intentions, motivations, and thoughts of others” (Starr-Glass, 2011, p. 142).
The final construct, intimacy, occurs when closeness is obtained as a result of behaviors associated with immediacy and authenticity. Intimacy requires behavioral engagement and is the highest manifestation of social presence; “the individual believes that his/her actions are interdependent, related, connected, and responsive to the ‘other’ and that the ‘other’ recognizes and reciprocates the responsiveness” (Starr-Glass, 2011, p. 142).
Figure 1. Social Presence Sequence of Interactions
Sense of Community
McMillian and Chavis (1996) defined community as “a feeling that members have of belonging, a feeling that members matter to one another and to the group, and a shared faith that members’ needs will be met through their commitment to be together” (p. 9). Rovai (2002) defined virtual learning communities as the intersection of four components: interaction, trust, learning, and spirit. These four components can be constitutively defined as four dimensions of sense of community.
Spirit denotes recognition of membership in a community and the feelings of friendship, cohesion, and bonding that develop among learners as they enjoy one another and look forward to time together. If community spirit is not felt, learners may feel lonely, isolated, and disconnected (Rovai, 2002).
Trust is the feeling that community members can be trusted and represents a willingness to rely on other members of the community in whom one has confidence. Trust is comprised of two components: credibility and benevolence. Credibility means the words of others in the community can be relied on, and benevolence is the extent that learners are genuinely interested in the welfare of others and are motivated to assist others in their learning (Rovai, 2002).
The third dimension of sense of community is interaction. Community is fostered through the quality of interactions, not through the quantity. Socioemotional tasks are directed toward the relationship
Intimacy
Engaging behaviorally to obtain a closeness with others
Authenticity
Engaging psychologially due to the quality of others' intentions and motivations
Immediacy
Baker, M., Chiasson, K., Mahar, P., Schroeder, S., & Terras, K. (2016). Students’ Desired and Experienced Levels of Connectivity to an Asynchronous, Online, Distance Degree Program. Online Learning 20 (3) 244 - 263.
among learners that are typically self-generated. These types of interactions range from empathetic messages to self-disclosure, with the more personal information being disclosed, the stronger the community becomes (Rovai, 2002).
The final dimension is learning. This is the commitment to a common educational purpose and epitomizes learner attitudes concerning the quality of learning. Thus, the community of learners grows to value learning and feels their educational needs are being satisfied through active participation in the community (Rovai, 2002).
This study examined the level of connectivity desired and experienced among those students studying entirely online in an asynchronous distance degree program. The electronic survey assessed the strength of graduate students’ connectivity to the program, other students in the program, instructors, and advisors. Connectivity was understood in relation to the students’ sense of community and level of social presence, as defined by the literature. The research questions were as follows:
1. How connected do graduate students studying in an online distance education program want to be with the program/other students/instructors/advisors?
2. How connected are graduate students studying in an online distance education program with the program/other students/instructors/advisors?
3. What demographic variables, if any, are correlated with levels of desired connectivity in each category?
4. What demographic variables, if any, are correlated with levels of experienced connectivity in each category?
Two theories provided the framework for this study and the research questions posed, to include sense of community and social presence. Supported in the literature is the understanding that social presence is positively correlated with building and sustaining a sense of community in the distance learning community.
Method
Participants
Participants were 100 graduate students enrolled in the Masters of Science in Special Education distance degree program through the Department of Teaching & Learning at a Midwest university. These participants were the respondents from the 327 eligible students who received the questionnaire. Thus, the response rate from the original population was 31%. Fourteen were incomplete and removed from the data set. An incomplete submission was defined as having failed to answer one or more questions in any matrix; this resulted in a 26% response rate. In order to compute a total score of connectivity for each student, and compare students by their identified demographics, researchers found it necessary to only include complete responses. Including partial response surveys would have skewed student comparisons and would not have allowed researchers to test the survey’s validity. In addition, incomplete surveys tended to be missing responses to more than 30% of the questions.
Respondents were predominately female (88%); had completed 13 or more credits (68%); were currently working in an educational setting (86%); were residing in the West or Midwest Region of the United States (85%); and had a 3.5 GPA or higher (83%).
Survey
The electronic survey was developed using the Qualtrics Research Suite—a widely available online survey tool. The surveys in this study were created, distributed, and analyzed from a secure sockets
Baker, M., Chiasson, K., Mahar, P., Schroeder, S., & Terras, K. (2016). Students’ Desired and Experienced Levels of Connectivity to an Asynchronous, Online, Distance Degree Program. Online Learning 20 (3) 244 - 263.
layer (SSL) encrypted site. The survey was developed from the theories of social presence and sense of community. Table 1 provides the constructs which were operationalized for this study by the research team, using the literature. Three to four survey indicators (questions) were written by the research team to reflect each of the listed dimensions in Table 1 for every category of experience (program, other students, advisors, and instructors). Note that the fourth component (learning) within sense of community was not utilized in developing the tool as this study sought to explore the level of connectivity without evaluation of the teaching/learning within the program.
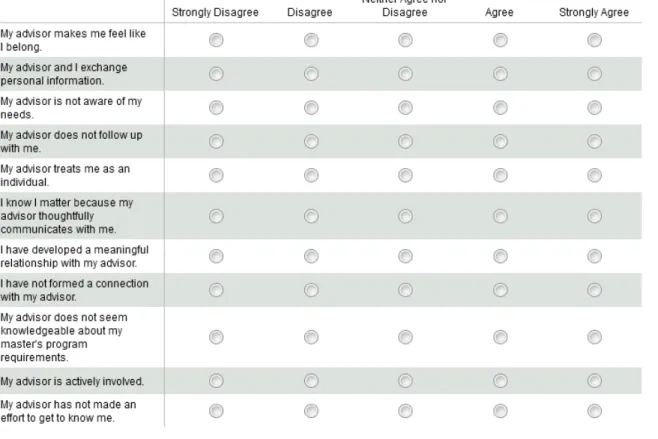
The indicators (Likert scale questions) were written, reviewed, and revised by the five-member research team until consensus was reached for each construct. A five-point Likert scale (strongly agree, agree, neither agree nor disagree, disagree, strongly disagree) was employed for each indicator with half of the indicators reverse coded. The indicators were then presented to faculty members within the Special Education program at the university of study. Faculty members provided feedback on word structure and content. Figure 2 provides an example of one of the four matrixes (one for the connectivity to the program, other students, instructors, and peers) as it appeared in the electronic survey.
Baker, M., Chiasson, K., Mahar, P., Schroeder, S., & Terras, K. (2016). Students’ Desired and Experienced Levels of Connectivity to an Asynchronous, Online, Distance Degree Program. Online Learning 20 (3) 244 - 263.
Table 1: Operational Definitions of Social Presence and Sense of Community Categories
Theory Dimension/Construct Definition Example survey indicator
S o ci al P rese n ce Immediacy
A student’s perceived
psychological/emotional distance (between /among instructors, peers, advisors); influenced by interpersonal communicative behaviors, both verbal and nonverbal.
“Program” Indicator: I have ample opportunities to engage with others in the program.
Authenticity
The quality and extent of personal disclosure; the expression of the genuine self.
“Advisor” Indicator: My advisor has not made an effort to get to know me.
Intimacy
“Closeness” obtained as a result of immediacy behaviors.
“Instructors” Indicator: Instructors make me feel that I matter.
S en se of C om m un it y Spirit
Recognition of membership in a community and the feelings of friendship, cohesion and bonding that develops among learners as they enjoy one another and look forward to time together.
“Other Students” Indicator: I look forward to
interacting with students in my online classes.
Trust
Feeling that community members can be trusted; represents a willingness to rely on other members of the community in whom one has confidence.
“Instructors” Indicator: Instructors create welcoming online environments.
Interaction Focus on quality interactions rather than quantity.
“Advisor” Indicator: My advisor and I have quality interactions.
Baker, M., Chiasson, K., Mahar, P., Schroeder, S., & Terras, K. (2016). Students’ Desired and Experienced Levels of Connectivity to an Asynchronous, Online, Distance Degree Program. Online Learning 20 (3) 244 - 263.
In addition to the constructs of connectivity, participants also responded to six demographic questions:
• Location (West region U.S., Midwest U.S., South U.S., Northeast U.S., Southeast U.S., International);
• Gender (male, female, other); • Categorical age (open response); • GPA (open response);
• Completed credits (0, 1-6, 7-12, 13-18, 19 or more); • Completed semesters (0, 1, 2, 3, 4, 5, 6 or more); and, • Current employment in an educational setting (yes or no).
Additionally, students interested in participating in a future follow-up interview were invited to share their contact information; however this information was not linked nor exported to their survey responses. Finally, the survey and the method for distribution was approved by the university’s Institutional Review Board.
All students enrolled in the Special Education, Masters’ of Science degree program at the identified university during spring semester of 2014 were invited to complete this electronic survey. The invitation to participate was sent along with three additional reminders to complete the survey.
The invitation to participate came from the Special Education faculty and was sent to advisees via email. The students were notified that their participation was voluntary and their advisors would not know who had or had not completed the survey. A drawing for five $25 gift cards was also offered as an incentive to participate. If respondents wanted to be eligible for the gift cards, they provided their name and contact information, but this information was not linked to the survey response items.
Data Analysis
To measure students’ strength of connectivity to the program, other students, instructors, and advisors, participants responded to 20-24 Likert scale questions for each category (other students, program, advisors, and instructors). See earlier Figure 2 for an example. The Likert scale included the following response options: strongly agree; agree; neither agree nor disagree; disagree; or strongly disagree. Roughly half of the Likert scaled questions were reverse coded so that a high score (5) was always indicative of strong, positive connectivity. As an example, strongly agree was coded as a five for the measure “I know students will respond to me in a constructive and supportive manner” while it received a one for indicators of poor connectivity, as in the item, “I am not comfortable asking questions of other students.”
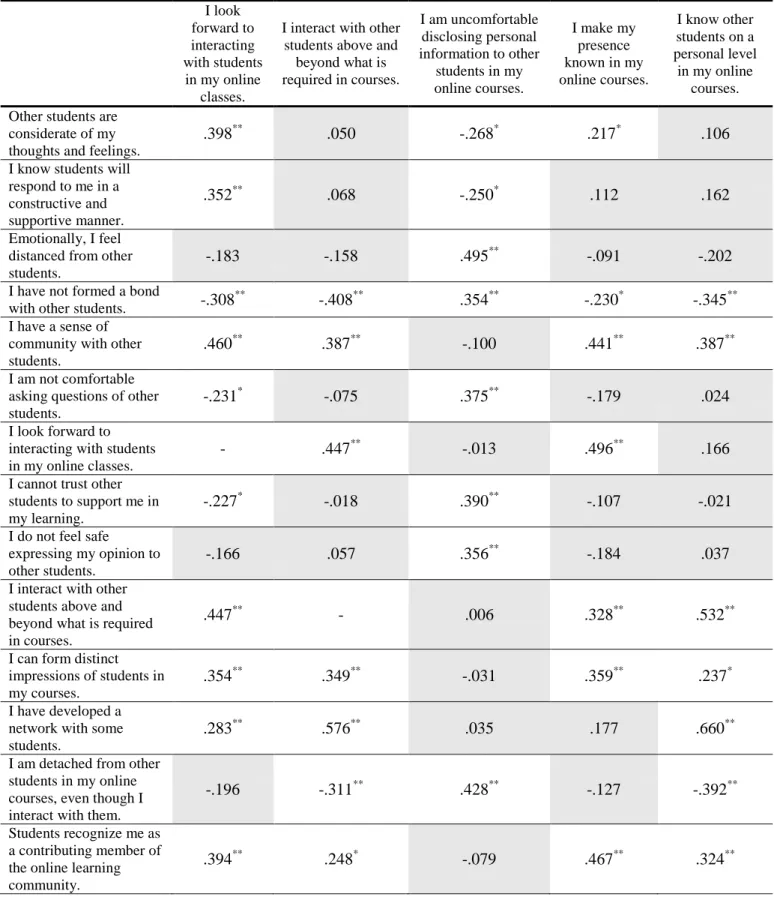
During a validity test and review of results, researchers found one variable within each category that was not highly correlated with other measures within that given category. These four variables were removed prior to analysis. These questions included language addressing “personal interactions” with students, advisors, the program, and instructors. It was noted that a “personal interaction” was not significantly correlated (at p<.05 or p<.01) to the level of connectivity in any category. After discussion, and review of the guiding theories, the research team identified that developing a personal relationship is a poor measure for overall connectivity.
Four additional variables were removed from the measure of connectivity with other students as they were not significantly correlated to seven or more other measurements (22 total) of connectivity to peers. The four identified variables had weak or no significant correlation to the other indicators within
Baker, M., Chiasson, K., Mahar, P., Schroeder, S., & Terras, K. (2016). Students’ Desired and Experienced Levels of Connectivity to an Asynchronous, Online, Distance Degree Program. Online Learning 20 (3) 244 - 263.
Table 2: Pearson Correlation for the Five Excluded Variables for Connectivity to Peers
I look forward to interacting with students
in my online classes.
I interact with other students above and
beyond what is required in courses.
I am uncomfortable disclosing personal information to other
students in my online courses.
I make my presence known in my online courses.
I know other students on a personal level in my online
courses. Other students are
considerate of my thoughts and feelings.
.398** .050 -.268* .217* .106
I know students will respond to me in a constructive and supportive manner.
.352** .068 -.250* .112 .162
Emotionally, I feel distanced from other students.
-.183 -.158 .495** -.091 -.202
I have not formed a bond
with other students. -.308
**
-.408** .354** -.230* -.345**
I have a sense of community with other students.
.460** .387** -.100 .441** .387**
I am not comfortable asking questions of other students.
-.231* -.075 .375** -.179 .024
I look forward to interacting with students in my online classes.
- .447** -.013 .496** .166
I cannot trust other students to support me in my learning.
-.227* -.018 .390** -.107 -.021
I do not feel safe
expressing my opinion to other students.
-.166 .057 .356** -.184 .037
I interact with other students above and beyond what is required in courses.
.447** - .006 .328** .532**
I can form distinct impressions of students in my courses.
.354** .349** -.031 .359** .237*
I have developed a network with some students.
.283** .576** .035 .177 .660**
I am detached from other students in my online courses, even though I interact with them.
-.196 -.311** .428** -.127 -.392**
Students recognize me as a contributing member of the online learning community.
Baker, M., Chiasson, K., Mahar, P., Schroeder, S., & Terras, K. (2016). Students’ Desired and Experienced Levels of Connectivity to an Asynchronous, Online, Distance Degree Program. Online Learning 20 (3) 244 - 263.
I look forward to interacting with students
in my online classes.
I interact with other students above and
beyond what is required in courses.
I am uncomfortable disclosing personal information to other
students in my online courses.
I make my presence known in my online courses.
I know other students on a personal level in my online
courses. I am dissatisfied with the
quality of interactions with other students in my online courses.
-.101 .059 .389** .044 -.066
I have meaningful exchanges with other students.
.487** .410** -.084 .270* .357**
Other students make their presence known in my online courses.
.436** .403** -.160 .499** .222*
I am uncomfortable disclosing personal information to other students in my online courses.
-.013 .006 - -.045 .063
I am an isolated learner
in my online courses. -.266
*
-.211 .342** -.277** -.126
I make my presence known in my online courses.
.496** .328** -.045 - .173
I know other students on a personal level in my online courses.
.166 .532** .063 .173 -
Interactions with other
students are superficial. -.179 -.220
*
.420** -.129 -.184
** Correlation is significant at the 0.01 level tailed) * Correlation is significant at the 0.05 level (2-tailed)
that category; all of which were highly correlated to one another. It was necessary to remove these items so that they would not skew respondents’ overall connectivity score. Table 2 highlights provides additional information about the five removed variables under connectivity to peers and the additional variables measuring connectivity to other students. The shaded items were uncorrelated.
Within each category of experienced connectivity, respondents had a calculated total connectivity score. This was derived by adding their response value to each Likert scale indicator in which half of the indicators were written in the negative and then reverse coded. Participants’ scores were then compared to the max value for each category (program connectivity [115 max score], connectivity to instructors [110], other students [85], and advisors [110]) as well as a total score of connectivity to include all of the above categories (added for a max value 420). Both raw scores and percent of experienced connectivity were utilized when looking for variability across all demographic variables.
Participants’ experienced connectivity scores and percentages were used to explore statistical differences of means when testing within geographic location, identified gender, work experience, categorical age, GPA, completed credits, number of completed semesters, and employment status. Researchers employed both one-way ANOVA and standard t tests (p<.05). Correlations were also calculated between numeric (ratio) age and total score in each category. Students desired connectivity
Baker, M., Chiasson, K., Mahar, P., Schroeder, S., & Terras, K. (2016). Students’ Desired and Experienced Levels of Connectivity to an Asynchronous, Online, Distance Degree Program. Online Learning 20 (3) 244 - 263.
was also compared to their experienced connectivity in each category through a one-way ANOVA and standard t test (p<.05).
Results
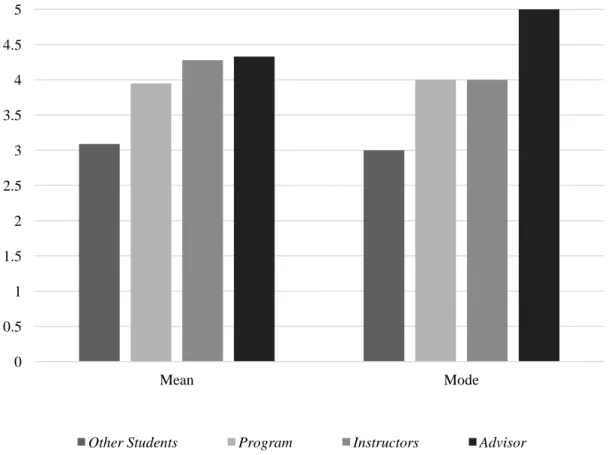
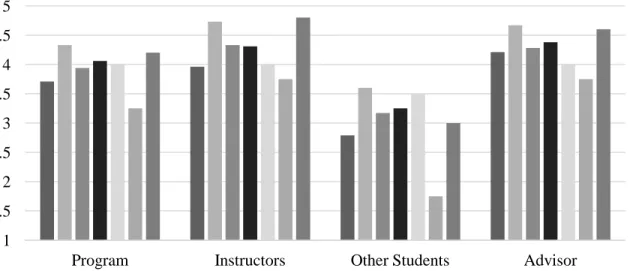
When asked how much connectivity they desired with their advisor, instructors, students, and the program as whole, it was evident that students desired very high connectivity with their instructors (48% of students indicated “very high”) and advisors (52%) with few wanting high connectivity with other students in the program (12%). Figure 3 corroborates the above conclusion and provides the means and modes for the level of connectivity desired among each category.
Figure 3. Level of Connectivity Desired among Online Students in the Special Education Program (1 = Very Low; 5 = Very High)
No statistically significant differences existed in the level of connectivity desired in any category when comparing: geographic location; employment status; number of credits completed; number of semesters complete; and GPA. Additionally, no significant correlation presented between ratio age and level of connectivity desired in any category. However, when age was tested categorically for desired connectivity there were statistically significant difference of means with other students (p=.043) and desired connectivity with instructors (p=.05) in the special education program. Table 3 details these findings.
0 0.5 1 1.5 2 2.5 3 3.5 4 4.5 5
Mean Mode
Baker, M., Chiasson, K., Mahar, P., Schroeder, S., & Terras, K. (2016). Students’ Desired and Experienced Levels of Connectivity to an Asynchronous, Online, Distance Degree Program. Online Learning 20 (3) 244 - 263.
Table 3: Average Level of Connectivity Desired with Other Students and Instructors by Age Category
Age Range Other Students* Instructors* Program Advisor
21-25 2.79 3.96 3.71 4.21
26-30 3.6 4.73 4.33 4.67
31-35 3.17 4.33 3.94 4.28
36-40 3.25 4.31 4.06 4.38
41-45 3.5 4 4 4
46-50 1.75 3.75 3.25 3.75
51 and older 3 4.8 4.20 4.60
Total
Average 3.09 4.28 3.95 4.33
Note: (1 = Very Low; 5 = Very High)
Figure 4. Difference in Desired Connectivity between Age Categories among Student Connectivity and Instructor Connectivity (1 = Very Low; 5 = Very High)
Table 3 and Figure 4 illustrate that those who were between 46 and 50 years of age wanted the least amount of connectivity with students, instructors, the program, and their advisors when compared to the other age cohorts; which again, was statistically significant among students and instructors. Similarly, those between 26 and 30 years of age desired higher connectivity across all categories with statistically significant differences among desired connectivity with students and instructors. Averages shaded in Table 1 indicate age categories desiring less connectivity than the overall student sample (average). Those 21-25 and 46-50 years of age desired less connectivity across all categories than the average overall student sample. Conversely, those 26-30 and 36-40 years old desired higher connectivity across all categories when compared to the other five age groups.
No significant correlation existed between ratio age and experienced connectivity among any category. Experienced connectivity in one category was highly correlated with experienced connectivity in another. The strongest correlations were between a students’ connectivity to the program and their instructors, and connectivity to the program and their advisors. See Table 3.
1 1.5 2 2.5 3 3.5 4 4.5 5
Program Instructors Other Students Advisor
Baker, M., Chiasson, K., Mahar, P., Schroeder, S., & Terras, K. (2016). Students’ Desired and Experienced Levels of Connectivity to an Asynchronous, Online, Distance Degree Program. Online Learning 20 (3) 244 - 263.
Table 4: Correlations for Student Levels of Connectivity to the Program, Advisors, Instructors, Other Students, and Overall Total Connectivity (N=86)
Program Advisor Instructor Other students Total connectivity
1.Total “Program” Score
2.Total “Advisor” .742** _
3.Total “Instructor” .743** .512** _
4.Total “Other Students” .577** .273* .654** _
5.Total Connectivity .927** .780** .882** .724** *p<0.05; ** p<0.01
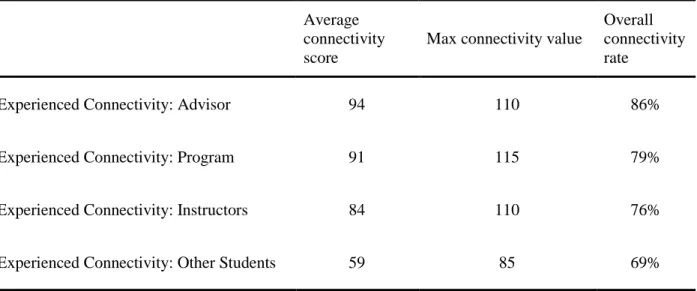
Students indicated the strongest connectivity with their advisors (86% total rate of connectivity based on total student score over max value), followed by high connectivity with the program as a whole (79%), and their instructors (76%), with the lowest level of connectivity being experienced with other students in the program (69%). Table 5.
Table 5: Students’ Average Scores and Rates of Connectivity with Advisors, Instructors, Other Students and the Program
Average connectivity score
Max connectivity value
Overall connectivity rate
Experienced Connectivity: Advisor 94 110 86%
Experienced Connectivity: Program 91 115 79%
Experienced Connectivity: Instructors 84 110 76%
Experienced Connectivity: Other Students 59 85 69%
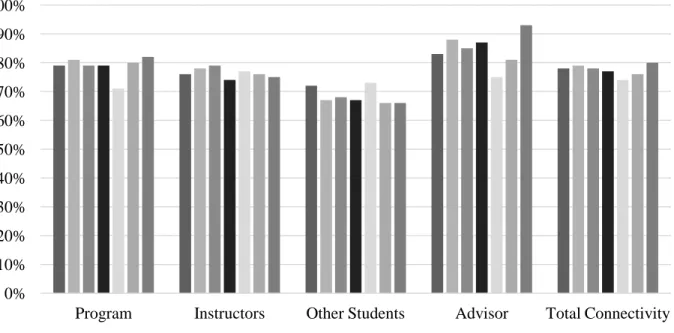
No statistically significant differences of means (ANOVA or t test) existed between experienced connectivity scores and the specified age categories. Though not statistically significant, students 51 and older experienced the highest overall rate of connectivity (80%) with those 41-45 years of age reporting the lowest total rate of connectivity (74%). See Figure 5 and Table 6.
Baker, M., Chiasson, K., Mahar, P., Schroeder, S., & Terras, K. (2016). Students’ Desired and Experienced Levels of Connectivity to an Asynchronous, Online, Distance Degree Program. Online Learning 20 (3) 244 - 263.
Figure 5. Percent of Experienced Connectivity to the Program, Students, Instructors, and Advisors by Age Category (N=86)
Table 6 illustrates that raw data utilized to create Figure 5. Though the differences were not statistically significant, the table does demonstrate where each age cohort experienced the greatest connectivity. For example, students between the ages of 21-25 reported the greatest connectivity to their advisors. The only age group this was not true for were those between 41 and 45 years of age.
Table 6: Total Average Score and Rate of Experienced Connectivity with the Program, Instructors, Other Students, Advisors, and Overall Connectivity by Age Categories
Age range Program Instructors Other students Advisor Total connectivity
Mean % Mean % Mean % Mean % Mean %
21-25 91 79% 84 76% 61 72% 91 83% 327 78%
26-30 93 81% 86 78% 57 67% 97 88% 333 79%
31-35 91 79% 87 79% 58 68% 93 85% 329 78%
36-40 91 79% 81 74% 57 67% 96 87% 325 77%
41-45 82 71% 85 77% 62 73% 82 75% 311 74%
46-50 92 80% 84 76% 56 66% 83 81% 320 76%
51 and older 94 82% 83 75% 56 66% 102 93% 335 80%
Total Average 91 79% 84 76% 59 69% 94 86% 328 78%
Max Value 115 100% 110 100% 85 100% 110 100% 420 100% 0%
10% 20% 30% 40% 50% 60% 70% 80% 90% 100%
Program Instructors Other Students Advisor Total Connectivity
Baker, M., Chiasson, K., Mahar, P., Schroeder, S., & Terras, K. (2016). Students’ Desired and Experienced Levels of Connectivity to an Asynchronous, Online, Distance Degree Program. Online Learning 20 (3) 244 - 263.
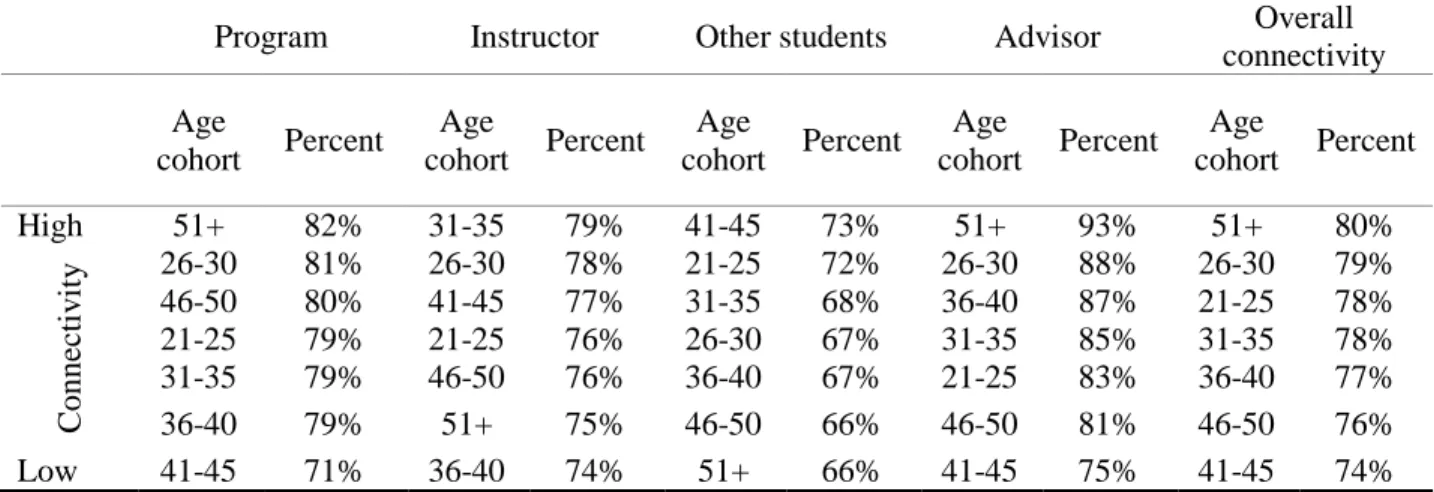
Table 7 presents the rank order of connectivity scores by age cohort and categories. Among every age cohort, the lowest connectivity score related to connectivity with other students.
Table 7: Highest and Lowest Student Connectivity Scores in Each Category Rank by Age
Program Instructor Other students Advisor Overall connectivity Age
cohort Percent
Age
cohort Percent
Age
cohort Percent
Age
cohort Percent
Age
cohort Percent
High 51+ 82% 31-35 79% 41-45 73% 51+ 93% 51+ 80%
C
onne
ct
iv
it
y 26-30 81% 26-30 78% 21-25 72% 26-30 88% 26-30 79% 46-50 80% 41-45 77% 31-35 68% 36-40 87% 21-25 78% 21-25 79% 21-25 76% 26-30 67% 31-35 85% 31-35 78% 31-35 79% 46-50 76% 36-40 67% 21-25 83% 36-40 77% 36-40 79% 51+ 75% 46-50 66% 46-50 81% 46-50 76% Low 41-45 71% 36-40 74% 51+ 66% 41-45 75% 41-45 74%
Of most importance in Table 7 is the rank order of age categories for overall connectivity. This data demonstrated that those 51 and older (the oldest student cohort) reported the highest connectivity to their online program. The next two age categories with similar connectivity scores were the youngest two age cohorts (26-30 and 21-25). The youngest and oldest student participants reported the highest connectivity to the online program.
Discussion
In 2013, 77% of academic leaders polled indicated that they believed online courses to be the same as or superior to those offered in face-to-face delivery mode (Allen & Seaman). Yet, they also reported they felt student retention rates were lower in online courses than in traditional face-to-face. Something is obviously not working.
In an effort to ameliorate this, faculty who teach in online environments and researchers who study student learning outcomes are examining the nature of this pedagogy. One fruitful area of research is related to “social presence.” One study by Richardson and Swan (2003) examined the relationship among students’ perceived social presence, their perceived learning, and their satisfaction with their instructor and found that the higher the students’ perceived social presence in their online courses, the higher they perceived their learning to be and the greater satisfaction they reported with their instructor. This indicates that instructors must increase the “presence” or level of connectivity students feel in their courses to increase their perceived learning and their satisfaction.
How can one increase this “presence?” It seems simple: increase the high-quality interactions students have in the online environment with their instructors (Starr-Glass, 2011). To further connect students, institutions of higher education must also ensure that the academic advisors are helping students feel connected to them, and thereby to their programs, overall. Although research seems to indicate that social presence or connectivity seems to be the key to student success, do all of these distance students truly desire it? And, if they do not, can our actions make them feel that connectedness despite their desires?
To that end, this study investigated the level of connectivity online, distance education students both
Baker, M., Chiasson, K., Mahar, P., Schroeder, S., & Terras, K. (2016). Students’ Desired and Experienced Levels of Connectivity to an Asynchronous, Online, Distance Degree Program. Online Learning 20 (3) 244 - 263.
results showed that students both desired and experienced strong connectivity to the program, their advisors, and their instructors and lower connectivity to their fellow students. Other than categorical age, participants’ demographics did not influence their desired connectivity. Specifically, three significant findings were noted:
1. Students desired high connectivity overall, with the greatest connectivity desired with advisors and the least connectivity desired with other students.
2. Participants desired connectivity varied between age cohorts with statistically significant differences with regard to desired connectivity with instructors, and other students.
3. Students experienced high connectivity.
Finding 1: Connectivity to Advisors Greater than Student Connectivity
All age groups desired some level of connectivity with the program, instructors, advisors, and other students. No demographic or cohort did not desire connectivity with their online learning experience. However, participants did indicate wanting higher levels of connectivity with their instructors and advisors while only 12% of students desired very high connectivity with their peers. Instructors have been focusing on facilitating a sense of community in their online courses so students can have a presence in that environment. However, students are more concerned with establishing and maintaining that sense of connection to their academic advisors first, their instructors second, their program third, and then their fellow students. Does this imply that they do not wish to be connected to their peers? Most likely, not. As Woods and Baker (2004) noted, “a sufficient level of interaction with faculty generally creates a ‘sense of personalization and customization of learning’ and helps students overcome feelings of remoteness – perhaps the greatest obstacle to fostering a student’s sense of community in online distance learning” (p. 6). It is high connectivity to their advisors and instructors that students seek. It is the strong connectivity experienced with their advisors and instructors then that ties the students to their institution of higher education and their academic program. Further research should explore the reason online learners, overall, do not desire higher connectivity with their peers.
Finding 2: Influence of Age on Desired Connectivity
There was, however, an interesting difference with regard to age and desired connectivity. Students between the ages of 46 and 50 years of age desired the least amount of connectivity with both students and instructors. Conversely, those between 26 and 30 years of age desired higher connectivity with both students and instructors. On the surface, these results seem to be disparate to the findings of Mykota and Duncan (2007), who ascertained that it was not the age of the learner that impacted the computer-mediated communication skills or affective communication, but rather the individual learner characteristics, number of online courses taken, and computer proficiency. The majority of the students who participated in the 2007 study (67.5%), like the current study (68%), had completed more than 13 of the 32 credits required for their degrees, and therefore must have had some degree of proficiency in the online environment. Their desired level of connectivity was most likely not the result of their comfort level with the technology and the technological environment, but rather a personal preference.
This finding aligns with those of Swan and Shih (2005) who found that students under 26 years of age reported feeling more social presence in online discussions than did those over 45. Based upon follow-up interviews, they postulated that this may have been because those 45 and older could not or had not “bonded” with their younger peers rather than what most would assume to be technological issues or learning mode preferences of older adults (p. 123). When examining the population of students who participated in this study, it should be noted that a majority of the students enrolled in the distance degree program of study were in the younger age groupings, and therefore older participants may not have desired strong connectivity to their fellow students because they did have a significant age disparity and did not perceive that they could feel connected to them.
Baker, M., Chiasson, K., Mahar, P., Schroeder, S., & Terras, K. (2016). Students’ Desired and Experienced Levels of Connectivity to an Asynchronous, Online, Distance Degree Program. Online Learning 20 (3) 244 - 263.
Finding Three: Students Experienced High Connectivity
Regardless of desired connectivity, all participants experienced high or very high connectivity with instructors, advisors, peers, and their program. The greatest level of connectivity was experienced between the online learners and their advisors. Every age grouping indicated high connectivity with their advisors. The students’ overall connectivity to their online degree and institution was largely the responsibility of individuals charged with overseeing the students’ education.
This finding is unsurprising as it has been found that academic advisement is vital to a student’s success within any program of study: it effects both student retention and student satisfaction (Corts, et al., 2000). In the online environment advising may look somewhat different, but it serves the same purpose: to advise the students on the courses they are to take and to aide them in navigating the requirements of the university and the online classroom.
Student Connectivity with Advisors
Crookston (1972) conceptualized advising as a form of teaching and described two styles of academic advising: developmental and prescriptive. In this particular program, the form of academic advising provided can be considered to be developmental: advisors form a more personal relationship with their advisees which integrates academic, career, and personal goals. With an online, asynchronous program, this may be somewhat difficult to envision. For this particular program, all advisors utilized advising websites, held “online office hours,”, and created academic plans for their advisees early on in their master’s programs. The academic plans are tailored to meet the personal situation of the student, while providing a clear road map linking the program’s requirements, course offerings and course rotation schedule. The platform utilized to make the connection to their students may be different from the traditional advisor in a face-to-face program, but the purposes served and the services provided are very similar.
Student Connectivity with Peers
While students experienced high connectivity overall, it was lowest among their peers. Every age cohort scored their desired and experienced connectivity lowest among peers compared to instructors, advisor, and program. While much research has been conducted to show instructors ways to help students make connections to other students, the participants noted not feeling connected, nor did they greatly desire to have high connectivity with their peers. Does this finding indicate that instructors need not feel as concerned as they are about student-to-student interactions? Not necessarily. Students in the online programs were simply less concerned and less desirous of that connection than they were about connections to their advisors, programs, and instructors. It would suggest that it is more valuable to focus on students’ connectivity to advisors, the program, and instructors prior to concern over peer connectivity; not that peer connectivity is entirely unimportant.
The online learners’ lack of connectivity and lower desire to connect with their peers is readily understood in Diaz and Cartnal’s (1999) explanation. Diaz and Cartnal (1999) compared the learning style preferences of students enrolled in distance education and equivalent on-campus classes. They found that the distance education students had statistically significant higher scores on the independent learning style scale and lower scores on the dependent scale. The 1999 study found that “students prefer independent study and self-paced instruction and would prefer to work alone rather than with other students on course projects” (1999, p. 132). This may explain the lower peer connectivity scores found in this study. The students’ desire for the degree and the future profession would explain their greater desire for a connection to the program, the advisors, and instructors who help them achieve their goals.
Student Connectivity with Instructors
With regard to student connection to instructors, this research corroborates what others have found, and is able to explain research that has previously been in conflict. Reupert, Mayberry, Patrick,
Baker, M., Chiasson, K., Mahar, P., Schroeder, S., & Terras, K. (2016). Students’ Desired and Experienced Levels of Connectivity to an Asynchronous, Online, Distance Degree Program. Online Learning 20 (3) 244 - 263.
and Chittleborough (2009) stated that students needed online instructors to provide a personal presence by being engaging, approachable, understanding, patient, and passionate about the subject. This research illustrates how important the social presence of the instructor is for students’ overall connectivity to their distance degree program, indicating that it may be the most important relationship an online learner has within the program.
Drouin and Vartanian (2010) had challenged this notion and concluded that not all students desired a social connection with their instructors and classmates (2010), rather the flexibility of online learning (Mayberry et al., 2009). Not all students did desire a strong connection (rated “very high”) with the categories studied, however, participants experienced and desired strong connectivity with their instructors. Findings of the present study do support the above conclusion; online learners did not desire to have strong connectivity with their peers. As a result, the level of experienced connectivity to other students is much lower than the level of connectivity with instructors and advisors in an online program.
Limitations
This study was limited by the small sample size. In addition, results speak to data derived from students in one online graduate program within a single department at one university. This study was completed only by students enrolled in the Special Education graduate program in the Teaching & Learning department. Further study of students completing a graduate degree program online within the same university, but in a different department, could illustrate if level of desired and experienced connectivity was indicative of the program or department. The survey tool should also be used across other programs, departments, and universities to compare and contrast online versus face-to-face student connectivity within and across programs. Results of such studies may identify universities, programs, and/or departments that have high connectivity, providing best practices for those institutions that struggle providing quality distance programs, or for those that have low online retention rates.
Recommendations for Further Research
The survey tool created in this study has proven to be a strong tool for measuring online student connectivity with greater strength in measuring level of connectivity to online programs, advisors, and instructors. Slight revisions to the survey are warranted with regarded to connectivity with other students and were reflected in the constructs removed from analysis. Future research is encouraged to employ the new tool to measure both desired and experienced connectivity simultaneously, as opposed to previous research that has explored only one, or the other. Researchers, advisors, instructors, and other academicians will best be served when they understand both the student experience, and his/her desired level of connectivity.
Further study may explore the age variation identified in this research. A study among a larger population with a larger sample in each age category may lead to more significant differences. It is also recommended that if future research identifies similar trends, qualitative research explore why the oldest and youngest cohorts report similar (higher) connectivity than all other aged peers.
The high levels of student experience connectivity to this program and its components may be the result of the degree. The survey was employed among students studying education, a profession more dependent on strong future connectivity. This tool should be utilized to study connectivity among a variety of distance degree programs, looking for trends, variation, and relationships between academic departments, programs, and degree level. For these future studies, it would be important to capture additional program demographics allowing researchers to control for time in the program, credits required, type of instruction, and level of required peer interaction within the program, as an example.
Baker, M., Chiasson, K., Mahar, P., Schroeder, S., & Terras, K. (2016). Students’ Desired and Experienced Levels of Connectivity to an Asynchronous, Online, Distance Degree Program. Online Learning 20 (3) 244 - 263.
Future qualitative research may also begin to identify methods for improving student connectivity in each of the four identified categories while also searching to understand why some students want more or less connectivity than others.
References
Allen, I. E., & Seaman, J. (2013). Changing course: Ten years of tracking online education in the United States. Babson Park, MA: Babson Survey Research Group and Quahog Research Group, LLC.
Aragon, S. R. (2003). Creating social presence in online environments. New Directions for Adults and Continuing Education, 100, 57-68.
Arbaught, J. B. (2001). How instructor immediacy behavior affect student satisfaction and learning in web-based courses. Business Communication Quarterly, 64(4), 42-54.
Capdeferro, N., & Romero, M. (2012, April). Are online learners frustrated with collaborative learning experiences? The International Review of Research in Open and Distance Learning, 13(2), 26-44.
Corts, D. P., Lounsbury, J. W., Saudargas, J. W., Tatum, R. A., & Holly, E. (2000). Assessing
undergraduate satisfaction with an academic department: A method and case study. College Study Journal, 34(3), 399-408.
Cranton, P. (2001). Becoming an authentic teacher in higher education. Malabar, FL: Krieger.
Crookston, B. B. (1972). A developmental view of advising as teaching. Journal of College Student Personnel, 13(1), 12-17.
Diaz, D. P., & Cartnal, R. B. (1999). Students’ learning styles in two classes: Online distance learning and equivalent on-campus. College Teaching, 47(4), 130-135.
DiRamio, D., & Woverton, M. (2006). Integrating learning communities and distance education: Possibility or pipedream? Innovative Higher Education, 31(2), 99-113.
Drouin, M., & Vartanian, L. R. (2010). Students’ feelings of and desire for sense of community in face-to-face and online courses. The Quarterly Review of Distance Education, 11(3), 147-159.
Gunawardena, C. N., & Zittle, F. J. (1997). Social presence as a predictor of satisfaction within a computer-mediated conferencing environment. The American Journal of Distance Education, 11(3), 8-26.
Heyman, E. (2010). Overcoming student retention issues in higher education online programs. Online Journal of Distance Learning Administration, 8(4).
Hoyer, J. (2006). Technology integration in education: The dilemma of shifting paradigms. International Journal of Learning, 12(6), 1-8.
Kehrwald, B. (2008). Understanding social presence in text-based online learning environments. Distance Education, 29(1), 89-106.
Baker, M., Chiasson, K., Mahar, P., Schroeder, S., & Terras, K. (2016). Students’ Desired and Experienced Levels of Connectivity to an Asynchronous, Online, Distance Degree Program. Online Learning 20 (3) 244 - 263.
Lee, Y., & Choi, J. (2011). A review of online course dropout research: Implications for practice and future research. Education Tech Research Development, 59, 593-618.
McMillan, D. W., & Chavis, D. M. (1986). Sense of community: A definition and theory. Journal of Community Psychology, 14(1), 6-23.
Mykota, D., & Duncan, R. (2007). Learner characteristics as predictors of online social presence.
Canadian Journal of Education, 30(1), 157-170.
Pigliapoco, E., & Bogliolo, A. (2008). The effects of psychological sense of community in online and face-to-face academic courses. International Journal of Emerging Technologies in Learning,
3(4), 60–69.
Reupert, A., Mayberry, D., Patrick, K., & Chittleborough, P. (2009). The importance of being human: Instructors’ personal presence in distance programs. International Journal of Teaching and Learning in Higher Education, 21(1), 47-56.
Rovai, A. (2002). Building sense of community at a distance. International Review of Research in Open and Distance Learning, 3(1), 1-16.
Rovia, A., & Wighting, M. (2005). Feelings of alienation and community among higher education learners in a virtual classroom. Internet and Higher Education, 8, 97-110.
Schwartz, H. L., & Holloway, E. L. (2012). Partners in learning: A grounded theory study of relational practice between master’s students and professors. Mentoring & Tutoring: Partnership in Learning, 20(1), 115-135.
Short, J., William, E., & Christie, B. (1976). The social psychology of communication. New York, NY: John Wiley.
Stanford-Bowers, D. E. (2008). Persistence in online classes: A study of perceptions among community college stakeholders. Journal of Online Learning and Teaching, 4(1). Retrieved from
http://jolt.merlot.org/vol4no1/stanford-bowers0308.pdf
Starr-Glass, D. (2011). Beginning course surveys: Bridge for knowing and bridges for being. The International Review of Research in Open and Distance Learning, 31(5), 537-548.
Swan, K., & Shih, L. F. (2005). On the nature and development of social presence in online course discussion. Journal of Asynchronous Learning Networks, 9, 115-136.
Terry, N. (2007). Assessing instruction modes for master of business administration (MBA) courses.
Journal of Education for Business, 82(4), 220-225.
Veenstra, C. P. (2009). A strategy for improving freshman college retention. Journal for Quality and Participation, 31(4), 19-23.
Woods, R. H., & Baker, J. D. (2004). Interaction and immediacy in online learning. International Review of Research in Open and Distance Learning, 5(2), 1-13.
Zembylas, M., Theodorou, M., & Pavlakis, A. (2008). The role of emotions in the experience of online learning: Challenges and opportunities. Educational Media International, 45(2),107-117.