R E S E A R C H A R T I C L E
Open Access
Effect of calories-only vs physical activity
calorie expenditure labeling on lunch
calories purchased in worksite cafeterias
Anthony J. Viera
1,1*, Ziya Gizlice
2, Laura Tuttle
3, Emily Olsson
3, Julie Gras-Najjar
4, Derek Hales
5, Laura Linnan
5,
Feng-Chang Lin
3,6, Seth M. Noar
7and Alice Ammerman
2,8Abstract
Background:Calorie labeling on restaurant menus is a public health strategy to guide consumer ordering behaviors, but effects on calories purchased have been minimal. Displaying labels communicating the physical activity required to burn calories may be a more effective approach, but real-world comparisons are needed. Methods:In a quasi-experimental study, we examined the effect of physical activity calorie expenditure (PACE) food labels compared to calorie-only labels on point-of-decision food purchasing in three worksite cafeterias in North Carolina. After a year of quarterly baseline data collection, one cafeteria prominently displayed PACE labels, and two cafeterias prominently displayed calorie-only labels. Calories from foods purchased in the cafeteria during lunch were assessed over 2 weeks every 3 months for 2 years by photographs of meals. We compared differences in purchased calorie estimates before and after the labeling intervention was introduced using longitudinal generalized linear mixed model regressions that included a random intercept for each participant.
Results:In unadjusted models comparing average meal calories after vs before labeling, participants exposed to PACE labels purchased 40.4 fewer calories (P= 0.002), and participants exposed to calorie-only labels purchased 38.2 fewer calories (P= 0.0002). The small difference of 2 fewer calories purchased among participants exposed to PACE labeling vs calorie-only labeling was not significant (P= 0.90). Models adjusting for age, sex, race, occupation, numeracy level, and health literacy level did not change estimates appreciably.
Conclusion:In this workplace cafeteria setting, PACE labeling was no more effective than calorie-only labeling in reducing lunchtime calories purchased.
Keywords:Calorie labeling, Physical activity, Obesity prevention policy
Background
Over one-third of adults in the United States (US) are obese, and obesity is a significant risk factor for heart disease, stroke, hypertension, diabetes, and certain can-cers, in addition to all-cause mortality [1,2]. The obesity epidemic has been linked to both dietary habits and in-adequate levels of physical activity. Americans consume almost one-third of their daily calories from food pur-chased away from the home [3]. With higher calorie
content and larger portion sizes, food purchased away from home has been implicated in the high prevalence of obesity [4, 5]. One policy approach to try to curb the obesity epidemic is the requirement included in the 2010 Patient Protection and Affordable Care Act requir-ing restaurants with 20 or more locations to post calorie information on their menu boards. However, evidence supporting this type of calorie labeling is mixed, with systematic reviews suggesting limited effectiveness in de-creasing the amount of calories people order or con-sume [6,7].
Calorie information alone may not be sufficient to mo-tivate behavior change, especially when making a deci-sion at the point of purchase (such as in a fast food or * Correspondence:[email protected]
1
Department of Community and Family Medicine, Duke University School of Medicine, 2200 West Main Street, Suite 400, Durham, NC 27705, USA
1Department of Community and Family Medicine, Duke University School of
Medicine, 2200 West Main Street, Suite 400, Durham, NC 27705, USA Full list of author information is available at the end of the article
cafeteria line) where distractions and time-pressures are common. People may not fully appreciate the effect of caloric intake from individual food items on maintaining a healthy weight. Even if people understand the effect of eating too many calories, behavioral economic theory suggests that the lack of influence of calorie labeling may be due to its reliance on the“rational”system rather than the“intuitive” system. In other words, making use of calorie information may be hampered by limited time or willingness for cognitive processing. Framing calorie information by indicating the amount of physical activity required to burn calories may be more intuitive in that it translates to something (e.g., walking distance) people easily understand. Therefore, such re-framing may result in greater influence on point-of-purchase consumer be-havior. An additional potential benefit of such labels is that they may promote physical activity.
In our pilot work, we found in a randomized, con-trolled trial using hypothetical fast-food restaurant sce-narios that people selected a meal totaling fewer calories when shown our PACE labels vs calorie-only labels (826 cals vs 927 cals) [8]. To begin to explore whether such an effect is seen on actual behavior in real-world set-tings, we conducted a quasi-experimental trial to exam-ine the effect of PACE labels compared to calorie-only labels on average purchased calories per meal during lunchtime in three worksite cafeterias.
Methods
Study overview
The overall design of the PACE Study has been previ-ously published in detail [9]. In brief, we partnered with Blue Cross and Blue Shield of North Carolina (BCBSNC) to examine the effects of PACE labels compared to calorie-only labels in three worksite campus cafeterias. Employees who regularly ate lunch in the campus cafete-rias were invited to participate in the study. During a pre-intervention year, we collected baseline data from participants in all three cafeterias. At the beginning of the second year of the study, one cafeteria had its food items prominently labeled with PACE labels and two caf-eterias had their food items labeled with calorie-only in-formation. The reasons for combining two cafeterias were (1) to maintain enough cohort participants over the duration of the study, and (2) to better balance the characteristics of employees.
Primary outcome
The primary outcome was calories purchased during lunchtime as measured every 3 months over a 2-year period by individuals enrolled in two cohorts. This out-come was assessed at baseline (prior to labeling) and during the 1-year labeling intervention.
Participant recruitment and eligibility
We advertised the study using paper and electronic flyers. Study coordinators actively recruited participants in the worksite cafeterias by setting up an informational table for employees to visit and to learn more about or sign up for the study. Enrollment of participants contin-ued on a rolling basis throughout the baseline year to help compensate for attrition. To be eligible, a partici-pant needed to (1) be a BCBSNC employee or contrac-tor, and (2) eat lunch or be willing to eat lunch in the BCBSNC cafeteria at least 3 times per 5-day work week.
Outcome measure
We collected detailed information on the lunch pur-chases made by the participants using a specially de-signed photo capture system. The system consisted of a touchscreen monitor and camera positioned above a shelf that allowed participants to take a picture of their entire meal contents. Photographs were saved with the participants’ study identification number, initials, date and site location. Study coordinators were on-site during all data collection periods to record details that may not have been evident from the photograph (e.g., dressings, condiments, soup or drink contents).
Participants submitted lunch photos over 2-week pe-riods on a quarterly basis during the 24-month study period. Study staff analyzed all lunch photos and entered calorie information into a detailed database. For any items requiring estimation of portion sizes (e.g., self-serve items or self-built salads), Study coordinators used a food atlas along with their on-site notes to estimate portion sizes [9].
Labeling intervention
Following the year of baseline data collection, one cafe-teria received PACE labels which showed the calories in the food as well as an image of someone walking and the estimated number of miles needed to“burn off”the calories [9]. We determined PACE label values as previ-ously described [9]. The two other cafeterias received calorie-only labels. The labels, which were bright green, bright blue, or bright yellow and measured 3 X 4 in., were prominently displayed above or beside each food item. For food prepared to order at the grill and deli, lists of commonly purchased items were posted with the PACE or calorie label [9]. For salad bars, we posted lists of common items as well as representative salads show-ing the sum of calories or PACE equivalent from all in-gredients included. Beverage cooler doors were labeled with lists of all their beverages.
Statistical considerations and analysis plan
standard deviation of purchased lunch meals is 350 cal and expected that the PACE labeling intervention would reduce purchase calories by 100 cal based on our preliminary study [8]. There were four measures of purchased calories (one for each quarter) prior to the intervention and four after the intervention. We analyzed purchased calorie data from all time points using a longitudinal generalized linear mixed model (GLMM) that included study groups, time, and study group by time interaction as fixed effects, each partici-pant as random effect and a covariance structure that provided the best fit for the model to obtain estimates of slopes before and after introducing the calorie label interventions and compared between groups. We compared baseline sample characteristics of the two study groups using t-test and chi-square tests. Study groups differed significantly for age, sex, race, and occupation categories. These variables were included as fixed covariates along with literacy and numeracy scores (considered a priori) in a similar GLMM to compare slopes before and after the interventions between groups. In addition, a small number of partic-ipants changed worksite cafeterias prior to the intervention, so we analyzed participants using the same GLMMs based on the cafeteria in which they took > 50% of their lunch photos during the interven-tion year.
Results
Baseline characteristics of participants
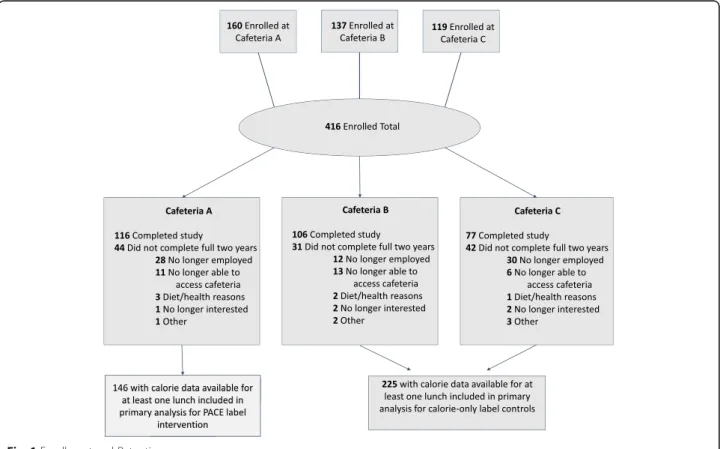
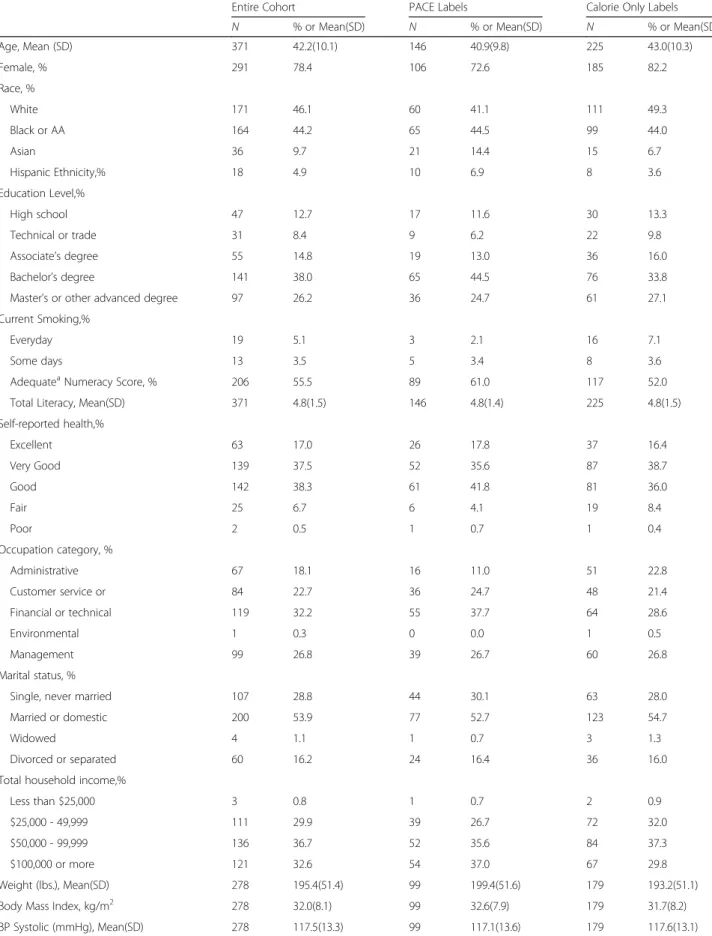
A total of 416 individuals initially consented to be in the study. Due to relocations, layoffs, and other life circum-stances, some employees did not participate for the full 2 years. A total of 371 participants contributed lunch-time photographic lunch tray data to at least one of 8 time points (Fig1). The majority of the 371 participants were female (78.4%), and the sample was racially diverse with 46% white and 44% Black (Table1). The mean body mass index in the cohort at baseline was 32.0 kg/m2and did not differ significantly between groups. The demo-graphics of the cohort reflected those of the entire em-ployee population. Characteristics that differed between the participants across worksites included age, sex, race and occupational roles.
Average meal calorie purchases
During the baseline year, 371 of the enrolled participants submitted a total of 4721 lunch photographs. During the intervention year, 246 of the participants submitted 3237 photographs. The averages of meal calories over each data collection period in intervention vs. comparison groups are shown in Table2. The averages were lower in the calories-only group at all eight time points.
In unadjusted models comparing average meal calories after vs before labeling, participants exposed to PACE
Table 1Characteristics of cohort participants
Entire Cohort PACE Labels Calorie Only Labels
N % or Mean(SD) N % or Mean(SD) N % or Mean(SD)
Age, Mean (SD) 371 42.2(10.1) 146 40.9(9.8) 225 43.0(10.3)
Female, % 291 78.4 106 72.6 185 82.2
Race, %
White 171 46.1 60 41.1 111 49.3
Black or AA 164 44.2 65 44.5 99 44.0
Asian 36 9.7 21 14.4 15 6.7
Hispanic Ethnicity,% 18 4.9 10 6.9 8 3.6
Education Level,%
High school 47 12.7 17 11.6 30 13.3
Technical or trade 31 8.4 9 6.2 22 9.8
Associate’s degree 55 14.8 19 13.0 36 16.0
Bachelor’s degree 141 38.0 65 44.5 76 33.8
Master’s or other advanced degree 97 26.2 36 24.7 61 27.1
Current Smoking,%
Everyday 19 5.1 3 2.1 16 7.1
Some days 13 3.5 5 3.4 8 3.6
AdequateaNumeracy Score, % 206 55.5 89 61.0 117 52.0
Total Literacy, Mean(SD) 371 4.8(1.5) 146 4.8(1.4) 225 4.8(1.5)
Self-reported health,%
Excellent 63 17.0 26 17.8 37 16.4
Very Good 139 37.5 52 35.6 87 38.7
Good 142 38.3 61 41.8 81 36.0
Fair 25 6.7 6 4.1 19 8.4
Poor 2 0.5 1 0.7 1 0.4
Occupation category, %
Administrative 67 18.1 16 11.0 51 22.8
Customer service or 84 22.7 36 24.7 48 21.4
Financial or technical 119 32.2 55 37.7 64 28.6
Environmental 1 0.3 0 0.0 1 0.5
Management 99 26.8 39 26.7 60 26.8
Marital status, %
Single, never married 107 28.8 44 30.1 63 28.0
Married or domestic 200 53.9 77 52.7 123 54.7
Widowed 4 1.1 1 0.7 3 1.3
Divorced or separated 60 16.2 24 16.4 36 16.0
Total household income,%
Less than $25,000 3 0.8 1 0.7 2 0.9
$25,000 - 49,999 111 29.9 39 26.7 72 32.0
$50,000 - 99,999 136 36.7 52 35.6 84 37.3
$100,000 or more 121 32.6 54 37.0 67 29.8
Weight (lbs.), Mean(SD) 278 195.4(51.4) 99 199.4(51.6) 179 193.2(51.1)
Body Mass Index, kg/m2 278 32.0(8.1) 99 32.6(7.9) 179 31.7(8.2)
labels purchased 40.4 fewer calories (P= 0.002), and par-ticipants exposed to calorie-only labels purchased 38.2 fewer calories (P= 0.0002). The small difference of 2 fewer calories purchased among participants exposed to PACE labeling vs calorie-only labeling was not signifi-cant (P= 0.90). Models adjusting for age, sex, race, occu-pational role, numeracy level, and health literacy level or those models that had the participants assigned based on > 50% of their lunch photos during the intervention year did not change estimates appreciably.
Discussion
Previous research demonstrates that calorie information is unlikely by itself to motivate people to change their eating behaviors. Calorie information alone lacks con-text. That is, without additional information, people may not appreciate how calories, particularly of a single meal, fit into their overall daily intake and energy balance. It has been proposed that framing caloric information by
indicating the amount of physical activity required to burn the calories may increase its influence on con-sumer behavior [9, 10]. The PACE Study was designed in part to examine whether a labeling strategy that con-veys calorie information in such a format would lead to a change in calories purchased.
Few other studies have examined the effect of physical activity energy equivalent food labeling formats [7, 11]. This current study’s testing of PACE labeling was in-formed initially by qualitative work [12]. Then we con-ducted a hypothetical scenario study in which just over 800 respondents were randomized to be shown one of four menu label types: calories only, calories plus aver-age minutes of walking, calories plus averaver-age miles of walking to burn the calories in the food item, or no add-itional information [8]. In a computer-based format, re-spondents shown the calories plus miles ordered an average of 194 fewer calories compared to no label and 101 fewer compared to those shown the calories-only label. It is interesting to note that in one US study, ap-proximately 26% of participants reported they would like to see physical activity equivalents provided with calorie information [13].
In this current “real-world” study, however, cafeteria patrons exposed to PACE labels during their workday lunch did not purchase any fewer calories than those ex-posed to calorie-only labels.
One might question if employees of a health insurance company might have already been more fit or consumed a healthier diet than the general population, and thus it would be difficult to affect change through labeling. However, baseline data regarding BMI of the study sam-ple suggests otherwise.
Prior to initiating the study, some of the cafeterias used limited calorie labeling on some of the foods, but the labels were quite small and seemingly largely ig-nored. In order to standardize the labels across study sites, we improved the size and prominence of the cal-orie only labels as well as testing the PACE labels which were similarly visible. It is possible that by enhancing the calorie-only labels, we increased their effectiveness [14]. It is possible that participants exposed to PACE labeling Table 1Characteristics of cohort participants(Continued)
Entire Cohort PACE Labels Calorie Only Labels
N % or Mean(SD) N % or Mean(SD) N % or Mean(SD)
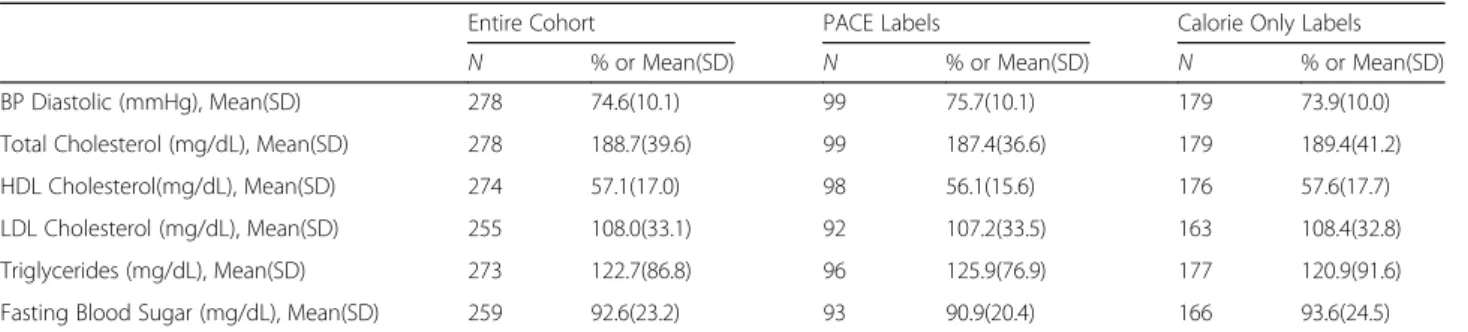
BP Diastolic (mmHg), Mean(SD) 278 74.6(10.1) 99 75.7(10.1) 179 73.9(10.0)
Total Cholesterol (mg/dL), Mean(SD) 278 188.7(39.6) 99 187.4(36.6) 179 189.4(41.2)
HDL Cholesterol(mg/dL), Mean(SD) 274 57.1(17.0) 98 56.1(15.6) 176 57.6(17.7)
LDL Cholesterol (mg/dL), Mean(SD) 255 108.0(33.1) 92 107.2(33.5) 163 108.4(32.8)
Triglycerides (mg/dL), Mean(SD) 273 122.7(86.8) 96 125.9(76.9) 177 120.9(91.6)
Fasting Blood Sugar (mg/dL), Mean(SD) 259 92.6(23.2) 93 90.9(20.4) 166 93.6(24.5)
a
2 or 3 correct out of 3 items
Table 2Estimates of Mean Meal Calories Purchased at Each Data Collection Time Point from Generalized Linear Mixed Models for Intervention (PACE Label) and Control (Calorie Only) groups
Time Point Unadjusted Model Estimates Adjusted Model Estimatesa
PACE Labels (n= 146)
Calorie Only (n= 225)
PACE Labels (n= 146)
Calorie Only (n= 225)
1 628 581 622 583
2 611 581 605 585
3 622 604 617 607
4 579 577 574 580
Baseline 610 586 605 589
5 603 556 598 560
6 562 525 560 526
7 561 572 553 578
8 552 537 548 537
Intervention 570 546 565 550
Mean Change 40 38 40 39
Difference 2 1
a
altered their behaviors in other ways that may have con-tributed to better health other than purchasing fewer lunch calories. They may have selected foods of im-proved nutritional value even if the calorie levels remained the same. In addition, it is possible that actual consumption was reduced in the PACE group, but we did not measure foods purchased but not eaten. Partici-pants may have engaged in a greater amount of physical activity (which we will examine in a subsequent ana-lysis). It is also possible that participants made alterna-tive meal choices for subsequent meals (i.e., ate fewer calories for dinner at home), that we would not have captured. We do note that participants in both groups purchased fewer calories once labels were in place. How-ever, we did not include a no-label group, so it is not clear whether this decline represents a labeling effect in general or a secular trend towards caloric reduction.
Strengths of our study include its cohort design, use of meal photographs, and a detailed food atlas to assess cal-orie information. As a cafeteria study, however, its find-ings may not generalize to other settfind-ings such as fast food restaurants. Another potential limitation is that we measured food purchased. It is possible that people ate less of their meals in one condition or another, but we did not measure actual food consumption.
Conclusions
Overall, it appears that in the workplace cafeteria setting during lunchtime, PACE labeling is no more effective than calorie-only labeling in reducing calories of meals purchased. Additional analyses will examine effects of PACE labeling on physical activity. Future studies in al-ternative settings, especially fast food restaurants, also should be considered.
Abbreviations
BCBSNC:Blue Cross Blue Shield of North Carolina; CHOW: Capturing healthy options at work; GLMM: Generalized linear mixed model; PACE: Physical activity calorie expenditure
Acknowledgements
The authors wish to thank Christie Colgan, Megan McCurdy, the cafeteria managers and chefs, and Blue Cross Blue Shield of North Carolina, whose partnership make this study possible.
Funding
The PACE Study was funded by R01 CA184473-01A1 from the National Cancer Institute, National Institutes of Health. The funding body played no role in study design, data collection, analysis, interpretation of data, or writing the manuscript.
Availability of data and materials
The datasets generated and analyzed during the current study are available from the corresponding author on reasonable request.
Authors’contributions
AJV conceived of the study with assistance from ZG, LT, DH, LL, and AA. ZG and AJV conducted analyses. AJV drafted the manuscript. LT drafted the IRB, oversaw and performed study procedures, and provided critical review and revision of manuscript. EO and JG performed study procedures, entered data,
developed spreadsheets and figures, provided critical review of manuscript. DH provided critical review of manuscript. ZG performed data analyses and provided critical review of manuscript. LL, AA, FL and SMN provided critical review of manuscript. All authors read and approved the final manuscript.
Ethics approval and consent to participate
The study was approved by the Institutional Review Board of the Office of Human Research Ethics at the University of North Carolina at Chapel Hill. Written informed consent for participation was obtained from participants.
Consent for publication Not applicable
Competing interests
The authors declare that they have no competing interests.
Publisher’s Note
Springer Nature remains neutral with regard to jurisdictional claims in published maps and institutional affiliations.
Author details
1Department of Community and Family Medicine, Duke University School of
Medicine, 2200 West Main Street, Suite 400, Durham, NC 27705, USA.2Center for Health Promotion and Disease Prevention, University of North Carolina at Chapel Hill, Chapel Hill, USA.3NC Translational and Clinical Sciences Institute, University of North Carolina at Chapel Hill, Chapel Hill, USA.4Sheps Center
for Health Services Research, University of North Carolina at Chapel Hill, Chapel Hill, USA.5Department of Health Behavior, University of North
Carolina at Chapel Hill Gillings School of Global Public Health, Chapel Hill, USA.6Department of Biostatistics, University of North Carolina at Chapel Hill
Gillings School of Global Public Health, Chapel Hill, USA.7School of Media & Journalism, University of North Carolina at Chapel Hill, Chapel Hill, USA.
8
Department of Nutrition, University of North Carolina at Chapel Hill, Chapel Hill, USA.
Received: 15 May 2018 Accepted: 14 January 2019
References
1. Mokdad AH, Marks JS, Stroup DF, Gerberding JL. Actual causes of death in the United States, 2000. JAMA. 2004;291(10):1238–45.
2. Flegal KM, Kit BK, Orpana H, Graubard BI. Association of all-cause mortality with overweight and obesity using standard body mass index categories: a systematic review and meta-analysis. JAMA. 2013;309:71–82.
3. Riyam J. Nutrition labeling in the food-away-from-home sector. An economic assessment. Economic Research, Report No. ERR-4. United States Department of Agriculture; 2005.
4. Guthrie JF, Lin BH, Frazao E. Role of food prepared away from home in the American diet, 1977-78 versus 1994-96. Changes and consequences. J Nutr Educ Behav. 2002;34:140–50.
5. Bowman SA, Vinyard BT. Fast food consumption of US adults. Impact on energy and nutrient intakes and overweight status. J Am Coll Nutr. 2004;23: 163–8.
6. Long MW, Tobias DK, Cradock AL, Batchelder H, Gortmaker SL. Systematic review and meta-analysis of the impact of restaurant menu calorie labeling. Am J Public Health. 2015;105(5):e11–24.
7. Bleich SN, Economos CD, Spiker ML, Vercammen KA, VanEpps EM, Block JP, Elbel B, Story M, Roberto CA. A systematic review of calorie labeling and modified calorie labeling interventions: impact on consumer and restaurant behavior. Obesity (Silver Spring). 2017;25(12):2018–44.
8. Dowray S, Swartz JJ, Braxton D, Viera AJ. Potential effect of physical activity based menu labels on the calorie content of selected fast food meals. Appetite. 2013;62:173–81.
9. Viera AJ, Tuttle L, Olsson E, Gras-Najjar J, Gizlice Z, Hales D, Linnan L, Lin FC, Noar SM, Ammerman A. Effects of physical activity calorie expenditure (PACE) labeling: study design and baseline sample characteristics. BMC Public Health. 2017;17(1):702.
11. Bleich SN, Herring BJ, Flagg DD, Gary-Webb TL. Reduction in purchases of sugar-sweetened beverages among low-income black adolescents after exposure to caloric information. Am J Pub Health. 2012;102:329–35. 12. Swartz JJ, Dowray S, Braxton D, Mihas P, Viera AJ. Simplifying healthful
choices: a qualitative study of a physical activity based nutrition label format. Nutr J. 2013;12(1):72.
13. Bleich SN, Pollack KM. The publics’understanding of daily caloric recommendations and their perceptions of calorie posting in chain restaurants. BMC Public Health. 2010;10:121.