Interventions to Prevent and Treat Childhood
Obesity:
A Systematic Review
By
Tamaurus
J.
Sutton
A Master's Paper submitted to the faculty of
The University of North Carolina at Chapel Hill
In partial fulfillment of the requirements for
The degree of Master of Public Health in
The Public Health Leadership Program.
Chapel Hill
Introduction
Overweight and obesity are chronic conditions, and over the last decade
many groups of people have been affected by these problems. Both developed
countries, including the United States, Canada, and Europe, and underdeveloped
areas, including parts of Latin America, Africa, and Asia have seen drastic and
continual increases in obesity and overweight, and in many places they now have
reached epidemic proportions (1). This epidemic has affects all ages, almost all
ethnic groups, and people of every socioeconomic status, though often in
disproportionate ways (2).
This paper reviews the prevalence of overweight and obesity in the U.S.,
discusses adverse health and psychosocial outcomes, and reviews the
effectiveness of various interventions in preventing and treating childhood
overweight and/or obesity. A previous systematic review conducted on this topic
by Summerbell et al in 2003 (3) concluded that there is limited data on the
effectiveness of obesity prevention and treatment programs and no generalizable
conclusions can be drawn from the studies to date.
Thus, a new review examining this topic is needed for several reasons.
One, the Summerbell et al. review was last updated in January of 2002. Also, the
Summerbell et al review included all children from age 0 to 18 years, which is a
very wide age range. In this review, I have narrowed the age range to 6 to 12
years to include only elementary
j
t-school aged children because I feel that children are easier to reach at this age for
the following reasons: 1) they all are required by law to go to school, and 2)
younger children are often more accepting of change than teenagers. However,
the most important reason for doing another systematic review is that childhood
overweight/obesity is huge problem and we need to find an answer to this
question.
Childhood Overweight/Obesity
Defining Obesity/Overweight
In children, overweight and obesity are determined by using BMI growth
charts. Overweight is defined as BMI greater than the 85th percentile of normal
BMI, and obesity is defined as a BMI greater than the 95th percentile of normal
BMI (Appendix 1) (4).
The BMI growth charts consist of a series of percentile curves that
illustrate the distribution of selected body measurements in U.S. children.
Percentiles are the most commonly used indicator to asses size and growth
~
}--patterns of individual children. Percentiles rank the position of an individual by
indicating what percent of the reference population the individual would equal or
exceed. The charts were first developed in 1977 by the National Center for
Health Statistics as a clinical tool for health care providers to determine if the
growth of a child is adequate. The 2000 CDC growth charts represent the revised
version of the 1977 NCHS growth charts. The data used to construct these charts
comes from the National Health and Nutrition Examination Survey (NHANES),
American population since the early 1960's (5). Because this data was collected
mainly from those persons seeking routine health care, it may not be
representative of those groups not seeking routine health care.
Prevalence of Overweight/Obesity
The percent of overweight or obese children in the US has nearly tripled
over the last two decades, with absolute numbers currently well over 9 million
(6). The increases in prevalence of overweight and obesity are constant across
racial and ethnic groups, and both genders. Today, approximately 15% of children
in the US are overweight or obese (Table 1) (7) according to numbers from the
latest NHANES data.
·:rabie'i; ·o:;e~eigbt -chiidren and·a·ttOkSceuts ~19 years or'a·ge, aromting to sex. age. a·~d'iiispanic origiilinuniiect States. seifi:-tetfYearS
I96j.6S·u.·rou·gh-I.
1999-2000
Age, se~t, race, and Hispanic origin
I
i963-65 1966-70 1971-74I
1976-80r
1988-94I
1999-2000I'
6-11 years of uge I Perc~t;i of Population (St~ard ~rro~) I.Both-~~d~-- I 4.2 I 4.0 I 6.5 l 11.3 (1.0) I 1s.J o:7) I
!loY' i 4.0 I 4.3 I 6.6 I 11.6(1.3) l 16.0 (2.3) I
\.Vrnte I 44 I 4.1 I 6.7 I 11.3(1.7) I I
'""'
I L6 I 5.3 I 6.7 I Ji.'3 {1.4) I IWhite, n;n~Hi;punic I I I 6.1 I Jb?J (z:O} I i2.0'(3.0) I
BlOCk, ixui~HisP:mic I I I 6.8 I 12.3 (1.4) I n: ,-(2.7)" I
Mexican I .. I I 13.3 I ··11:s ciAJ .T -iiJ·d:n I
Gkls I 4.5 I 3.6 I 6.4 I 1\.0(1.4) T 14.5(2.4) I
White I '4.5 I 3.7 I 5.7 J 9.8(!.'7)'' I j
Block I 4.5 I 3.3 I 11.1 I 16.7 (1.5) I I"
White, ooU-Hi~Pani~-- I I I 5.2 I 9.8(2.0) I I
at:ick-r10n-Hisj,'~c I I I 11.2 I I7.od.6} T 2i:f('3.3) I
Md~icmi I. I I 9.8 I 15.3 (2.5) I 19.6 (3. \) I
12-19-ye~~f~g~ I j
fk>thS~~es T 4.6 I 6.1 I 5.0 I w3 c0.9>
is:s
(u> IBoys I 4.5 I 6.1 I 4.8 _I li:3ct.3-> 15:5'(£.6) I
White I 4.7 I 6.3 I 4.7 I 12.1 (\.7) I
..
BJa'ck _I .. 3.1 I j'j I 6:"i' I . w.4~ci.4) I I
white~ ·;;;:;~-Hisranic I I I 38 I '1'(6'(1:9) I 12:8 (2:4)' I Block, non-Hispani~ I I I 6.1 l 10.7 (1.4) I 20.7 (2.6) I Mellican I I I 7.7 I 14.1 (1.8) I 27.5 (3.0) I Girls I 4.7 I 6.2 I 5.3 I. 9.7 (1.1) I 'i"S."s'(\.66 I White j 4.5 I 5.4 I• 4.5 J 9.'o.(t~i) I J
'""'
I M I 10.1 I \0.7 I 16.3 (2.0) I IConsequences of Overweight/Obesity
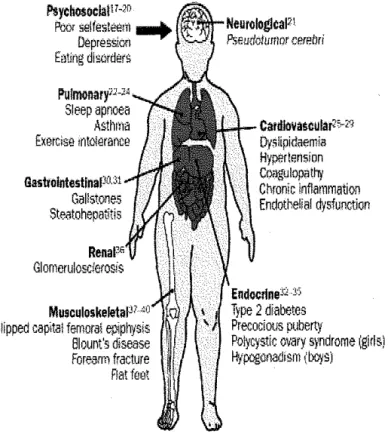
Adverse Health Outcomes
Some of the conditions, once only thought to occur in adulthood, are now
starting to appear in America's children (Figure 1). Type 2 diabetes, once
practically unrecognized in adolescence, has seen a 10-fold increase in incidence
since 1982 (2,4). The emergence of type 2 diabetes in children represents an
ominous development given the disease's macro-vascular (heart attack, stroke,
amputation) and micro-vascular (kidney failure, blindness) complications (2).
Moreover, research done by the American Academy of Pediatrics
indicates that nearly 1 million American children suffer from a condition called
metabolic syndrome, which includes excessive abdominal fat, high blood
pressure, high trigylceride levels, low HDL levels, and high blood sugar (4).
These are all proven risk factors for heart disease in adults. According to former
Surgeon General Dr. David Satcher, Americans will risk nullifying some of the
gains made in the treatment of heart disease, cancer, hypertension, and other
chronic health problems if we fail to confront the health problems caused by
obesity (1).
Adverse Psychosocial Outcomes
Among children, obesity is one of the most stigmatizing and least
acceptable conditions. Obese children are stereotyped as unhealthy, academically
unsuccessful, socially inept, unhygienic, and lazy (2). In a decent study by
Schwimmer, Burwinkle, and Varni (4), obese children were found to be 5.9 times
I
l ;
"---more likely to self-report impairment in psychosocial health than normal weight
children. The most immediate consequence of overweight and obesity, as
perceived by children themselves, is social discrimination. This discrimination
often leads to low self-esteem and depression (Figure 1)(4).
Figure 1: Consequences of Childhood Obesity, Taken from ref 8
Psychosocla!H·1°
POOl selfest.o-em
-+
DepresSionEating dlsc,ders
Sleep apnoea Asthma Exercise rnt~erance
Gallstooes Steatohepatitis
Slipped capital femoral epiphysis Blount"s disease Forearm fracture Rat feet
CardlovaMular10-N Oyslipi~mia
Hyperle.nsion Coagulopalhj Chronic Inflammation Endothelial dysfunction
Endocrinetl Yi
Type 2 diabetes Precocious puberty
Polycystic 01~ry syndrome (girls! flypogonadrsm (boys)
Relationship Between Childhood and Adult Obesity
Tracking
Obesity in childhood is a significant predictor of obesity in adulthood and
adolescent obesity is a better predictor than obesity at earlier ages (9).
Overweight adolescents have a 70% chance of becoming overweight or obese
or obese (10-12). Several studies have validated these findings. A good study
conducted by Whitaker et al showed that the odds ratio for obesity in adulthood
associated with childhood obesity
~
Onos &\nos !OR OBm n< YoUNG ADuLTHooDranged from 1.3 for obesity at ages ~JNG m SuBJEcm' OBES!I'I S'rArus JN CHilDHooD
AND TllEIR PAlilliiS' OBES!I'I S'rA"IUS, !ROM MUL1lVAR!A1!
1 to 2 to 17.5 for obesity at age 15 Lommc-REG=oN Monru.'
to 17. All of these numbers
increased for children with one or
more obese parents (Table 2)(13).
Moreover, the human gene
map has identified over 300 genes,
markers, and chromosomal regions
that are associated with human
obesity (14). What complicates this
AGE(ml 1-J 3-5 6-9 10-14 15-17 Sl8.ECT OBESE }.SA.CIILD YESVS.lfO
No. oF OsEsE PJJlENrs
lvs.O lvs.O
odd~ ratio (95% confidence interval)
1.3 (0.6-3.0) 4.7(25-3.3) 3.3(47-16.5) 22.3 (10.5-47.1) 17.5(77-39.5)
31(12-5.7) 13.6 (3.7-50.4) 3.0(17-5.3) 15.3 (5.7-41.3) 2.6(1.4-4.6) 5.0 (2.1-ll.l) 22(!1-3.3) J.O (0.3-5.2) Jl(ll-4.3) 5.6 (25-12.4) *Young -adulthood was defined as 21 to 29 yem of ~e. The v31'iables induded in the model wm childhood obecity tatus (obese or not obese) md the number of obe!>e puents (0, 1, or 2). See the Methods seaion for
m explm<tion of adjusnnents for iblings.
issue even more is the fact that the genes relevant for weight regulation are not the
same throughout life (15). According to a large longitudinal twin study, only 40%
of the genetic factors that influence BMl at age 20 continue to do so at age 48
(16). Despite these recent advances in genetics, these genes have only been
proven to be responsible for only a small proportion of human cases of obesity
(17).
Individuals become obese as a result of a unique mixture of inherited
genes that confers susceptibility and years of complex interaction with an
environment that is increasingly more "obesigenic." In other words, certain
environmental factors are needed in order for genes conferring for obesity to be
I
I
i---expressed. In conclusion, since manipulating the environment is currently easier
than altering genetic make-up, we will not discuss genetics any further for the
time being.
Consequences of Overweight/Obesity in Adults
Obesity and overweight are chronic conditions that bring serious risk.
Health risks are better established for obese persons than for overweight persons;
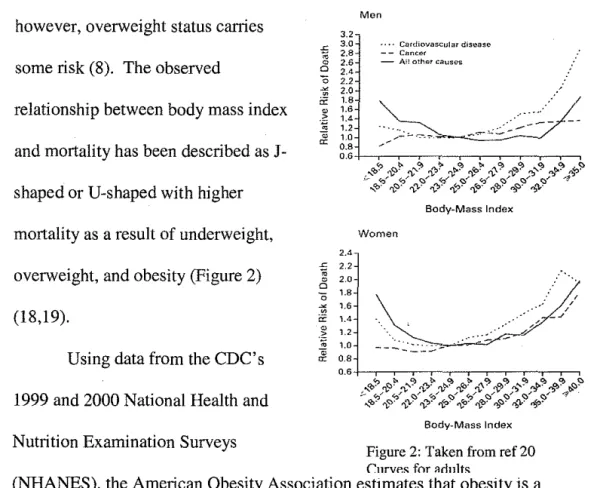
however, overweight status carries
~
;;
some risk (8). The observed 0
Cl 0
~
.
relationship between body mass index
"'
0>
-~
•
and mortality has been described as J- ~
shaped or U-shaped with higher
mortality as a result of underweight,
~
overweight, and obesity (Figure 2) ;; >
Cl
0
~
(18,19). •
"'
0.~
"
Using data from the CDC's-.
~1999 and 2000 National Health and
Nutrition Examination Surveys
3.2 3.0 2.8 2.6 2.4 2.2 2.0 1.8 1.6 1.4 1.2 1.0 0.8 0.6 2.4 2.2 2.0 1.8 1.6 1.4 1.2 1.0 0.8 0.6 Men Cardiovascular diseast> - - Canc<>r
- Ai! o!har causes
e--''0: .. "'(.):/'),': ... "'"J~.-.,t-:
...
"-~:...
.v:_..'),~:...
~':...
oJ-~~~"~ ~- ~- v· v·~-Bodv-Mass Index
Women
.-· _,/
····--·---
---~,<t>:
...
"-~~"'":...
'),<;:.-'\S'~'),~~-t':.-'),~:...
<;':.-4-~'}~:~f;)~~-~-v-v-~-~-~-~-¥·#·
Body-Mass Index
Figure 2: Taken from ref 20
rnrVf~S for ~rlnlts
(NHANES), the American Obesity Association estimates that obesity is a
contributing factor in 300,000 to 400,000 deaths per year and obesity-related
problems account for around 62 million doctors' visits per year (Table 3) (1).
Given the similarity of these numbers to the numbers obtained in six major
population-based studies using hazard ratios to compute annual deaths, the
County Health Study, the estimated number of overweight-attributable deaths in
2000 was 567,683; Framingham Heart Study, 543,981; Tecumesh Community
Health Study, 462,005; American Cancer Society Cancer Prevention Study,
451,708; Nurses Health Study, 504,602; and the National Health and Nutrition
Examination Survey I Epidemiologic Follow-up Study, 439,548 (21,22).
Table 3 • Actual Causes of Death in the United States in 1990 and 2000
Actual Cause No. (%) in 1990* No. (%) in 2000
Tobacco 400000 (19) 435000 (18.1)
Poor diet and physical inactivity 3000CO (14) 400 000 (16.6)
100000 (5] 85000 (3.5)
Ml'crobial 90000 75000
Toxic agents 60000 (3) 55000 (2.3)
Motor vshicle 25000 (1) 43000 (1.8)
Firearms 350CO (2) 29000 (1.2)
Sexual behavior 30000 (1) 20000 (0.8)
Illicit drug use 20000 (<1) 17000 (0.7)
Total 1 060 000 (50) 1159 000 (48.2)
Obesity is associated with heart disease, diabetes, cancer, breathing
problems, arthritis, reproductive complications, and many other health
complications (18). Over 80% of people with diabetes are obese. There is an
approximately 10% increase in the risk for developing arthritis for every 2-pound
increase in weight over normal body weight. Obesity during pregnancy is
associated with high rates of Cesarean section delivery, increased risk of
gestational diabetes, and increased risk of birth defects, namely neural tube
defects (10-12).
The most recent estimated health care cost of obesity in the US is in
excess of $115 billion dollars per year (10-12). In addition, it is estimated that
weight loss programs (1). Obesity also has several non-monetary costs. Perhaps
one of the largest of these costs is missed workdays. According to Spence-Jones,
the National Task Force for the Prevention and Treatment of Obesity noted that
there are 39.3 million missed workdays related to obesity each year (1).
Purpose of the Systematic Review
This review examines the effectiveness of the various interventions and
treatments that have been tried to determine if any are effective in reducing and/or
treating childhood overweight/obesity. I conducted a systematic review that
included all studies in which the main focus was on the effectiveness of
interventions in reducing and/or treating childhood obesity.
I chose to target children for several reasons. First, childhood obesity is
potentially preventable. Second, persons at high risk for obesity can be identified
at a young age (18). Third, childhood obesity has been linked to adult obesity
(13). Fourth, several studies have shown that once they become obese, adults
rarely sustain weight loss (13). Fifth, adult obesity is linked to increased
morbidity and mortality (20). Thus, prevention of obesity in childhood and
effective treatment of overweight children should be a priority.
Methods
Literature Search
Relevant articles from January 1985 to the present were identified using
MEDLINE, the Cochrane Collaboration, and the systematic review and
Services. In addition, an expert in the field of childhood obesity was consulted
and her recommendations for retrieving relevant articles were taken into account.
Search terms used included interventions, prevent, prevention, childhood, child,
obesity, overweight, and human. Only articles classified as randomized controlled
trials conducted with human subjects that included children ages 6 to 12 were
retrieved. Again, this age group was targeted because I feel that children are
easier to reach at this age. They all are required by law to go to school, and
younger children are often more accepting of change than teenagers. All
literature searches were done in collaboration with a research librarian to ensure
that a complete systematic search had been conducted. The initial search yielded
260 articles (Appendix 2).
i
Inclusion Criteria
All potentially relevant articles identified by the search were reviewed for
inclusion in the analysis. To be included, studies had to have 1) been conducted
using children ages 6 to 12; 2) provided information concerning participant
oriented outcomes (weight/BMI change); 3) been randomized controlled clinical
trials; 4) lasted at least six months; 5) contained an appropriate control group; 6)
included both pre-intervention and post-intervention results for both the treatment
and control groups; 7) been available in the English language. Because there are
no FDA approved drugs for the treatment of childhood overweight/obesity,
A summary of the articles, with study design, subjects, intervention
evaluated, outcomes measured, and study quality, is presented in the evidence
tables. Any article that failed to meet the stated inclusion criteria was eliminated.
Article Review
Studies that met the inclusion criteria were reviewed using the revised
CONSORT statement presented in an article by Moher et al (23) in JAMA in
2001. This revised statement incorporates new evidence and gives a checklist of
items pertaining to the content of the title/ abstract, introduction, methods, results,
discussion/comment (Appendix 3) (23). Each article was assigned a grade of
"pass" or "fail" for each of the five sections appraised. A second reader would
have been used but was not due to time and financial constraints. Articles were
rated as "good" if they received a grade of pass for all five sections, "fair" if they
received a grade of pass for at least four of five sections, and "poor" if they
received a grade of pass for three or less of the sections. Moreover, the quality of
the studies was evaluated using the following quality assessors: 1) drop-out rate of
no more than 25%, 2) minimal crossover during the study, 3) quality of
randomization, and 4) use effective measurement tools and procedures.
Results
Of 260 articles identified in the initial search, five met the inclusion
criteria and were internally valid. Of these five studies, two found significant
reductions in BMI/weight between intervention and control groups (Robinson TN,
Gortmaker SL et al)(24, 25), and three did not (Warren JM eta!, Cabellero JM et
A summary of the included studies can be found below and in Table 4. A
summary of other studies evaluated can be found in the table in appendix 4.
Warren JM et al (26)
This study described a school and family-based intervention to prevent
obesity in children ages 5 to 7 years. There were 218 subjects recruited from
three primary schools in Oxford, England. The subjects were randomly assigned
to a control group or one of three interventions groups: nutrition group, physical
activity group, and combined group. The interventions took place during
lunchtime clubs and were composed of an interactive, age-appropriate nutrition
and/or physical activity curriculum. The interventions lasted for 14 months. The
study did not find any significant changes in the rates of overweight/obesity;
I
jhowever, significant changes were found for improvements in nutrition in
knowledge (P<0.01) between baseline and post-intervention for all children, and
the results were highly significant for the nutrition and combined group
(P<O.OOl). Overall, fruit and vegetable intake increased significantly (P<0.01 and
<0.05, respectively), with significant changes seen for the nutrition (P<O.OS) and
control groups (P<O.OS). Also of note, the study indicated that schools are a
suitable setting for this type of intervention.
Of the 218 participants who originally started the study, a total of 46 were
loss to follow-up (22% ). Also, there was no crossover during the study and all
measurements tools and procedures used were discussed and appeared adequate.
On the other hand, the method of randomization was not discussed therefore no
Cabellero Bet al (27)
This study described a school-based multi-component intervention for
reducing percentage body fat in American Indian schoolchildren. It was a
randomized control trial involving 1704 children in 41 schools and was conducted
over 3 years, from 3'ct to 5'h grades, in schools serving American Indian
communities in Arizona, New Mexico, and South Dakota. The intervention had
four components: 1) change in dietary intake, 2) increase in physical activity, 3) a
core classroom curriculum focused on healthy eating and lifestyle, and 4) a
family-involvement program. The main outcome was percentage body fat. The
intervention resulted in no significant reduction in percentage body fat between
intervention and control schools. On the other hand, the results do document the
I
feasibility of implementing a multi-component program for obesity prevention in
elementary schools serving American Indian communities.
Ofthe 1704 children (879 intervention, 825 control), a total of 295 (152
'
intervention, 143 control) were lost to follow-up for an overall dropout of 17%
L
(17% intervention, 17% control). There was no reported crossover during the
study and all measurements tools and procedures used were discussed and
appeared adequate. The method of randomization discussed elsewhere and also
appeared adequate.
Sahota Petal (28)
This study evaluated a school-based intervention that targeted reducing
risk factors for obesity. Ten primary schools in Leeds were recruited and paired
numbers of free school meals). The schools were randomized to received the
intervention or serve as control schools. A total of 634 children age 7 to 11
participated in the study. The intervention schools received the active program
promoting lifestyle education in schools (APPLES). The program consisted of
teacher training, modifications of school meals, and development and
implementation of school action plans designed to promote healthy eating and
physical activity over one academic year. The control schools continued with
their usual health curriculum. The study found no significant differences in BMI
between schools. However, the study did find a significantly higher vegetable
consumption by 24-hour recall in the intervention schools when compared to the
control schools. The also found that fruit consumption was lower in obese
children in the intervention schools than those in the control schools. Moreover,
they found that sedentary behavior was higher in overweight children in the
intervention schools and global self worth was higher in obese children in the
intervention schools.
All 10 schools completed the project. Over the year, a total of 42
participants left the study and 40 joined. In all, 613 of 636 (97%) children were
measured at baseline and 595 of 636 (94%) at the end of the intervention. Also,
there was no crossover reported during the study and all measurements tools and
procedures used were discussed and appeared adequate. The method of
randomization was also discussed and was adequate.
This was a school-based intervention that targeted reducing sedentary
behavior through reducing television, videotape, and video game use. Two public
elementary schools in a single school district in San Jose, California were eligible
to participate. The schools were sociodemographically and scholastically
matched by district personnel. School principals agreed to participate prior to
randomization. One school was randomly assigned to receive the intervention
and the other school was assigned to be an assessment s only control. The
intervention curriculum consisted of 18 hours a classroom time and newsletters
designed to motive children and parents to limit television, videotape, and video
game use. Electronic television time mangers were sent to each household with
additional units available for every television in the home at no cost. One
hundred ninety two students with a mean age of 8.9 years participated in the
study. The groups were followed for six months. Compared with controls,
children in the intervention group had statistically significant relative decreases in
body mass index (intervention vs. control change: 18.38 to 18.67 kg/m2 vs. 18.10
to 18.81 kg/m2, respectively; adjusted difference -0.45 kg/m2 (95% CI, -0.73
to-0.17); P=0.002). Triceps skin fold thickness, waist circumference, and
waist-to-hip ratio also all decreased significantly (P=0.002, P<0.001, P<O.OOl
respectively). Relative to controls, intervention group changes were accompanied
by statistically significant decreases in reported television viewing and meals
eaten in front of the television. Overall, the study found that reducing television,
videotape, and video game use might be a promising intervention for preventing
Of 95 children in the intervention group, only 3 (3.2%) were lost to
follow-up. Of 103 children in the control group, only 3 (2.9%) were lost to
follow-up. There was no reported crossover during the study and all
measurements tools and procedures used were discussed and appeared adequate.
The method of randomization was discussed and also appeared adequate.
Gortmaker SL et al (25)
This study evaluated a school-based health behavior intervention known
as Planet Health on obesity among boys and girls in grades 6 to 8. Planet Health
was designed to reduce obesity by increasing energy expenditure while promoting
key dietary behaviors consistent with dietary guidelines. The intervention focuses
on 4 behavioral changes: reducing television viewing to less than 2 hours per day,
i
increasing moderate and vigorous physical activity, decreasing consumption of
high fat foods, and increasing consumption of fruits and vegetables to 5 a day or
more. The intervention was implemented as 16 core classroom lessons each year.
Classroom lessons were designed to last approximately 45 minutes.
~-Ten schools were randomized to receive or not receive the Planet Health
intervention. A total of 641 students were included at the intervention schools
and 654 were included in the control schools. The study found that the
prevalence of obesity among girls in the intervention schools was reduced
compared with girls at the control schools (OR 0.47, 95%CI 0.24-0.93, P=0.03)
with no differences found among boys. The intervention also reduced television
hours among both girls and boys, and increased fruit and vegetable consumption
outcomes were assessed using a Food and Activity Survey completed
independently by each student in a classroom under the supervision of teachers
who were trained to administer the survey. Lastly, this study indicated that a
school-based approach is feasible in preventing childhood obesity.
For girls, follow-up data were obtained for 82% of control and 81% of
intervention students. For boys, follow-up data were obtained for 86% of control
and 83% of intervention students. The main reasons reported for loss to
follow-up were school transfer (52%), school absence (27%), and child refusal (10%).
No information concerning crossover was reported. However, all measurement
tools and procedures used were discussed and appeared adequate. The method of
randomization was discussed and also appeared adequate.
,_ ... , __ "_ ... , .. ,L~I!U~JJIIillllllllt ... " - _____ , ___ J," .. L .. ··· I '"''I-··
::[~!/~/~1!,.!:/~~Y!!!~,~~~~"T~-~!,~s
1 Study, Year U Study
i
Groups Sample Race Sex Age Baseline Study Follow- P Value Patieu Study •~ (Reference) & Design
!
Size M/F BMI Duration upBMI ts Lost Grade'
to*
or5 ~ Change Follow
{:
inBMI -up
f
[-0 CC"':/!0'//'//•//;//.·'hC"/'/F'-/',;,>//)
I~-Warren, JM eta!., RCT ~trmo~A _ . 89%W
i7
1
ii
6 ~(~~) 16.1(2.7) 14mos~~~
NR 14 Fair2003 (26) ySICa Ct!VIty 6.1(0.6) 16.0(2.0) NR 8
School~ Based Combined 54 200 6.1(0.7) 15.8(2.0) NRINS NR 12
Target: C Control 54 29•25 6.1(0.6) 15.5(1.6) NRINS NR 12 Intervention: D, Total 218 I !1•107 6.1(0.6) 15.9(2.1) NRINS NR 46 PA
Conclusion: There were no significant differences in BMI between groups at baseline and overall. Small changes in incidence of overweight and obesity were noted in some groups but subject numbers were ... t~-~,t;JJ~}t!?r--~-~--~,~~-~t~;~J--.~~;!~~~~:, !i.?,~_;y~,~-'~}»~ .,P.~~~-~-ti,~_1,.~!-~.72.~!-!~--~""~~~,~~~~,--~~t!i.~p_l~!,!~S._B!-~~~5~~e .?-f -~-~~,~~~X}.~!~~~-Y}~~}~--~~}, ~~~~~,-~~~,.~"~~~~~9:!~-~~; ._, ''"'--'~ :---.-. /"'/ '/4 ·"' -y., /•:.r_,,,n·-•"" ,, .. ""'/'F•P.·JC-/C• i'i''·'
Cabellero, B et al, RCT PATHWAYS 879 All NR 7.6(0.6) 32.8% 3 years 40.3% 0.2 (-0.84 to !52 Good
2003 (27) (Intervention) Americ 1.31)
School-Based an P=0.664
Target: C Control 825 Indian 33.3% 40.0% between 143
Intervention: D, groups
PA %Body fat
Conclusion: The PATHWAYS intervention did not result in a significant reduction in percentage body fat between the two groups. However, the study does indicate that it is feasible to implement a multi-component program for obesity prevention in elementary schools serving American Indian children, which could extend to other ethnic groups.
' c. ···.· 42left ....
" ' ;-; ·,-. ;'-'"'"'./·0:·' .··,- ;, - '::::-:.::::;;:.:· .,, .. •,;·;-. .--"'.//."''!//,/-",i//•W'/;C·'·' i'//· . .'"',;/-:::. ··- "; .·• <-"·::·::.· · ,,.,, · '" ;.•;--:,"•/:"'·""/!''-'/-' ,,. ·.:-·;-.-·••"':<'/"''·'_,;· ;".;.·;-·;;,"/ • ;·.::",C'/•"/; ;·:·;·•; "•
NR Good
Sahota,Petal, RCT APPLES(Active 314 NR 153M 8.36(0.64) 0.12(1.01) 12mos 0(-0.Ito
2001 (28) Program Promoting !61F 0.1) 40 joined
School-Based Lifestyle in Schools) No
Target: C significant Numbers
Intervention: D, difference for entire
PA Control 322 189M 8.42(0.63) 0.04 (Ll7) 12mos between study
133F BM1SD
BMI SD score score between
. schools
Conclusion: Overall, there was no difference in BMI SD score between the intervention and control schools at the end of the year although it was successful at changing the ethos of the schools and the attitude of the children.
;--.; . .,_;.;·;.-;;,--.-,-,-.... , : - ' ' : / ' / ' " - . - " ;,o-.--.:./<;/(/-!·,/"
95
'C"•, ;;,o;q; P//'-'" ,-;-• · : · ; " --·-.;;• / ' , '----"·;, /,';-;";--··-·:.::·;-.---- ...
Robinson, TN RCT Decrease Television NR 44.6%f 8.95(0.69) 18.38(3.67) 6mos 18.67(3.77) -0.45(-0.73 3 Good
1999 (24) to-0.17)
School Based significant
Target: C Control 103 48.5%F 8.92(0.70) 18.10(3.77) 18.81(13.76) relative 3
" """ ""' ." .. "J.,"I ·"J , .. ,"" . "'""l.lll,t.Jm•IIIL" ''""'''""J .• "',J,., '"J
vie win
Conclusion: Children in the intervention group (decrease television) had statistically significant relative decreases in BMI when compared to the control group. Reducing television, videotape, and video game
"~7~~k~st~~;(!~~~~~!!';~~?;~~:~~ft!~~~}~£~~v~~l*\~!)~s~rt:::
d48%F~
r n•'i
1~7(o:7)"''''If~:~·d· /YI<2';;~;~--
F'r "''"'/q/~~:·~-:~~·
,, //'//
-~~~ff:
P;/'""'''•'f'r~·:·•'././T'G~~~r····
School Based 11 %H %Obese %Obese (0.24 to
Intervention: D, 9%API 0.93,
PA 2%AI P=0.03)
5%0
Control I 654 I 63%W 48%F Il.7(0.7) 21.5%F 23.7%F -2.3 118%F
15%Aa 34.7%M 3!.8%M -!.5 14%8
16%H %Obese %Obese (0.52 to
7%API !.39,
2%AI p=0.48)
9%0
Conclusion: The prevalence of obesity among girls in the intervention schools was significantly reduced (OR 0.47(0.44-0.93), P=0.03) compared with controls, with no differences found among boys (OR
0.85(0.52-1 .39), P=0.48).
n---" -,'"''""-'"•"'''•' '"'"'-""'"'"'"·"·'/·"-'''' ' '"""'"•"'::C'>:<>'W"P /-~/. •r/'"-"''-"h 'pO'•R71'·-~·
D
p NR
RCT
Diet Parent Not Recorded
Randomized Control Trial
0
H
AI
CCT
Other Hispanic American Indian
Controlled Clinical Trial
c
PA
PT
Child
Physical Activity Physical Training
w
AA API
White
Discussion
In conducting this systematic review, I found two high quality studies that
found that showed significant differences in weight loss or BMI change between
intervention and control groups. One evaluated reducing sedentary behavior
(physical activity) verses control and lasted six months (24), and the other
evaluated a multi-disciplinary intervention (diet and physical activity) verses
control and lasted two years (25). Both were school-based interventions. On the
other hand, I found three high quality studies that did not show significant
differences in weight loss or BMI change between intervention and control
groups. All three evaluated multi-disciplinary (diet and physical activity)
interventions verses control (26, 27, 28). All three also lasted at least a year with
the longest one lasting three years. Also, all three were school-based
interventions. Given these findings, I conclude that research currently lacks the
capacity to set clear directions for obesity prevention or treatment in children.
This review has several limitations. One, the review was restricted to
include only articles that were available in the English language which could have
led to a lot of quality studies being left out. Two, the review included such a
small number of studies that no definite conclusions could have been drawn in
any case. Three, the included studies likely lacked external validity because they
were conducted among highly selected populations i.e. American Indians in the
PATHWAYS study (27).
This review highlights a troubling situation. At a time when obesity is at
capacity to set clear directions for obesity prevention across a range of at risk
groups, in particular children. While it seems reasonable to suggest that we
concentrate on strategies that focus on reducing sedentary behaviors and
increasing physical activity, the need for well-designed studies, which examine a
range of interventions remains a priority. Research suggests that multifaceted
behavioral treatment programs seem to be the most promising interventions
available for children (29).
Current efforts at obesity prevention and treatment need to continue to
build the evidence base to determine the most cost-effective and health-promoting
strategies to achieve the goal of a healthy weight for all children. Particular
attention must be paid to undertaking studies with sufficient subject numbers to
ensure adequate power, appropriate follow-up of participants, reliable outcome
measures (BMI), sufficient process indicators, indications of cost effectiveness,
appropriate and adequate statistical analysis, sustainability, and genralizability
(3).
Several things must be kept in mind when approaching the issue of
childhood obesity. Programs addressing this issue should focus on the whole
child, mentally, physically, and socially because it is accepted that obesity, eating
disorders, hazardous weight loss, size discrimination, and body hatred are all
interrelated and need to be addressed in comprehensive ways (30).
Several barriers exist to finding a solution to this huge problem facing
America today. In conducting this review, I was faced with one issue in
can be measured in several ways including BMI, percent body fat, and total body
weight, we must come to a consensus on an ideal measure to be used in future
research. In doing this, we may be able to extrapolate data across studies to come
up with an answer as to what interventions are effective in reducing childhood
obesity. As it currently exists, the outcomes measured are so diverse that it is
hard to determine what is actually the best intervention.
Another aspect of these studies that make it hard to generalize the results
is the wide range of ages of the children included the studies. Given this range of
ages, it was difficult to determine which intervention is the best for what age
group. This was the main reason for narrowing the age range in the initial search
but unfortunately I still ran into the problem of wide age range.
One positive finding that was evident in several of the studies was the
i
potential for schools to be the setting for obesity prevention programs. It is my
opinion that schools are an ideal place to implement programs aimed at children
because of frequent and long-term contact with children, resources and personnel
to support eating and physical activity, and the ability to reach almost all children
despite not knowing what interventions work best.
In conclusion, preventing and treating obesity require persistence,
patience, and understanding. Any person who has ever struggled to lose weight
recognizes this very well. However, until we can find a viable solution to this
problem we must continue to evaluate programs and interventions aimed at
Appendix 1
What's Your Child's BMI Percentile?
1. Find your child's age along the horizontal (across) axis and your child's BMI along the vertical (up-down) axis.
2. You'll find your child's percentile (between 5 and 95) where these two points meet. A child's BMI percentile indicates how his or her measurements compare to other boys or girls in the same age group:
• Underweight: Less than the 5th percentile
• Ideal weight: Between the 5th and the 85th percentiles (50th percentile is average)
• At risk for overweight: Between the 85th and 95th percentiles
• Overweight: Higher than the 95th percentile
GIRLS
Body
Mass Index
32
31
30
29
28
27
26 25
24
23~
22
21
20
19
18
17
16
15
14
13
2 3 4 5 6 7 8 9 10 11 12 13 1415 1617 18 19 20
age In years
I
•
Appendix2
Appendix 2: Steps A-D carried out using abstract only
A. 260 articles identified in the initial electronic database search
t
B. 7 8 articles remaining
t
C. 69 articles remaining
t
D. 55 articles remaining
t
E. 51 articles remaining for full manuscript review
F. 5 articles included in the
systematic review.
182 articles eliminated because they
did not measure the primary outcome
or evaluate drug therapy
9 articles eliminated due to language
14 articles excluded due to date
4 articles eliminated due to study
duration
46 articles eliminated due to not
meeting inclusion criteria after manuscript review
i
f-Appendix 3: Revised CONSORT Statement from ref 24
Title and abstract
1 How participants were allocated to interventions (e.g. "random allocation", ·'randomized", or '·randomly assigned")
Introduction
Background
2 Scientific background and explanation of rationale Methods
Results
Participants
3 Eligibility criteria for participants and the settings and locations where the data were collected
Interventions
4 Precise details of the interventions intended for each group and how and when they were actually administered
Objectives
5 Specific objectives and hypotheses
Outcomes
6 Clearly defined primary and secondary outcome measures and, when applicable, any methods used to enhance the quality of measurements (e.g. multiple observations, training of assessors, etc
Sample size
7 How sample size was determined and, when applicable, explanation of any interim analyses and stopping rules
Randomization Sequence generation
8 Method used to generate the random allocation sequence, including details of any restriction (e.g. blocking, stratification)
Allocation concealment
9 Method used to implement the random allocation sequence (e.g. numbered containers or central telephone), clarifying whether the sequence was concealed until interventions were assigned
Implementation
I 0 Who generated the allocation sequence, who enrolled participants, and who assigned participants to their groups?
Blinding (masking)
I I Whether or not participants, those administering the interventions, and those assessing the outcomes were aware of group assignment. If not, how the success of masking was assessed
Statistical methods
12 Statistical methods used to compare groups for primary outcome(s); methods for additional analyses, such as subgroup analyses and adjusted analyses
Participant flow
13 Flow of participants through each stage (a diagram is strongly recommended). Specifically, for each group, report the numbers of participants randomly assigned, receiving intended treatment, completing the study protocol, and analyzed for the primary outcome. Describe protocol deviations from study as planned, together with reasons
Recruitment
14 Dates defining the periods of recruitment and follow-Ltp
Baseline data
15 Baseline demographic and clinical characteristics of each group
Numbers analyzed
16 Number of participants (denominator) in each group included in each analysis and whether the analysis was by "intention to treat". State the results in absolute numbers when feasible (e.g. I 0/20. not 50%)
Outcomes and estimation
17 For each primary and secondary outcome. a summary of results for each group, and the estimated effect size and its precision (e.g. 95% Cl)
Ancillary analyses
! 8 Address multiplicity by reporting any other analyses performed, including subgroup analyses and adjusted analyses, indicating those pre-specified and those exploratory
Adverse events
19 All important adverse events or side effects in each intervention group Discussion/Comment
Interpretation
20 Interpretation of the results, taking into account study hypotheses. sources of potential bias or imprecision and the dangers associated with multiplicity of analyses and outcomes
Generalisability
Overall evidence
22 General interpretations of the results in the context of current evidence
Overall Grade: Good Fair Poor
Article T i t l e :
-Author: _ _ _ _ _ _ _ _ _ _ _ _ _ _ _ _ _ _ _
Date Appraised: _ _ _ _ _ _ _ _
I
l
l
. " .. ~,.,,,,l,iiliLI~JJIIiJIJIIIIli,,_,. , ---.. u~ - - · · • • • , ... ,J,,,J .. N ... .L
A]
4: Other
~StudiesStudy, Year Study GroiJpS Sample Race Sex Age Study Follow- P Value Patien
l
Study(Reference) Design Size MIF BMI Duration upBMI ts Lost Grade
; or to
Change Follow
i
iuBMI -up
~~i~~i~: A et al, CCT Control 25 l5•M 10•15 10.7(0.6) 25.2(1.4) 6mos 0.72(0.17) P<0.05 NR Fai<
2002 (31)
Clinic~ Based 6-month intervention 65 47•10•8 31>34 10.1(0.3) 25.9(0.4) -1.07(0.23) NR Target: C
Intervention: D, (Ashke
PA nazi:
Sephar adic: mixed)
Conclusion: A combined, structured multidisciplinary (diet and physical activity) intervention for childhood obesity resulted in a significant (P<0.05) decrease in BMI when compared to controls.
Y'V'• ·vxx.~/df//'PWF'/~/'"'"-'' >', r•:-:-."/'''·"· "-,-, · --''"'iC/-"'//''l r•-;-F;W/F/d'/' •·/.•·; -- ···-• r.-r ;_,.,•.,·:;.<;'<'- / ' /• -,;, ,,,., •";w;o • ,_._._., .. ·•o·c; ·-e,;,• ·;;•·o;-.-:-o-~'"'''''/, ;~_-_f-;c· ">''>''·''';',•-' '' -·-/:'-'''""''''/.·:_,-... -;-_ ... _.,_--.;,-w rrx-·-'-'-";/-0"/c"~""-·''!Y'Y'/'. // Y/7'/-1"7' -"'-"' .,_. ... ,., •--•·;•.;;·-r-M"N-'/'-, ··---n-"W" c:0<-7"''''-'>'''/ ;· (' ·:,_: .. -_,.,
Epstein, LH eta!, RCT Increase Activity 29 NR 15M 10.8(1.1) 27.3(3.8) l2mos 0.65(1.37) NR NR Fair 2001 (32) l4F(Co) 10.2(1.4) 26.9(3.6) 0.27(1.37)
Family-Based
Target P, C Increase Activity & 27 14M 10.4(1.2) 27.5(2.5) l2mos -1.76(1.86) Intervention: PA Decrease Sedentary 13F(Co) 9.9(l.l) 27.9(4.7) 1.00(1.73)
Conclusion: Despite the fact that there were no reported differences in BMI between baseline and follow-up between boys and girls for either group, boys showed significantly better percentages of overweight changes (-15.8%) for the combined group than girls (-1.0) (P<0.001), with no significant differences for the increase activity group. The study does show however that child sex may influence weight control in _ --t~~t'~.:~~s--~d i_~-t~~~~!l!_i~e~---~-~~i-~-~~,~?--~5!~!XJ.-~~~s,~-~;~! ,~;.!_i_y~ .. !~;-.... --- •c,-·;c·;;p, '/'-/'"'-" •"\'i;;;.-.-,r'/,_.';''' '''/-"''/'/• F ' / F / ''"/,.'/-' //-'/' ' ' ; · N C ' ' • ' " • ' / ' ' " /"/7;"'• , ... " ~ ., .
,.,."
.. '" (Epstein, LH et a!, RCT Parent + child 17 97%W 8MJ9F 10.7(0.9) 2.8(0.9) 24mos 2.3(l.l) Standard 15% Fair 2000(33) Child only 18 2%AA 9M/9F 10.3(1.2) 2.6(0.9) 1.7(0.9) group had overall Family-Based Standard (control) 17 2%H 8MJ9F 10.0(1.2) 2.7(0.8) 1.6(1.0) larger BMI
Target: P, C Children (All Z-score Z-score decreases
Intervention: D only, particip (p<0.2)
parents not ants) when
included compared to
othcr gwups
Conclusion: No advantages for weight control or loss when parent and/or child is provided problem solving training in addition to standard treatment which included diet and physical activity counseling and
---~~~}~~~~--~ ~~----~~~,~---~~---~~'"~!Y-1,?r
___ ~~-~~§.:.,!~-~~-~~9~~~;--"~?~-~~AI!;l_,S,~1~_i,~~--~~X--~-~-~~!~~--~~-~R-~-~"'~~--:,},h,;<~-~-~--~---~E~,,t~~~--t--~~~~:.," .. _."":-.-. .---.---·--- ' •f','•"/C,"/A/•'/- :-~/P/'/" "/< ;-;-,/' ---r.;----· .. ;,-·• '/' ;·;,-· ,_,..,
Epstein, LH et a!, RCT Increase Activity 37 NR L(5>l3) 10.7(1.3) 62.7(21.2) 24mos -12.4(13.3) Significant 4 Good
2000 (34) (low intensity & high H (6>13) 10.0(1.3) 62.3(13.4) -13.2(16.4) (P<. 001) 4
Family Based intensity group) decreases in
Target P, C
'~~ J;,l,,.,l ,, ~~• •••H·~ " ' '""' '""''"' "' ,,l,.l~i:<Jt,.lJIIilllmll.«
PA
Decrease Sedentary 139
I
I
L (5:14) 10.7(1.0) 55~8(18.1) -11.6(21.9) form
I
~
(low intensity & high H (8:12) 10.6(1.1) 66.6(14.3) -14.3(16.) baseline forintensity group) both groups.
24:52 10.5(1.2) 62.0(17.1) -12.9(17.0) No % Overweight difference
between
~-wf~~:~;;;i,~~~;j\_!;~~¥~-~~-,~9-.~"'el1~~~1;;~;~~z;!!;!~-~~~~~~~~~-~~.~~r~1;~:rr~lf"~f~,i~i'4!r!~~~~~~-~~?!~~g~~"?2~~\~x;r;;;.~~~!~~r~~~~~~d~i~~r~:i~~i''·!~.~f:f~l?;'.~~1i~~
Family Based Control (child led) 30 9.2(0.2) 39.1(3.8) 31.0 P<O.OI 9
Target: C Intervention: D,
PA
%Overweight Between
groups P<0.03
Significa nt differenc
e P<0.02 Conclusion: The family-based experimental approach (parents as the sole agents of change) was more effective in treating childhood obesity than the conventional approach (children as the main focus of
.
~~?J~!~;~:·~nTF.~:l~ :T~;~f;W;~! 1:d'T!~' ,~~~~~!~~r:v!~::~gTt~y~=,;~R]~J.;i~~*~l28
4(6 2o) ..•.
···r
8;]l~;
. ... ..
.1. NR
·r~:E;~~P'
Workout Facility Target: c·
Intervention: PA Group 2 (no PT then PT) 39 OAsian 16W 22Aa I Asian 13M 26F
9.4(1.00) 28.0(6.59) 8mos NR
significant decline in %BFwhile engaged in PT (P<O.OOI) but not during periods of PT.
5 Fair
3
~~1~~~~~~~;:~ ~~'"~~Jr~·~H~~~[·~Bi;~~·~~~!~~:,!i~~(~ f~lr1~i,~
..
~u~n&,R\.~~1·~
?UJI
··;;;~·i~-~.t?~r.l.s~~':I&·~i;t-~1.:·~6t:iJ6~}ll_()·~-~, ~?~
..~~.~~~~~/f~.Y?~~.~~¥.~f3~i;~·~}.~.,tt~~6b%-9~~!il~:
NRClinic-Based Control 7 4:3 10.8(1.2) 28.8(4.2) 0.2(0.9)
Good
Target: C Intervention: D,
PA
Conclusion: Protein-sparing modified fast diet and a hypo caloric balanced diet appear to be effective in a group of age-school-age children in a medically supervised clinic-based program implemented in a
14M31F NR !year
-···mw.·r ... .
-13.08 1 P<O.OOIschool setting over a 6-month period.
''f~;;:(·~~~~-:--"-·'•"'·''•''-'l:--ccT/'/"~/fi"'''l"'•G;~~p-/· Y•·;~~-;·w-/,O'/(<'
/'/''T"45
r---~~----.. '!"
Ism
-~··F;;; ·
(int'lnr'IP<:
11.7(3) All
... ,.l.iillcl. .. lm:lllllllll .••.
57 20M37F
~YCli;ti;'B;~;d'",,_'"A"/c"'l~--, 'F"·'/fl'"/-/fT?:xluJ~di~id~;J"
·'"''
'/W?A"''"""r48/4''~ d·''/-'C'''"T~/AF//F/-~/--T/21M27f--T/JYr9(3)'l?'"/#rNitTarget: C
Intervention: D, Advice I 1.2(2) NR
PA
Camp 55 23M32F I2.I(2) NR Control 54 I9M35F 10.5(I) NR
-9.84 -6.84 -14.67 +2.52 Mean weight loss P<O.OOI P<O.OOI P<O.OOl P<O.OO! All above P-values are within groups. Overall each group lost significantly more weight than the control group (P<O.OOI) both group and individu a!) 13 IO
1 I2
Conclusion: Treatment results in significant (P<O.OOI) reduction in percentage overweight for all therapeutic conditions, even without strict dietary restrictions. months. Treatment consisted of cognitive behavior therapy applied in different manners.
Weight reduction was noticed in a little as three
-. "''"·· Y·">-'''4"'''"''""''""''"'V'- /' /"'"'-'"'·j·/-· .,.-.:;--. ,-.;·"·---·----" "'''·. '":?:./'/'//"//' ,r-.
1--/- ''""'"_,. // k •... .,/.'f'-"/4// "'"""'''''''""'"·'-'r"":r-/·· ., ,,.,,.:- "/- " :''"'"'"'"'' .. _ .. "'
Epstein, LH eta!, RCT Experimental I7 NR
I
4,13I
10 3(1.3)I
60.6(25.3) 1994 (39) (mastery criteria andClinic-Based contingent Target C, P reinforcement) intervention
Control (behavior change strategies and non-contingent reinforcement)
22 6'I6 10.2(1.0) 58.8(19.6)
(percent over 50th percentile for BMI)
24mos (intervention lasted 6 mos but patients followed for 2 years)
-15.4
-10.6
Si;tr.~;;;;v-
''(NR '"'"''''. (
p;j;~-'"•'
changes in percent over weight at 6 and 12 mas
p < 0.05
No
significant difference at 24mosp=
. . . ' ' ' ' 0.29
Conclusion: Results showed significantly better relative weight change at 6 months and I year for children in the experimental compared to the control group, but these effects were not maintained at 2 years.
-.. -Je:~e,-,~~~~l~.,-S..':I.?J~-~-?~--~'~}~!-~~st,ie_!\?,!,~:~,~~~~,,~-~-~~~<;,~~~ :S?~~~~-~;}~-~:7eJ.~X~~£er~~;~~
..
f~~,~~~~~~-IJ. ~~-~ i~p~~~; -~~t~?~T,~--~~~~~"t;~~~~~ .. t}~.!!;~-~~!?,~~1 }!,~;tT;!!~l~~-c_~}_t_~-~~-,~-~~~~-t~-:Israel, ACetal,
I
RCTI
Standard TreatmentIII
I
NRI
NR,8-13
145.94(17.11)r
TreatmentI
TX I NR I NR I Fair 1993 (29) (parent controlled) years old (TX) 6.5mos 33.43(17.00)Office Based 52.30(24.37)
Target: P, C Intervention: D,
PA F.nh~nrf'fi rhilrl 9
48.10(18.3I) Follow-up
(fu) 3vrs
Fu
. ,M.Jci,.,L« ... ,,.,. • • • • • • . M . . . . UI,I.Jm-lllL. . ... L ... I .. I
controlled) t (child 43.29(21.18)
%0verweiJJ:ht
Conclusion: This study examined the effect of a multi-component self-regulation intervention, which had four components: goal setting, self-monitoring, self-evaluation, and self-consequence. The study was not adequately powered to determine statistical significance between groups although it was noted that 44% of the ECI children verses 0% of the ST children were below post treatment (6.5mos) %overweight level~ at_the.~~year follow~up.
~.-;S~Jlis:'·Jp·;; ~~/,"-?xnvRCT'''' ''•"''?'/c
'SPARK
('f;;~i~;l ''T'r"' '745.~(T;~J)v-~85%W0" NR 7·'--'\v ..Jv.
NR 2Ye~~· NR GirtS hadno ..
NR Fair1993 (40) Education & Self 6%API Difference
School Based Management) 7%H in BMI at
Target C 1 %Aa 2years.
Intervention: PA 1%0
Control Boys at the
control schools decreased
BMI
significantly
(p<O.OI)
more than
SPARK
schools
Conclusion: Two years of participation in a special physical education activity program did not produce significant reductions in children's BMI or adiposity. It was noted however, that SPARK was not designed to be an obesity prevention program.
~'0/t/"//'~p~/'""~~~r~~;/t//'-/'''" ,,,.,_ '/"'•''~· :""''" '/" , ' / 0 / " · / • / ' 0 / ' ' /•':<Y/<''' ' ·;;, • ~'//" / Tk'/0''~ ' " ~'"' / -~ ,•- ,. ' ~-; /" · ·;--/-"~" .,. ~·••;.-;--" ""'.<"/' " •' ; / -~ '• "/•"-" -,· " " / " ' "
Duffy & Spence, RCf Behavior Therapy 28(total) NR 6 M 118.71(20 46.28(19.32) 6mos 37.09(21.71) NR ll(total) Fair
1993 ( 41) plus Placebo Control 22 F .16) mos There was
Clinic Based (Total) no apparent
Target C Cognitive Self 45.96(18.55) 37 .02(24.58) difference in
Intervention: D, Management plus response
PA Behavior Therapy between the
%Overweight two groups
Conclusion: The two procedures were effective at reducing obesity; however, there were no differences noted between groups. Average reductions of around 9% in percentage overweight adjusted for age, height, and sex were noted fro both groups.
;-".;' ;--··''''"'"''-;";·<•'0<"'/';;--c'''•'':;•~-,._,~vo; '•'//'·'//'/"''/-':/'t':/-/o•",/''' '";-''/,'''' ? / / "~~-;j -~'; ·""", ---;;-~-;~ ·, -~ -'" --/--'o• ';",;
;--;~-,--FJOdffiark,CEet CCT Treatment Group "NR -~IQM 10-11 at 25.5(0.53) 12mos 27.1(0.88) BMiof 0 Fair
al, 1993(42) !(conventional) 9F start (all family
Family Based participan group is
Target C Treatment Group 25 liM ts) 24.7(0.36) 25.8(0.53) significantly 4
Intervention: D 2(family therapy) 14F less than
that of
Control Group 50 16M 25.1(0.35) 27.9(0.61) control 2
31F group
~~ ~ ~1.: •. 1 .•. ~1' L.v • • • • ·~· •..•. , •. 1 .• 11~t .. 1m,1111111111 •• ~·
I I I I I I I I I I I
Conclusion: Family therapy is effective at preventing the development of severe obesity during childhood. Using the intent-to-treat principle, increases in BMI in the family therapy group was less than both of
_,,J-'~/~~~!!;~4~2/~p~j~~~!;':-:;.~~!?Se!x,~~ r2.~~~~~;,2;;,~.~~-"!~_;,!~)~~Jx,;~/~~~~x.~~~v~e~,~?!:l%2/~~!'!~r~/~!t!~&~~~-~l~~~~e/~J;,/,'---~~Mv·-·· ,-c~.,,._./'" ··rm/>X''''' w/·'/·7/nni'Y/Mff/YYPYP•A'•~/?Nrd:/,'IN'·fts:> • ,.-,x-r/Y/ •~·~·••/• ---/-/-~•/'" .,,,7;0
Epstein, LH et at, RCT Child & Parent 20 NR 6MI4F 9.4(1.8) 41.7(16.3) 10years -7.0% Children in NR Fair
I 990 (43) the child
Family Based parent group
Target: P, C Child 16 7M9F 10.4(1.2) 43.5(16.1) +4.7% had
Intervention: D, significantly
PA (P<0.05)
Nonspecific Control 19 6MI3F 9.9(2.3) 46.2(15.4) +13.6% greater reduction in %Overweight Changes in percent
% overweight Overweight than
children in control with children in child only group between.
Conclusion: The results fro this study provide evidence for long~term treatment of childhood obesity. This study implies that if behavioral, family based treatment is initiated when the child in between the ages
~:ve!~~~~~~·~1rt~~~!~·,/!~y~-~~~~;~"'~!~)!~~-~~~,,~-~~~~r~~~~~,.e~~.!!~-~.9:.,.,/ ~'
" ' ? /
l.EGEND
D Diet 0 Other c Child w White
p Parent H Hispanic PA Physical Activity AI} African American
NR Not Recorded AI American Indian PT Physical Training API Asian/Pacific Islander
References
l. Spence-Jones G. Overview of Obesity. Critical Care Nursing Quarterly. 2003; 26(2): 83-88.
2. Ebbeling CB, Pawlak DB, Ludwig DS. Childhood obesity: public-health crisis, common sense
cure. Lancet. 2002:360:473-482.
3. Summerbell CD, Ashton V, Campbell KJ, Edmunds L, Kelly S, Waters E. Interventions for treating
obesity in children. Cochrane Database Syst Rev. 2003;(3): CD001872.
4. Schmidt CW. Obesity: A Weighty Issue for Children. Environmental Health Perspectives. 2003; 111(13): A700-A707.
5. CDCGrowthCharts: UnitedStates.A vailableathttp://www .cdc. gov/nchs/about/major/nhanes/growhtc
harts/background.htm Last visited on 6/2/2004.
6. Sommerfield, Julia. Obesity turning into major threat for nation's kids. The Seattle Times.
Thursday. February 05, 2004.
7. Galvez MP, Frieden TR, Landrigan PJ. Obesity in the 2P1
Century. Environmental Health
Perspectives. 2003; 111(13): A684-A685.
8. McTigue KM, Harris R, Hemphill B, Lux L, Sutton S, Bunton AJ, Lobr KN. Screening and
Interventions for Obesity in Adults: Summary of the US preventive Services Task Force. Annals of
Internal Medicine. 2003; 139(11): 933-949.
9. U.S. Preventive Services Task Force. Guide to Clinical Preventive Services, 2"d ed. Alexandria,
Virginia: International Medical Publishing, 1996.
10. The Surgeon General's Call to Action To Prevent and Decrease Overweight and Obesity:
Overweight in Children and Adolescents. A vai1able at
http://www.surgeongeneral.gov/topics/obesity/calltoaction/fact adolescents.htrn Last visited on
4/22/2004.
11. The Surgeon General's Call to Action To Prevent and Decrease Overweight and Obesity:
Overweight and Obesity: Health Consequences. Available at
http://www.surgeongeneral.gov/topics/obesity/calltoaction/fact consequences.htrn Last visited on
4/22/2004.
12. The Surgeon General's Call to Action To Prevent and Decrease Overweight and Obesity:
Overweight and Obesity: At a Glance. Available at
htto:/ /www .surgeongeneral. gov/topics/obesity/calltoaction/fact glance.htrn Last visited on
4/22/2004.
13. Whitaker RC, Wright JA, Pepe MS, Seidel KD, Dietz WH. Predicting Obesity in Young Adulthood
from Childhood and Parental Obesity. NEJM. 1997; 337(13): 869-873.
14. Chagnon YC, Rankinen T, Snyder EE, Weisnagel SJ, Perusse L et al. The human obesity gene
map: the 2002 update. Obes Res. 2003: 1 1: 313-367.
15. Hebebrand J, Sommerlad C, Geller F, Gorg F, Hinney A. The genetics of obesity: practical
implications. international Journal of Obesity 2001; 25 (Suppll): SIO-S17.
16. Fabsitz RR, Carmelli D, Hewitt JK. Evidence for independent genetic influences on obesity in
middle age./nt JObes Relat Metab Disord 1992; 16:547-666.
17. Stylianou IM, Christians JK, Keightley PD, Bunger L, Clinton M, Bulfield G, Horvat S. Genetic
complexity of an obesity QTL (Fob3) revealed by detailed genetic mapping. Mammalian Genome.
2004:15:472-481.
18. McTigue KM, Garrett JM, Popkin BM. The Natural History of the Development of Obesity in a
Cohort of Young US Adults between 1981 and 1998. Annals of internal Medicine. 2002;
136:857-864.
19. Peeters A, Barendregt JJ, Wi!lekens F, Johan MP, Abdullah MA, Bonneux L. Obesity in Adulthood
and Its Consequences for Life Expectancy: A Life:.-Table Analysis. Annals of Internal Medicine.
2003; 138:24-32.
20. Calle EE, Thun MJ, Petrelli JM, Rodriguez C, Heath CW Jr. Body-mass index and mortality in a prospective cohort of U.S. adults. N Eng/ J Med. 1999 Oct 7; 341(15): 1097-105.
21. Mokdad AH, Marks JS, Stroup DF, Gerberding JL. Actual Causes of Death in the United States,
2000. JAMA. 2004; 291(10): 1238-1245.
22. Allison DB, Fontaine KR, Manson JE, Stevens J, Van ltallie TB. Annual deaths attributable to
obesity in the United States. JAMA. 1999: 282: 1530-38.
23. Moher D, Schulz KF, Altman D; CONSORT Group (Consolidated Standards of Reporting Trials).
The CONSORT statement: revised recommendations for improving the quality of reports of
parallel group randomized trials. JAMA. 2001 Apr 18;285(15):1987-91.
24. Robinson TN. Reducing· Children's Television Viewing to Prevent Obesity: A Randomized
Conttolled Trial. JAMA. 1999 Oct 27; 282(16): 1561-1567.
25. Gortmaker SL, Peterson K, Wiecha J, Sobol AM, Dixit S, Fox MK, Laird N. Reducing Obesity via
a School-Based Interdisciplinary Intervention Among Youth: Planet Health. Arch Pediatr Adolesc
Med. 1999; 153:409-418.
26. Warren JM, Henry CJK, Lightowler HJ, Bradshaw SM, Perwaiz S. Evaluation of a pilot school programme aimed at the prevention of obesity in children. Health Promotion International. 2003; 18(4): 287-296.
27. Caballero B, Clay T, Davis SM, Ethelbab B, Rock BH, Lohman T, Nonnan J, Story M, Stone EJ, Stephenson L, Stevens J. Pathways: a school-based, randomized controlled trial for the prevention of obesity in American Indian schoolchildren. Am J Clin Nutr. 2003; 78: 1030-8.
28. Sabota P, Rudolf MCJ, Dixey R, Hill AJ, Barth JH, Cade J. Randomized controlled trial of primary school based intervention to reduce risk factors for obesity. BMJ. 2001; 323: 1-5.
29. Israel AC, Guile CA, Baker JE, Silverman WK. An Evaluation of Enhanced Self-Regulation Training in the Treatment of Childhood Obesity. Journal of Pediatric Psychology. 1994; 19(6): 737-749.
30. Guidelines for Childhood Obesity Prevention Programs: Promoting Healthy Weight in Children.
Journal ofNutrtion Education and Behavior2003; 35(1): 1-4.
31. Eliakim A, Kaven G, Berger I, Friedland 0, Wolach B, Nemet D. The effect of a combined intervention on body mass index and fitness in obese children and adolescents - a clinical experience. Eur J Pediatr. 2002 Aug; 161(8): 449-54.
32. Epstein LH, Paluch RA, Raynor HA. Sex Differences in Obese Children and Siblings in Family-based Obesity Treatment. Obesity Research. 2001; 9(12): 746-753.
33. Epstein LH, Paluch RA, Gordy CC, Saelens BE, Ernst MM. Problem Solving in the Treatment of Childhood Obesity. Journal of Consulting and Clinical Psychology. 2000; 68(4): 717-721. 34. Epstein LH, Paluch RA, Gordy CC, Dorn J. Decreasing Sedentary Behaviors in Treating Pediatric
Obesity. Arch Pediatr Adolesc Med. 2000; 154: 220-226.
35. Golan M, Weizman A, Apter A, Fainaru M. Parents as the exclusive agents of change in the treatment of childhood obesity. Am J Clin Nutr. 1998; 67: 1130-5.
36. Gutin B, Owens S, Okuyama T, Riggs S, Ferguson M, Litaker M. Effect of Physical Training and Its Cessation on Percent Fat and Bone Density of Children with Obesity. Obesity Research. 1999; 7(2): 208-214.
37. Figueroa-Colen R, Franklin FA, Lee JY, von AI men TK, Suskind RM. Feasibility of a clinic-based hypo caloric dietary intervention implemented in a school setting for obese children. Obes Res. 1996 Sep; 4(5): 419-29.
38. Braet C, Winckel MV, Leeuwen KV. Follow-up results of different treatment programs for obese children. Acta Paediatr. 1997; 86: 397-402.
39. Epstein LH, McKenzie SJ, Valoski A, Klein KR, Wing RR. Effects of mastery criteria and contingent reinforcement for family-based child weight control. Addictive Behavior. 1994; 19(2): 135-145.
40. Sallis JF, McKenzie TL, Alcaraz JE, Kolody B, Hovel! MF, Nader PR. Project SPARK. Effects of Physical Education on Adiposity in Children. Annals New York Academy of Sciences. 1993 Oct 29; 699: 127-36.
41. Duffy G, Spence SH. The effectiveness of cognitive self-management as an adjunct to behavioral intervention for childhood obesity: a research note. J Child Psychol Psychiatry. 1993 Sep; 34(6): 1043-50.
42. Flodmark CE, Ohlsson T, Ryden 0, Sveger T. Prevention of progression to severe obesity in a group of obese schoolchildren treated with family therapy. Pediatrics. 1993 May; 91 (5): 880-4. 43. Epstein LH, Valoski A, Wing RR, McCurley J. Ten-year follow-up of behavioral, family-based