EVALUATION OF ENDOTHELIAL CELL RESPONSES TO ELEVATED GLUCOSE IN VITRO
A Thesis presented to
the Faculty of California Polytechnic State University, San Luis Obispo
In Partial Fulfillment
Of the Requirements for the Degree Master of Science in Biomedical Engineering
By
ii © 2018
iii
COMMITTEE MEMEBERSHIP
TITLE:
AUTHOR:
DATE SUBMITTED:
COMMITTEE CHAIR:
COMMITTEE MEMBER:
COMMITTEE MEMBER:
Evaluation of Endothelial Cell Responses to Elevated Glucose In Vitro
Gabriella Paige Byrd Sugerman
August 2018
Kristen O’Halloran Cardinal, Ph.D. Professor of Biomedical Engineering
Trevor Ryan Cardinal, Ph.D.
Professor of Biomedical Engineering
iv ABSTRACT
Evaluation of Endothelial Cell Responses to Elevated Glucose In Vitro Gabriella Paige Byrd Sugerman
Developing a tissue-engineered Blood Vessel Mimic (BVM) to represent diabetic macrovascular disease could expedite design of new vascular devices specifically tailored to diabetic patients. In contribution toward this model, this thesis assessed Human Umbilical Vein Endothelial Cell (HUVEC) responses to high glucose conditions. Interleukin 6 (IL-6) and Cluster of Differentiation 36 (CD36) were selected to signify oxidative stress activity, a hallmark of diabetic macrovascular disease. Next, activity of potential reference genes B2M, HPRT1, and ACTB was assessed. All genes were found to exceed acceptable variability, so the E-ΔCT method of data analysis was selected. Next, cellular responses to high glucose treatment at 10.5 mM glucose and 25.5 mM glucose for 7 and 14 days were measured by qPCR. IL-6 mRNA
expression increased significantly (p<0.001) following treatment with 25.5 mM glucose at both timepoints.
Finally, fluorescent staining for Reactive Oxygen Species (ROS) production and cell viability was performed on HUVECs treated with 10.5- and 25.5-mM glucose for 24 and 48 hours. No differences in ROS production or cell viability were detected due to uncontrolled cell damage during the two-hour staining and imaging procedure. This thesis was limited by low reaction efficiency in qPCR reactions due to mistaken purchasing of primers with included probe-quencher reporters. Measurement of reaction efficiency facilitated valid analysis of data collected using these primers. Imaging experiments were unsuccessful due to a lack of
v
ACKNOWLEDGMENTS
I would like to thank Dr. Kristen Cardinal for her guidance and support throughout my pursuit of a Master of Science degree. The privilege of working with Dr. Cardinal has inspired my curiosity, determination, and enduring love of research. Her positive impact on all of her students—especially those in her research laboratory—inspires greatness in our department.
I would also like to thank my committee members, Dr. Trevor Cardinal and Dr. Daniel Peterson, for their time and expertise. Additionally, I would like to thank my fellow research lab members, especially Enoch Tsui and Conor Hedigan, for their assistance in the laboratory, willingness to share their knowledge, and moral support.
vi
TABLE OF CONTENTS
Page
LIST OF TABLES ... ix
LIST OF FIGURES ... x
CHAPTER 1. INTRODUCTION ... 1
1.1 Diabetes Mellitus ... 1
1.1.1 Prevalence ... 1
1.1.2 Pathology ... 1
1.2 Traditional Device Testing Progression... 5
1.3 Blood Vessel Mimics ... 6
1.3.1 Inducing Elevated Glucose Conditions in BVMs ... 8
1.4 Cellular Responses and Expression of mRNA and Proteins ... 9
1.4.1 Cellular Response to Oxidative Stress and qPCR... 9
1.4.2 Reactive Oxygen Species and Fluorescent Microscopy ... 14
1.5 Summary and Aims of this Thesis ... 14
2. DETERMINING GENES OF INTEREST AND OPTIMIZING QPCR DATA ANALYSIS 16 2.1: Introduction ... 16
vii
2.3 Data Analysis Methods ... 26
2.4 Data Analysis Results ... 29
2.5 Discussion ... 41
3. EVALUATING GENE EXPRESSION IN RESPONSE TO INCREASED EXTRACELLULAR GLUCOSE ... 43
3.1 Introduction ... 43
3.2 Methods... 43
3.3 Results ... 47
3.4 Discussion ... 49
4. EVALUATING ROS GENERATION IN RESPONSE TO INCREASED EXTRACELLULAR GLUCOSE ... 53
4.1 Introduction ... 53
4.2 Methods... 55
4.3 Results ... 60
4.4 Discussion ... 67
5. DISCUSSION AND CONCLUSION ... 71
5.1 Summary and Aims of this Thesis ... 71
5.2 Challenges and Limitations... 72
5.3 Future Work ... 76
viii
BIBLIOGRAPHY ... 81
APPENDICES A. Primer Sequences ... 96
B. Protocol for Primer Design ... 99
C. Protocol for qPCR ... 101
D. Protocol for qPCR Data Analysis ... 104
E. Protocols for Cell Culture ... 108
F. Protocols for RNA Isolation and Purity Assessment ... 110
G. Protocol for cDNA Synthesis ... 114
H. Protocols for Cell Culture for Confocal Microscopy ... 116
I. Protocols for ROS Production and Cell Viability Assessment... 118
J. Protocols for Confocal Imaging ... 120
K. Macros for Image Processing ... 123
L. ANOVA Reports ... 125
ix
LIST OF TABLES
Table ... Page
2.1: Initial Genes of Interest... 17
2.2: Relative Quantification Methods ... 28
2.3: Measured Efficiencies by Gene from Standard Curve Analysis ... 31
3.1: Experimental Design for qPCR Experiments ... 47
3.2: Measured Efficiency Values from Chapter 2 ... 47
4.1: Experimental Design... 56
4.2: Dyes and Imaging Settings for Experiment 1 ... 57
4.3: Experiment 2 Imaging Settings... 57
x
LIST OF FIGURES
Figure Page
1.1: Insulin Resistance Increases with Disease State. Progression of severity of insulin resistance and the associated diagnoses with their associated macrovascular symptoms [5]. ... 3 1.2: Decreased Event-Free Survival in Diabetic Patients with Vascular Stents [13]. Adverse
events include death, cardiopulmonary events (stroke, myocardial infarction, pulmonary embolism) and restenosis. ... 5 1.3: Blood Vessel and BVM Layers. Blood vessels are composed of tunicae intima, media,
and adventitia, while BVMs are composed of polymer scaffolds and cell linings. ... 7 1.4: Bioreactor Schematic in the Cal Poly Tissue Engineering lab. Cells are sodded into
polymer scaffold before incorporation into peristaltic flow system. Cell media is pushed through tubing, through the lumen of the BVM, circulating as cell layer develops. Stopcocks isolate flow through transmural or transluminal paths. ... 8 1.5: Pathways Involved in Hyperglycemia-Induced Endothelial Damage. Many pathways
interact to initiate diabetic macrovascular disease. Both targets for gene expression analysis are mechanistically understood to be upregulated under hyperglycemic conditions [8]. ... 10 2.1: Amplification Plot of All Initial Primers. Each line represents one individual qPCR
xi
2.2: Amplification Plot with Linear Amplification Region, Threshold, and CT. ... 21 2.3: Amplification Plots of Successful Initial Primers. Isolated here are only those primers
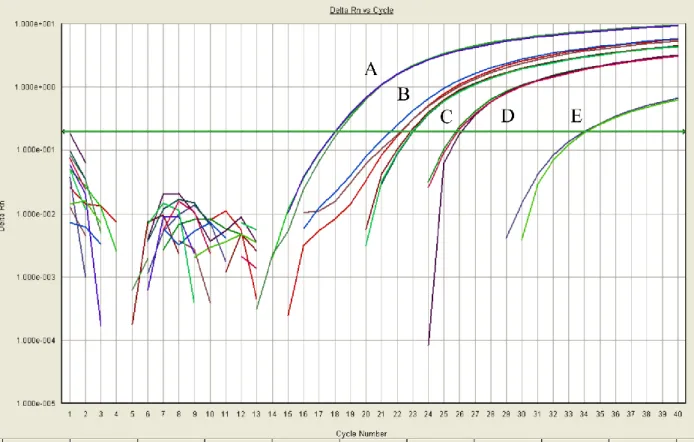
which produced three CT values approximately equal to one another. As in Figure 2.2, the x-axis represents PCR progression and the y-axis represents change in fluorescence intensity. Each line represents one sample qPCR well. ... 22 2.4: Amplification Curves of PrimeTime Preverified Primers (A)IL-6 (B)ACTB (C)B2M
(D)HPRT1 (E)CD36. ACTB (B) displays greater variability among replicates than other sets. ... 25 2.5: Dissociation curves of (A) ACTB and (B) IL-6. ACTB has a peak in the non-template
control sample, demonstrating primer-dimer formation. ... 26 2.6: Standard Curve Amplification Plots: Change in fluorescence intensity over time (Delta
Rn) versus progression of qPCR (Cycle Number) for (A) IL-6 (B) CD36 (C) B2M and (D) HPRT1 pre-verified primers. Horizontal lines depict threshold values. ... 30 2.7: Representative Standard Curve Analysis. B2M cDNA dilution factor versus average
CT value. Slope of the trendline is used to determine qPCR efficiency. ... 31 2.8: E-CT Analysis. (A) B2M expression decreases with Moderate treatment and increases
with High glucose treatment. (B) CD36 expression remains consistent across treatments. (C) HPRT1 expression decreases with Moderate treatment. (D) IL-6 expression increases with High glucose treatment. All values are in arbitrary units presented as mean ± SEM. ... 33 2.9: E-ΔCT Analysis of 7-Day Data. (A) B2M (B) CD36 (C) HPRT1 and (D) IL-6 expression
xii
2.10: 2-ΔΔCT Analysis of 7-Day Data. Influence of reference gene on results of comparative CT method. Expression of genes (A, C, E) relative to HPRT1 expression and (B, D, F) relative to B2M expression. All values are in arbitrary units presented as mean ± SEM. ... 37 2.11: Probe-Quencher qPCR Reporting Mechanism ... 39 2.12: Probe-Quencher Reporting of 7-Day Responses. Data are presented as mean ± SEM ... 40 3.1: Relative Abundance Comparisons Between Assumed and Calculated Efficiency
Values after 7 Day Treatment. (A)B2M expression increased at High glucose concentration. (B) CD36 expression remained consistent across treatment groups. (C) HPRT1 expression remained consistent across treatment groups. (D) IL-6 expression increased at High glucose concentration. Data are presented as mean ± SEM. ... 48 3.2: Relative Abundance of Target Genes at 14-day Timepoint. (A) B2M expression
increased with High glucose treatment. (B) CD36 expression was unaffected by treatment. (C) HPRT1 expression decreased with Moderate glucose treatment but remained consistent from Basal to High glucose treatment. (D) IL-6 expression increased with High glucose treatment. All data are in arbitrary units and are presented as mean ± SEM. ... 49 4.1: Increased Extracellular Glucose Increases ROS Generation and Subsequent Tissue
xiii
4.2: Viability by Treatment and Duration. In Basal (5.5 mM) glucose condition, viability increased between 24 and 48 hours. Neither Moderate (10.5 mM) nor High (25.5 mM) glucose condition displayed change in viability between 24 and 48 hours. ... 61 4.3: Representative Images from Experiment 1. (A) Hoechst 33342-positive (B)
Carboxy-H2DCFDA-positive (C) EthD-1-positive and (D) Composite images of basal (5.5 mM glucose) treatment condition after 48 hours ... 62 4.4: ROS Generation as Mean Gray Value by Treatment and Duration. Samples were
treated with Basal (5.5 mM), Moderate (10.5 mM), or High (25.5 mM) glucose. Positive Control samples received Basal glucose treatment and TBHP treatment for ROS generation ... 63 4.5: Cell Viability by Treatment at 48 Hours. Positive control samples were cultured with
basal (5.5 mM) glucose before TBHP treatment which may decrease cell viability. Basal (5.5 mM), Moderate (10.5 mM) and High (25.5 mM) glucose treatments show no effect on cell viability ... 64 4.6: Representative Images from Experiment 2. (A) Hoechst 33342-positive (B)
Carboxy-H2DCFDA-positive (C) EthD-1-positive and (D) Composite images of basal (5.5 mM glucose) treatment condition after 48 hours ... 65 4.7: ROS Generation on (A) Day 1(n=4 per group) and (B) Day 2 (n=4 per group) of
1 1. INTRODUCTION
1.1 Diabetes Mellitus
1.1.1 Prevalence
Diabetes is extremely prevalent in the United States, and incidence is on the rise. The Centers for Disease Control release an annual National Diabetes Statistics Report and estimate that in 2015, 9.4% of the U.S. population—over 30 million people—had diabetes [1]. Of those, 95% had Type 2 Diabetes, which is primarily caused by lifestyle factors [1]. Insulin resistance and associated endothelial dysfunction often begin many years before diagnosis of Type 2 Diabetes and is increasing among normoglycemic individuals, with estimates of insulin resistance reaching 32.2% in 1999-2002 [2].
1.1.2 Pathology
Diabetes Mellitus is a metabolic disease wherein glucose is improperly processed by the body, potentially leading to widespread tissue damage. There are two distinct pathologies that differ according to which mechanism of insulin-mediated glucose uptake that is dysfunctional. Type 1 Diabetes is characterized by autoimmune destruction of insulin-producing pancreatic β cells, leading to negligible blood insulin concentrations. Type 2 Diabetes is characterized by resistance to insulin signaling, leading to an elevated blood insulin concentration [3]. Though the two diseases share many symptoms, including endothelial dysfunction and macrovascular
2
the mass balance effect leads to increased GLUT1 utilization. One byproduct of glucose
metabolism through GLUT1 is hexosamine, which has a negative feedback effect on GLUT4 and exacerbates development of insulin resistance [4]. Decreased insulin utilization leads to
hyperinsulinemia, a hallmark of Type 2 Diabetes which is absent in Type 1 Diabetes.
When a molecule of glucose enters a cell, it undergoes glycolysis initiated by hexokinase in the cytosol and is converted to two three-carbon molecules of pyruvate. Pyruvate is
transported to the mitochondria where the citric acid cycle, also known as the Kreb’s Cycle, converts it to acetyl-CoA. This cycle yields energy in the form of adenosine triphosphate (ATP) and byproducts NADH and FADH2, which initiate the electron transport chain along the
mitochondrial membrane. The electron transport chain converts high-energy NADH and FADH2 molecules to additional ATP [5]. In Type 2 Diabetes, excess glucose flux causes insufficient hexokinase enzyme availability and additional glucose enters the polyol pathway, leading to increased sorbitol production, which induces oxidative stress. Additionally, NADPH is depleted, producing an increased NADH/NAD+ ratio which further contributes to oxidative stress [6].
Oxidative stress caused by hyperglycemia can cause several coincident conditions in multiple organ systems. An increased amount of circulating glucose is widely understood to trigger mitochondrial production of reactive oxygen species (ROS). These oxygen-containing molecules include radical electrons, allowing them to bind essential molecules like DNA and proteins, thereby worsening oxidative stress conditions in the cells [7]. This activates a continuous inflammatory response, leading to systemic damage over long periods of time, including degradation of the nervous and circulatory systems [8].
3
cellular damage by creating advanced glycation end products (AGEs), protein and lipid
molecules modified by exposure to glucose [9]. AGEs are influential cellular signals, initiating vascular constriction and vascular stiffening that results in systemic atherosclerosis [10]. In Type 2 Diabetes, vascular stiffening manifests in the entire body from retinopathy to peripheral
neuropathy, but the highest mortality rate is caused directly by cardiac macrovascular disease [1].
Figure 1.1: Insulin Resistance Increases with Disease State. Progression of severity of insulin resistance and the associated diagnoses with their associated macrovascular symptoms [5].
Macrovascular disease evolves slowly over an individual’s lifetime. As chronic stiffening and occlusion of blood vessels, or atherosclerosis, progresses over time, symptoms penetrate from the innermost to outermost layers of blood vessels. The innermost lining of blood vessels is composed of endothelial cells (ECs), which undergo glucose-sensitive signaling pathways in response to oxidative stress. In healthy endothelial cells, insulin signaling leads to
4
(ESMIRO), endothelial insulin resistance has been shown to decrease vasorelaxation responses to acetylcholine, increase superoxide production, and promote development of atherosclerotic lesions [11, 13]. Endothelial cells transmit insulin from the bloodstream to skeletal muscle, a primary location for insulin-mediated glucose metabolism, so when endothelial insulin signaling is disrupted, glucose uptake by skeletal muscles is decreased [12] and hyperglycemia is
aggravated.
5
Figure 1.2: Decreased Event-Free Survival in Diabetic Patients with Vascular Stents [13]. Adverse events include death, cardiopulmonary events (stroke, myocardial infarction, pulmonary
embolism) and restenosis.
Every improvement to current practice has closed the gap between diabetic and non-diabetic populations [19], but it persists, and has driven medical device companies to design stents and other vascular interventions specifically for diabetic patients [15, 16].
1.2 Traditional Device Testing Progression
6
coagulation and intimal healing patterns than human counterparts, and results from canine trials failed to predict success of human trials [22].
Artificially-induced atherosclerosis often produces endothelial abrasions on otherwise healthy rats, rabbits, and swine [23], leading to a very different habitat for recovery than a diabetic blood vessel. Drug-induced diabetic animal models and 2D cell-culture models are used in tandem to evaluate stent quality [15], but cannot predict the outcome of clinical testing [17– 20]. Tissue engineering, a broad term for combining engineered materials and living cells to create functional constructed tissues, has enabled device designers to conduct intermediate research between established 2D benchtop testing methods and costly animal trials [26]. 1.3 Blood Vessel Mimics
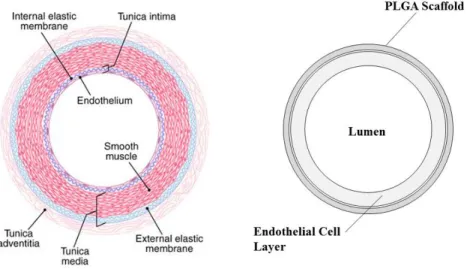
In order to test vascular devices, Cal Poly’s Tissue Engineering Lab cultivates tissue-engineered blood vessel mimics (BVMs) using polymer scaffolds and human vascular cells. Cells are derived from umbilical cord veins isolated and pooled over multiple donated umbilical cords. Cells from the innermost layer are referred to as Human Umbilical Vein Endothelial Cells (HUVECs). HUVECs are cultured before being harvested and injected into a polymer scaffold.
7
vessel layers to corresponding components of the BVM. To isolate the endothelial dysfunction response to elevated glucose, models in this thesis contain only HUVECs. Over time, the cells form a robust layer, which can respond to environmental conditions like high glucose
concentration or foreign objects like implanted stents.
Scaffolds are incorporated into a bioreactor, a closed system whereby cell media can be pumped through vessel mimics under pulsatile flow. Figure 1.4 depicts the path of cell media through the peristaltic pump, bioreactor, and cell media reservoir.
Figure 1.3: Blood Vessel and BVM Layers. Blood vessels are composed of tunicae intima, media,
8
1.3.1 Inducing Elevated Glucose Conditions in BVMs
To replicate the hyperglycemic conditions present during prediabetes and Type 2 Diabetes, additional glucose can be added to cell media [28]. Standard cell media contains 5.5 mM glucose as a source of cellular energy, meant to reproduce the concentration of glucose in the blood in a normoglycemic individual. To imitate prediabetic conditions, glucose
concentration can be increased to 10.5 mM; to imitate diabetic conditions, the concentration can be 25.5 mM (Table 1.1). Moderate glucose media was made by combining 8.40 mL 80 mM sterile glucose solution with 116.6 mL cell media, and high glucose media was made by
combining 33.55 mL 80 mM glucose with 91.45 mL cell media. These concentrations have been previously established as sufficient to influence cell behavior as measured by changes in gene expression [28]. The glucose concentration required to detect changes in viability representative of diabetic conditions is higher in cultured cells compared to recently-isolated primary cells. This difference is related to changes in glucose utilization of proliferating cells in culture [29, 30].
Figure 1.4: Bioreactor Schematic in the Cal Poly Tissue Engineering lab. Cells are sodded into
polymer scaffold before incorporation into peristaltic flow system. Cell media is pushed through
tubing, through the lumen of the BVM, circulating as cell layer develops. Stopcocks isolate flow
9 Table 1.1: Elevated Glucose Conditions
Treatment Label
Total Glucose Concentration (mM)
Total Glucose Concentration (mg/dL)
Represented Disease State [22] (Diagnostic Fasting Plasma Glucose)
Basal 5.5 99 Normoglycemic
(<100 mg/dL)
Moderate 10.5 189 Prediabetic
(100-125 mg/dL)
High 25.5 459 Diabetic
(>126 mg/dL)
Exposing BVMs to high glucose conditions is the first step toward potentially approximating the environment of a diabetic blood vessel. If the conditions are sufficiently similar, the BVMs should exhibit oxidative stress, a well-documented cellular response to elevated glucose [9, 24, 25].
1.4 Cellular Responses and Expression of mRNA and Proteins
1.4.1 Cellular Response to Oxidative Stress and qPCR
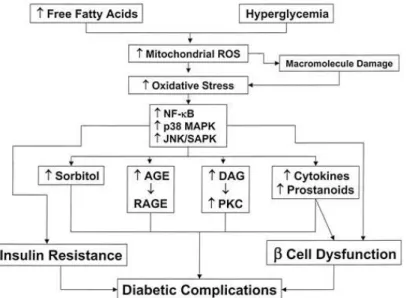
10
macrovascular damage characteristic of diabetes. This occurs when stress-sensitive pathways are activated, notably the nuclear factor kappa-light-chain-enhancer of activated B cells (NF-κB) pathway. ROS and inflammatory cytokine interleukin-6 (IL-6) bind their extracellular receptors, initiating a signaling cascade which activates NF-κB. When activated, NF-κB translocates into the nucleus and acts as a transcription factor for inflammatory cytokines like IL-6 and CD36 and sorbitol, which in turn increases ROS generation and produces AGEs. Figure 3 depicts NF-κB and connected pathways, including mitogen-activated protein kinase (MAPK) and Janus kinase/signal transducers and activator of transcription (JAK/STAT) pathways. These increase insulin resistance and Beta cell dysfunction, the systemic metabolic implications of diabetes. They also trigger endothelial dysfunction in the forms of chronic vasoconstriction, arterial stiffening, and development of atherosclerosis [33].
Figure 1.5: Pathways Involved in Hyperglycemia-Induced Endothelial Damage. Many pathways interact to initiate diabetic macrovascular disease. Both targets for gene expression analysis are
11
the same pathway. This gives IL-6 both autocrine feedback to the same cell, upregulating soluble IL-6 production and further increasing mRNA abundance therein [34], and paracrine feedback to nearby cells, which creates signal amplification in localized tissues. Increased IL-6 activity with increased extracellular glucose concentration therefore could represent one step toward a
successful model of diabetic macrovascular disease.
Cluster of Differentiation 36 (CD36) is a cell surface scavenger receptor and has been shown to increase production of ROS and smooth muscle cell endocytosis of oxidized LDL, a building block of atherosclerotic plaques [35]. Mechanistically, CD36 binds its receptor and triggers the PPAR-γ pathway [36]. This pathway boosts production of CD36 and fatty streak accumulation in vivo. Increasing CD36 expression correlated with elevated glucose
concentration is therefore another potential accomplishment in designing a BVM with diabetic vascular disease [31]. After identifying the key pathways promoted by a high glucose
environment, determining a means of measurement would be necessary to reveal how closely BVMs in these conditions replicate human blood vessels undergoing disease processes. 1.4.1.1 Reverse-Transcription Quantitative Polymerase Chain Reaction (RT-qPCR)
12
place on the template strand, which creates a small double-stranded section. This allows for extremely targeted replication of a specific DNA fragment. Under engineered conditions, DNA Polymerase replicates the DNA exponentially over repeated cycles of denaturation, annealing, and extension.
Quantitative PCR (qPCR) uses the same enzymes and principles as traditional PCR but adds a fluorescent reporter molecule, which emits light proportionally to the number of double-stranded DNA molecules present during any given cycle of PCR. qPCR instruments analyze and report fluorescence during each successive cycle, and due to the programmable temporal scale of PCR, allow for back-calculation of starting copy number for each sample. Exponential
amplification of target sequences allows for differentiation between relatively similar starting copy numbers, offering accurate measurements of relative abundance of specific gene sequences between samples.
Reverse transcription (RT) is an enzymatic reaction which uses Reverse Transcriptase to transcribe complementary DNA (cDNA) from RNA. Within a cell, RNA transmits
13 1.4.1.2 Genes of Interest
Due to the granularity of the differences in relative mRNA abundance elucidated by RT-qPCR across treatment groups, genes must be selected to accurately represent changes in cell behavior. The genes CD36 and IL-6, the functions of which are described in detail above, were chosen for study through RT-qPCR in the hopes of capturing the acute endothelial cell response to increased extracellular glucose.
1.4.1.3 Reference Genes
To accurately compare levels of mRNA expression across various samples,
concentrations of nucleic acid must be identical. This is approximated as closely as possible by measuring RNA concentration before reverse transcription to cDNA, but to further control for variability, samples are also assessed for mRNA abundance of genes which should not be affected by increasing extracellular glucose. Three reference genes are evaluated in this thesis. Beta-actin (ACTB)
ACTB encodes for one of two cytoskeletal actin proteins [37]. All human cells express ACTB similarly and cytoskeletal function is not known to be affected by extracellular glucose, making ACTB a suitable reference gene with which to normalize qPCR results.
Beta-2 microglobulin (B2M)
14
Hypoxanthine-guanine phosphoribosyltransferase (HPRT1)
HPRT1 encodes for protein HGPRT which is a catalytic enzyme involved in synthesizing purine nucleotides, adenine and guanine [39]. Nucleotides are required for translation and
transcription of genetic material, making HPRT1 essential to all human cells. 1.4.2 Reactive Oxygen Species and Fluorescent Microscopy
To complement qPCR-based gene expression analysis, fluorescent staining for cell viability and ROS expression can be analyzed across glucose treatment groups. Cell viability gives a general estimation of how well cells are surviving and replicating [40]. Extracellular glucose interferes with cell survival by upregulating mitochondrial production of ROS, signaling apoptosis via the transcription factor Sp1 [27, 28]. Cell death due to hyperglycemia is a major component of endothelial dysfunction and the pathology of diabetic macrovascular disease [43] so visualizing and quantifying cell viability offers insight into progression of high glucose-induced oxidative stress pathways. Decreasing cell viability by approximately 12% with increasing glucose concentrations contributes to a physiologically relevant model [27, 30]. 1.5 Summary and Aims of this Thesis
In progression toward a tissue engineered blood vessel mimic system suitable for testing devices intended to treat diabetic macrovascular disease, this thesis pursued the following specific aims:
Aim 1: To identify genetic corollaries that indicate increased oxidative stress responses in endothelial cells, and to determine a method by which to study specific corollaries in gene expression.
15
selection process. Data analysis methods for RT-qPCR make use of reference genes that remain constant across treatment groups. Determination of the suitability of those reference genes as well as comparisons between mRNA expression of genes of interest depends heavily on the methodology used for data analysis. Principles of and popular approaches to data analysis are also discussed in Chapter 2.
Aim 2: To evaluate endothelial cell expression over time for the markers CD36 and IL-6 in titered glycemic conditions representative of healthy, prediabetic, and diabetic individuals.
Based on data analysis protocols and genes of interest determined in Chapter 2, an examination of gene expression in Human Umbilical Vein Endothelial Cells (HUVECs) treated with extracellular glucose concentrations representative of diabetic progression over seven and fourteen-day timepoints was conducted. Results of these experiments are presented and
discussed in Chapter 3.
Aim 3: To assess effect of elevated glucose over time on in vitro endothelial cell viability and reactive oxygen species (ROS) production at titered glucose concentrations representative of healthy, prediabetic, and diabetic conditions.
16
2 DETERMINING GENES OF INTEREST AND OPTIMIZING QPCR DATA ANALYSIS
2.1: Introduction
Tissue engineered models are inherently imperfect; it is impossible to capture a complex disease process in a model disconnected from a living organism. Measuring this inaccuracy proves to be a difficult task in itself, as there are dozens of cell types with hundreds of genes with known involvement in development of atherosclerosis and diabetic macrovascular disease [45]. Gene expression analysis is a powerful tool for evaluating cellular responses, granted that the genes analyzed accurately represent those responses, and that data is analyzed properly. Gene selection involves reviewing literature to identify prominent pathways and choosing targets that have established response patterns in vivo in diabetic patients. Data analysis depends on thorough experimental controls and appropriate comparisons, as spurious conclusions can emerge when data is mishandled. This chapter describes preliminary decisions and experiments necessary to compare the elevated glucose BVM model to the diabetic macrovascular disease state.
2.2: Gene Selection and Primer Acquisition
A process as complex as the development of diabetic macrovascular disease involves dozens of individual genes coordinating responses to varying stimuli [35]. Known oxidative stress pathways involve multiple points of origin and dozens of potential genetic targets of analysis.
17
endothelial dysfunction present in diabetic macrovascular disease [7]. PLA2G7 or phospholipase A2 converts circulating phospholipids to arachidonic acid which is cleaved by COX2 or cyclo-oxygenase-2 into prostaglandin H2 [38–40]. The presence of COX2 rather than COX1, a functionally similar molecule, is correlated with hyperglycemia-induced inflammation [50]. Inducible nitric oxide synthase (iNOS) gene variants are associated with poorer clinical outcomes in Type 2 diabetic patients [52] and animal models correlate increased iNOS
expression with endothelial dysfunction [53]. Finally, PPARγ is a master regulator of fatty acid uptake and is implicated in development of atherosclerosis [54]. Genes that were considered as experimental targets for this thesis are summarized in Table 2.1.
Table 2.1: Initial Genes of Interest
Gene† Function Pathway Ref.
CD36 Binds oxLDL and AGE-modified proteins PPARγ [31]
CD68 Correlated with insulin sensitivity and IL-6 secretion NFκB [46] COX2 Proinflammatory, associated with Type 2 Diabetes AA‡ [50]
iNOS Oxidative stress, NO production MAPK [53]
IL-1A Inflammatory cytokine NFκB, MAPK [47]
IL-6 Immunoregulation, glucose metabolism JNK/STAT [48]
PLA2G7 Promotes oxLDL formation, plaque instability AA/MAPK [49] PPARγ Glucose metabolism, fatty acid uptake, master regulator PPARγ [55] †HGNC official gene names ‡ Arachidonic acid pathway
18
all 8 genes and purchasing information for all qPCR analyses are provided in Appendix A and will be described below.
2.2.1: Initial Primer Design
Multiple primer sequences were designed and tested for each of the eight preliminary gene targets. Sequences were acquired from the NCBI gene sequence database GenBank and primers were designed using the IDT PrimerQuest tool (idtdna.com/primerquest) and the NCBI Primer BLAST tool (https://www.ncbi.nlm.nih.gov/tools/primer-blast).
To summarize the process, sequences were searched for in the GenBank Homo sapiens mRNA database by HGNC name. Sequences were then entered into PrimerQuest and custom design parameters were chosen. Primer size was limited to 18-22 nucleotides to encourage binding only onto genes of interest. Primer melting temperature, Tm, was limited to 59-61°C to facilitate evaluation of multiple primer sets using the same qPCR settings. Amplicon size was limited to 180-220 bp to equalize annealing times across PCR products and also facilitate evaluation of multiple genes using the same qPCR settings. PrimerQuest then generated five ranked potential primer sets which were copied to Primer BLAST to check for homology with non-target genes. Primer BLAST tested inputted sequences against all consensus mRNA
sequences and primers were deemed acceptable when only target genes were returned. This step ensured only the gene of interest was amplified. Once the primers were confirmed to have no homologs, the highest-ranked primer sets were selected and ordered from the PrimerQuest tool. A detailed protocol for primer design, ordering, and selection can be found in Appendix B.
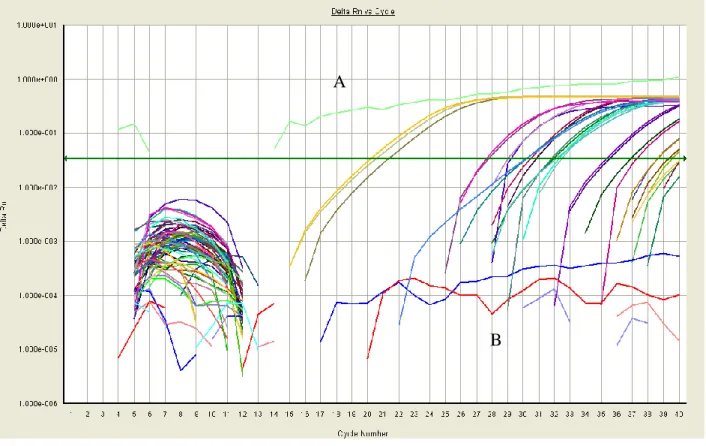
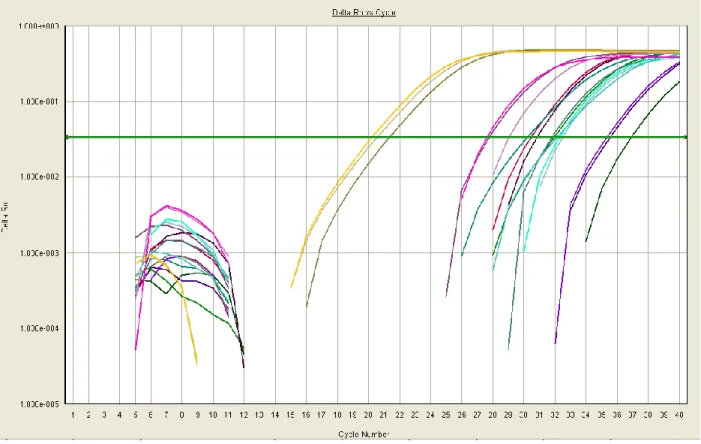
Figure 2.2 shows Delta Rn vs Cycle Number for one or two custom primer sets for each of the eight preliminary genes of interest, totaling 14 sets. Delta Rn is the derivative of
19
failed to amplify, demonstrated by lines that never crossed the horizontal threshold line through the linear amplification region (“B”). Some reactions, including one shown in light green in Figure 2.1 (“A”), had irregular amplification patterns that suggest the formation of unwanted PCR products.
Irregular replication and lack of replication in many wells demonstrated the faults of these primers. Many amplification curves intersected, implying unequal reaction efficiency across wells.
Figure 2.1: Amplification Plot of All Initial Primers. Each line represents one individual qPCR
sample. The x-axis represents cycle number, or progress of the qPCR, while Delta Rn on the
y-axis represents change in fluorescence intensity. The Delta Rn value is the derivative of
fluorescence intensity. Sample A shows irregular replication while Samples in Region B failed to
replicate.
A
20
2.2.2 Methods: qPCR and Visual Analysis for Primer Quality
As described briefly in Chapter 1, qPCR measures relative expression of genes across samples by repeatedly separating and replicating target strands. Primers obtained for each gene (Appendix A), template cDNA, DNA polymerase, unpaired nucleotides (dNTPs), and enhancers were combined for each reaction into well plates. Well plates were placed in a thermocycler with qPCR functionality. To begin qPCR, samples were heated to 95° C to denature, or separate, strands of DNA. Samples were then cooled to 60°C to allow primers to bind to their
complementary sequences, at which point DNA polymerase extended to replicate the template strand. Intercalating dye molecules fit between base pairs of DNA as strands anneal and extend, with the amount of intercalated dye being proportional to the amount of DNA present. The thermocycler then measured fluorescence of intercalating dye, marking the completion of one cycle of the reaction. Following completion of forty cycles, a dissociation step tracked
fluorescence as temperature gradually increased. Temperature at which PCR products dissociate is determined by identity, so all products which dissociated at approximately the same
temperature were assumed to be equivalent. A complete protocol for preparing and running qPCR is available in Appendix C.
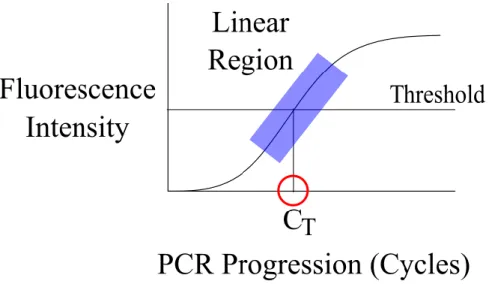
During qPCR, measured fluorescence in each well was reported by the thermocycler during each reaction cycle. Amplification curves were generated from these measurements and facilitate comparison of reactions. As cycles progressed, fluorescence increased linearly before reaching a plateau as available nucleotides were depleted. In order to compare relative
21
threshold is known as the CT, or “cycles to threshold,” value. The CT value of each sample is the basis for comparing relative abundance. Figure 2.2 depicts an amplification plot and labels its linear region, threshold, and CT value.
Primers were tested by RT-qPCR with cDNA derived from Human Umbilical Vein Endothelial Cells (HUVECs) (Lonza, C2519A) at passage 5 cultured in corresponding cell culture media (Lonza, EGM Plus) to 80% confluence in T-75’s and passaged at 1:3 ratios throughout culture. RNA isolation and cDNA synthesis were performed before qPCR and generation of corresponding amplification plots. Amplification curves for each set of primers were evaluated visually for similarity of amplification across replicates. Amplification curves which intersected in the linear region demonstrated unequal reaction efficiencies and were rejected. Amplification curves which lacked the expected biconcave shape were also rejected, including those which never crossed the threshold line.
22 2.2.3 Preliminary Primer Verification
During primer selection, primers that failed visual evaluation were rejected. The five sets of custom primers that successfully replicated are presented in Figure 2.3 as a demonstration of primer selection. Genes represented are CD68, IL-1A, PPARγ, and PTGS2 (two successful sets). CD36 and IL-6 primer sets failed to replicate.
This was only the first validation step required to reliably make conclusions from custom primers, as variability of replication efficiency is evident in Figure 2.3 where amplification curves intersect. A complete protocol for primer selection is available in Appendix B.
Figure 2.3: Amplification Plots of Successful Initial Primers. Isolated here are only those
primers which produced three CT values approximately equal to one another. As in Figure 2.2,
the x-axis represents PCR progression and the y-axis represents change in fluorescence
23 2.2.4 Preverified Primers
Although the primers in Figure 2.3 were appropriate for further validation, they were not ultimately used in this thesis. Failure to replicate CD36 and IL-6 genes was especially
problematic as these genes are particularly well-studied compared to other genes of interest. Owing to the recurring associations of CD36 and Il-6 with diabetes and endothelial dysfunction, these two gene targets were necessary to consider given the aims of this thesis. CD36 mRNA expression was previously documented to increase in response to elevated glucose
concentrations in microvascular endothelial cells and this upregulation was demonstrated to mediate oxidative stress [31]. In a genome-wide study, CD36 variants were associated with changes in lipoprotein diameter in response to fenofibrate, an insulin resistance treatment, indicating CD36 may be related to insulin resistance through lipoprotein pathways associated with atherosclerosis [56]. A CD36 knockout mouse model (mice without the gene for CD36) demonstrated decreased inflammation and increased insulin signaling compared to wild-type mice [57]. Plasma IL-6 concentration and advanced glycation end products were both shown to have increased in diabetic patients compared to non-diabetics [58] and IL-6 was recently shown to be involved with procoagulant molecule thrombin in the transition from acute to chronic inflammation [34]. Acquiring primers to evaluate expression of CD36 and IL-6 required repetition of custom primer design or pursuit of another solution.
Due to the cost of repeating attempts at primer design and verification, and in an effort to streamline data acquisition, pre-verified primers were purchased for CD36 and IL-6. The
24
(IDT DNA, Coralville, IA) arrived having been tested to ensure that the provided set of forward and reverse primers bound complementary DNA (cDNA) at the location of the gene of interest and reliably produced replicable qPCR results. This eliminated the need for primer verification and reduced the amount of cDNA derived from valuable human cells necessary to test primers. Sequences of PrimeTime primers (for CD36, IL-6, and reference genes described below) used for all subsequent experiments are available in Appendix A.
Predesigned primers were also used to measure relative expression of reference genes. This decision was made due to the use of preverified primers for genes of interest, as well as to facilitate comparison with these experiments in future research conducted on the diabetic macrovascular disease BVM model. Three genes, whose functions were previously discussed in Chapter 1, were considered as reference genes for data analysis. The purpose of reference genes is to normalize activity of genes of interest to a gene that maintains consistent expression across treatment groups. The three reference genes analyzed by qPCR were B2M, ACTB, and HPRT1.
25
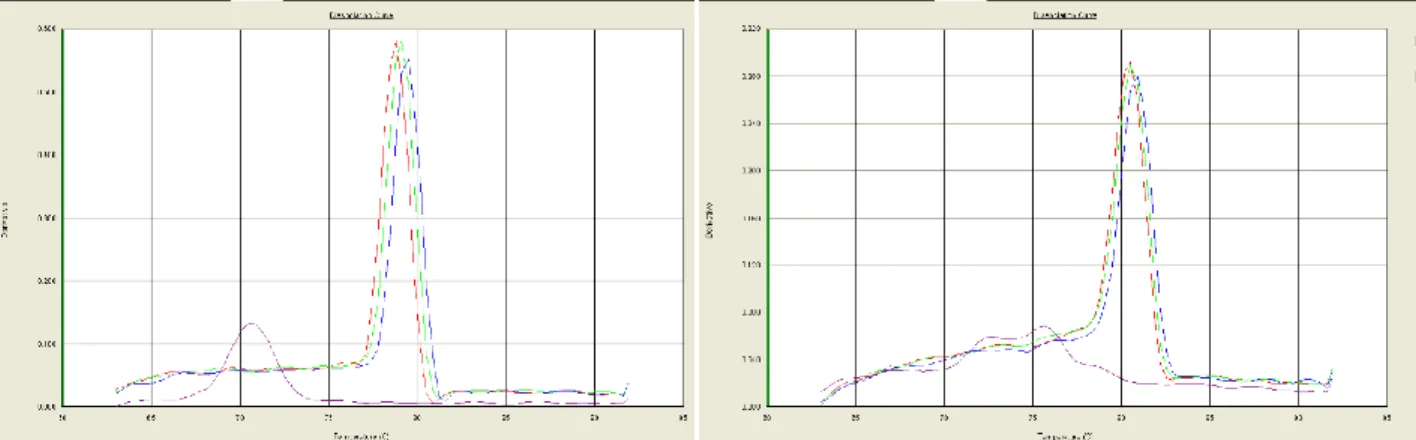
As previously mentioned, a dissociation step occurred following qPCR cycles where temperature was gradually increased, and fluorescence was recorded. When PCR products were identical, they all dissociated at the same temperature, emitting fluorescence. Multiple peaks on a plot of fluorescence intensity against dissociation temperature therefore demonstrated formation of more than one qPCR product. Due to increased variability in ACTB amplification curves, consultation of dissociation curves was warranted. Dissociation curves for ACTB primers had a peak in the non-template control well visible at a much lower temperature than the sample wells. This demonstrated that primers had bound together, referred to as primer-dimer formation. Figure 2.5 compares dissociation curves from ACTB samples to those from IL-6, which does not display primer-dimer formation.
26
Figure 2.5: Dissociation curves of (A) ACTB and (B) IL-6. ACTB has a peak in the non-template control sample, demonstrating primer-dimer formation.
Eliminating ACTB due to primer-dimer formation determined two target genes, IL-6 and CD36, and two reference genes, B2M and HPRT1. These primers were used in all subsequent analysis throughout this thesis. With these genes established and primers validated, data could be collected. Data from qPCR required processing before interpretation, however, with multiple data analysis methods to choose from. The following section offers comparison of data analysis methods and discusses the selection of the most relevant method for this thesis.
2.3 Data Analysis Methods
Differences in mRNA abundance can be compared using two broad approaches: absolute or relative quantification. Both approaches were used in this thesis. Absolute quantification relies on dilution assays to determine a standard curve for each reaction. In this thesis, absolute
27 2.3.1 Preliminary Dataset Acquisition
Throughout this chapter, data from one experiment of the many presented in detail later in this thesis were utilized to compare appropriateness of various data analysis methods. Briefly, these data came from Human Umbilical Vein Endothelial Cells (HUVECs) (Lonza, C2519A) cultured in EGM-Plus media (Lonza, C5035) treated with supplemental glucose (VWR, 97062-880) for seven days. Three glucose concentrations were compared: Basal (5.5mM), Moderate (10.5 mM), and High (25.5 mM) treatment groups. RNA and cDNA were isolated and
synthesized respectively before qPCR was used to determine a Cycles to Threshold (CT) value for each sample. (These methods are described in more detail in the following chapter.) 2.3.2 Absolute Quantification
Absolute and relative quantification approaches were utilized in combination in this thesis in order to compare mRNA expression. Efficiency values (E) were first determined by absolute quantification before relative quantification methods were compared with and without the assumption of perfect efficiency. Serial dilutions of cDNA from Basal treatment groups were used as templates in otherwise identical reactions. CT values were plotted against dilution factor and a line of best fit was determined where the slope of this line is equal to −1
log 𝐸. E is the
efficiency of the qPCR reaction, or how many copies of a gene were made from each template strand during each cycle. A complete protocol for qPCR for absolute quantification and efficiency calculation is available in Appendix C.
2.3.3 Relative Quantification
28
to an untreated condition, 2-ΔCT comparisons are appropriate. The 2-ΔCT comparison can also demonstrate how multiple genes relate to a stable group of reference genes. With a stable set of reference genes and an untreated condition, fold change or 2-ΔΔCT comparisons are appropriate. These fold change comparisons are most physiologically relevant [45, 46]. Table 2.2 summarizes relative quantification data analysis methods and the assumptions required by each method. These methods are discussed in more detail in the following sections.
Table 2.2: Relative Quantification Methods
Method Assumptions
2-CT E=2
2-ΔCT (treatment-control) E=2
2-ΔCT (target-reference) E=2, stable reference
2-ΔΔCT E=2, stable reference
2.3.3.1 The 2-CT Method
The most direct comparison of CT value is facilitated by 2-CT assessment. This method assumes ideal PCR efficiency—that during every cycle, two copies of each template strand are made and represent treatment groups as individual data points rather than
comparisons. This is less likely to show spurious trends in small sample sizes than comparative methods [61]. 2-CT comparisons are especially relevant to determination of reference gene expression across treatment groups [60]. If 2-CT values differ significantly, reference genes may be unsuited for use as reference genes in later analysis. 2-CT evaluation is the most direct method of assessing relative mRNA abundance.
2.3.3.2 The 2-ΔCT Method
29
∆𝐶𝑇 = 𝐶𝑇(𝑡𝑟𝑒𝑎𝑡𝑚𝑒𝑛𝑡) − 𝐶𝑇(𝑏𝑎𝑠𝑎𝑙).
Comparison between expression of the same gene across a treated and untreated group with the same starting cDNA amount as determined by UV spectroscopy is best represented by the 2-ΔCT value [61]. This evaluation was used to determine influence of a treatment on gene expression. 2.3.3.3 The 2-ΔΔCT Method
If consistent reference gene expression had been validated, comparison of 2-ΔΔCT values would describe fold change and facilitate expression comparisons across genes (e.g. “Gene X is upregulated 4-fold while Gene Y is only upregulated 2-fold”). 2-ΔΔCT value was calculated from expression of a target gene (GOI) and the expression of a reference gene [62] (REF) using the following equation:
∆∆𝐶𝑇 = { (𝐶𝑇(𝑡𝑟𝑒𝑎𝑡𝑚𝑒𝑛𝑡, 𝐺𝑂𝐼) − 𝐶𝑇(𝑡𝑟𝑒𝑎𝑡𝑚𝑒𝑛𝑡, 𝑅𝐸𝐹)) − (𝐶𝑇(𝑏𝑎𝑠𝑎𝑙, 𝐺𝑂𝐼)
− 𝐶𝑇(𝑏𝑎𝑠𝑎𝑙, 𝑅𝐸𝐹)) }
Complete protocols for all relative quantification methods are available in Appendix D. 2.4 Data Analysis Results
2.4.1 Absolute Quantification
30
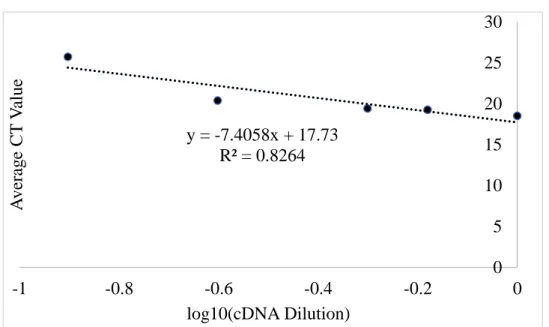
Figure 2.6 includes the amplification plot of a standard curve assay for B2M. This standard curve is analyzed in Figure 2.7 which plots cDNA dilution factor logarithmically against average CT value. Figure 2.7 graphs average CT versus cDNA dilution factor, where the slope of this line is equal to −1
log 𝐸 and E is the efficiency of the qPCR reaction.
Figure 2.6: Standard Curve Amplification Plots: Change in fluorescence intensity over time
(Delta Rn) versus progression of qPCR (Cycle Number) for (A) IL-6 (B) CD36 (C) B2M and (D)
31
Genes of interest and their determined reaction efficiency by absolute quantification are listed in Table 2.3. Raw data and standard curves for CD36, HPRT1, and IL-6 are available in Appendix M.
Table 2.3: Measured Efficiencies by Gene from Standard Curve Analysis
Testing the primers for replication efficiency revealed that none were within the ideal range of 1.8 to 2.0 [60]. These measurements prevented assumption of perfect efficiency, so comparisons using these gene-specific E values were utilized throughout this thesis rather than following convention to assume E=2.
Gene Slope CT vs. cDNA Dilution Factor Efficiency (E)
B2M -7.4058 1.364675
CD36 -10.493 1.245391
HPRT1 -7.0971 1.383256
IL6 -10.867 1.236009
Figure 2.7: Representative Standard Curve Analysis. B2M cDNA dilution factor versus average CT value. Slope of the trendline is used to determine qPCR efficiency.
y = -7.4058x + 17.73 R² = 0.8264
0 5 10 15 20 25 30
-1 -0.8 -0.6 -0.4 -0.2 0
A
ve
ra
g
e
CT
V
alue
32 2.4.2 Relative Quantification
2.4.2.1 E-CT Results
E-CT comparisons demonstrated that B2M was an unsuitable reference gene due to
33
A B
C D
Figure 2.8: E-CT Analysis. (A) B2M expression decreases with Moderate treatment and increases
with High glucose treatment. (B) CD36 expression remains consistent across treatments. (C)
HPRT1 expression decreases with Moderate treatment. (D) IL-6 expression increases with High
glucose treatment. All values are in arbitrary units presented as mean ± SEM. 0 0.001 0.002 0.003 0.004 0.005 0.006 0.007
Basal Moderate High
E^ -Δ CT B2M 0 0.0001 0.0002 0.0003 0.0004 0.0005 0.0006 0.0007 0.0008 0.0009 0.001
Basal Moderate High
E^ -Δ CT CD36 0 0.0001 0.0002 0.0003 0.0004 0.0005 0.0006 0.0007
Basal Moderate High
E^ -Δ CT HPRT1 0 0.0005 0.001 0.0015 0.002 0.0025 0.003 0.0035 0.004 0.0045 0.005
Basal Moderate High
E^
-Δ
CT
34
A lack of stable reference genes evident at this point prevented relative quantification methods based on normalization to a reference, namely E-ΔCT (target-reference) and E-ΔΔCT comparisons. This encompasses all comparisons across multiple genes. E-ΔCT (treated-untreated) comparisons between control and treated conditions within the same gene remained valid and appear in the following section.
2.4.2.2 E-ΔCT Results
35
A B
C D
Figure 2.9: E-ΔCT Analysis of 7-Day Data. (A) B2M (B) CD36 (C) HPRT1 and (D) IL-6
expression all increased in High glucose condition compared to Moderate glucose condition
36 2.4.2.3 E-ΔΔC
T Results
37
A B
C D
E F
Figure 2.10: 2-ΔΔCT Analysis of 7-Day Data. Influence of reference gene on results of
comparative CT method. Expression of genes (A, C, E) relative to HPRT1 expression and (B, D,
F) relative to B2M expression. All values are in arbitrary units presented as mean ± SEM.
38
Using the standard 2-ΔΔCT analysis relative to B2M resulted in conflicting IL-6 expression patterns compared to 2-ΔΔCT analysis relative to HPRT1. This demonstrated that at least one reference gene had inconsistent expression [63]. The stability of common reference genes B2M and HPRT1 across elevated glucose treatments cannot be assumed, although such an assumption may seem validated by their use as reference genes in literature [37]. The importance of
analyzing reference genes before relying on their expression for normalization is therefore paramount. Because of evaluation and normalization of RNA concentration before cDNA synthesis, it remained valid to perform 2-ΔCT comparisons from untreated to treated conditions [52, 53].
2.4.3 Probe-Quencher Primers
39
This addition increased the likelihood of unwanted PCR product formation as probe strands may have interfered with ideal replication. To validate results gathered with both fluorescent probes and SYBR intercalating dye, preliminary experiments performed for data analysis method selection were repeated without SYBR. Trials instead recorded fluorescence from the included probes.
Results from probe-only reactions displayed large variability and did not correspond with trends visible in samples evaluated using SYBR reporting. Many wells failed to report any fluorescence and noisy measurements required exclusion of additional wells, increasing error values. B2M, HPRT1, and IL-6 showed no meaningful changes in relative abundance with varying glucose concentration. CD36 showed higher relative abundance at the moderate concentration compared to basal but no change at the high glucose concentration relative to basal. Figure 2.12 depicts relative expression of B2M, CD36, HPRT1, and IL-6 as measured by probe and quencher reporting.
40
Results from probe-quencher trials displayed massive variability within treatment groups. No trends were replicated from SYBR green results to probe-quencher results, meaning that these experiments failed to validate results visible with SYBR fluorescence. Inclusion of probes likely reduced reaction efficiency substantially, consistent with measurements by absolute quantification. This necessitated use of measured E values rather than assuming perfect efficiency.
2.4.4 Data Analysis Summary
Measured efficiency values can be substituted for assumed E in relative quantification methods which do not compare targets to reference genes [59]. E-ΔCT values, where ΔCT = CT
0 10000 20000 30000 40000 50000
n=4 n=2 n=3
Basal Moderate High
R el at iv e A bundanc e (2^C T ) [A rbi tr ar y U ni ts] B2M 0 10000 20000 30000 40000 50000 60000 70000
n=4 n=3 n=3
Basal Moderate High
R el at iv e A bundanc e (2^C T ) [A rbi tr ar y U ni ts] CD36 0 1000 2000 3000 4000 5000
n=3 n=3 n=4
Basal Moderate High
R el at iv e A bundanc e (2^C T ) [A rbi tr ar y U ni ts] HPRT1 0 1000 2000 3000 4000 5000
n=3 n=4 n=3
Basal Moderate High
R el at iv e A bundanc e (2^C T ) [A rbi tr ar y U ni ts] IL-6
41
(treatment) – CT (control), compare effects of various treatments on expression of each gene. This method was used throughout subsequent experiments.
2.4 Discussion
The goal of this first aim was to establish targets for gene expression and to select a method for qPCR data analysis based on preliminary data. Genes of interest IL-6 and CD-36 were selected from genome-wide association studies [33–35] to represent relevant pathway activity. Reaction efficiency (E) was determined by absolute quantification for each gene. Potential reference genes analyzed by 2-CT demonstrated too much variability across treatment groups for use as an internal reference. This variability prohibits use of the most powerful comparative CT method, 2-ΔΔCT comparison. For this reason, qPCR data in subsequent experiments had to be analyzed by comparing E-ΔCT values for each gene between treatment groups and basal groups.
42
standalone primers provide inadequate protection from UV rays. Had the probes been protected from light during storage, results likely would replicate those seen with SYBR reporting.
Lack of consistent B2M expression was unanticipated, but increased serum B2M levels are correlated with mortality in diabetic nephropathy [69] which may be related to increased B2M mRNA abundance in high glucose conditions. HPRT1 is commonly cited as a potential reference gene for investigations of elevated glucose. [43, 51]. Inconsistency in expression of this gene may therefore be due to differences in RNA quality across treatment groups.
This study was limited by the lack of stable reference genes, meaning fold change conclusions were impossible. Utilizing the E-ΔCT method maximizes the conclusions we can make without stable reference genes, but determination of a group of stable reference genes is a priority for future studies.
This aim contributes specific methods for design and selection of primers for qPCR analysis as well as a variety of data analysis protocols and the experiments for which each are valid. Genes of interest CD36 and IL-6 were selected along with reference genes B2M and HPRT1. In light of limitations due to improper primer ordering and lack of consistent reference gene expression, this aim selected E-ΔCT (treatment-control) values for comparison of the effects of different treatments on CD36 and IL-6 expression. With this foundation in place, data
43
3 EVALUATING GENE EXPRESSION IN RESPONSE TO INCREASED EXTRACELLULAR GLUCOSE
3.1 Introduction
The previous chapter identified genes of interest and determined the most appropriate data analysis method for use with probe-quencher primers and without consistent reference gene expression. With this foundation, effects of glucose concentration and treatment duration were investigated. As discussed in Chapter 1, glucose concentrations (5.5 mM, 10.5 mM, and 25.5 mM) were selected to represent the progression of diabetic macrovascular disease. In an effort to represent disease evolution, effect of treatment duration on expression of CD36 and IL-6 was evaluated by qPCR. Elevation in relative expression of CD36 and IL-6 under elevated glucose at these timepoints would be consistent with the acute cellular response to hyperglycemia discussed in Chapter 1 [5, 24, 59]. This Chapter encompasses Aim 2 of this thesis: to evaluate acute
changes in gene expression, specifically of IL-6 and CD36 in HUVECs, due to increased extracellular glucose.
3.2 Methods
44 3.2.1 Cell Culture
Human Umbilical Vein Endothelial Cells were obtained from Lonza Walkersville Inc. (Catalog number 2519A, LOT 0000470896) and cultured in EGM-2 Growth Media (Catalog number 3162), also from Lonza. Due to product shortages, EGM-Plus Growth Media (Catalog number 5035) with supplemental L-Glutamine (VWR, Catalog number 16777-162) at a final concentration of 10 mM was substituted when EGM-2 Growth Media was unavailable. Cells were cultured at 5% CO2(manually measured daily with Fyrite Gas Analyzer), 80% relative humidity and 37° C. Cell culture media was changed every 48-72 hours throughout culture and all experiments were conducted on cells subcultured from the same source vial at passage 5. Culturing took place in T-75 flasks passaged at a 1:3 ratio and were 80-100% confluent at the time of RNA isolation, yielding approximately 6-8 million cells.
Induction of high glucose conditions consisted of adding 80 mM sterile glucose solution (VWR Catalog number 97062-880) to final concentrations of 10.5 mM and 25.5 mM glucose, as described in Chapter 1. Detailed protocols for cell thawing, passing, feeding, and freezing can be found in Appendix E.
3.2.2 RNA Isolation
In order to analyze relative expression of certain genes, total RNA was isolated from cells using RNEasy Mini Kit (Qiagen Catalog number 74106). Once T-75’s reached 80-100%
confluence, 3 mL trypsin (Sigma, T3924) cleaved cells from culture vessels. Centrifugation and aspiration of trypsin and cell media was performed before cells were resuspended in PBS (ThermoFisher, 14190359) and flash-frozen in liquid nitrogen.
45
(QIAshredder, Qiagen) to further homogenize cell lysate. Lysate was further separated by centrifugation through silica spin columns. Silica immobilized nucleic acids while allowing lipids, proteins, and cell fragments to pass through. RNA remained bound to silica through two washing steps which removed DNA and other residual contaminants by first modifying the salt concentration to make DNA insoluble and second washing with ethanol to remove salt. RNA was released from silica in Milli-Q pure water due to intermolecular interactions of RNA molecules and water molecules.
RNA was then assessed for purity by ultraviolet-visible (UV-Vis) spectrophotometry using a NanoDrop 2000 (ThermoFisher). This device measures the absorbance of isolated RNA samples at 260 nm to determine concentration using the Beer-Lambert equation and measures absorbance at 280 nm to determine purity by comparing absorbance at 260 nm over absorbance at 280 nm. RNA with a 260/280 ratio of 1.95-2.05 can used to transcribe cDNA. Detailed protocols for RNA Isolation and RNA Purity Assessment can be found in Appendix F. 3.2.3 cDNA Synthesis
Following isolation, RNA was transcribed into complementary DNA (cDNA) by reverse transcription using iScript cDNA Synthesis Kit (BIO-RAD, Catalog number 1708890). The kit uses both single-stranded sequences of deoxythymine nucleotides (oligo-dT) and random sequences of six nucleotides (random hexamer) primers to bind template strands of RNA. Reverse transcriptase binds double-stranded primed segments of RNA and synthesizes cDNA which is subsequently amplified during qPCR. Detailed protocols for cDNA synthesis can be found in Appendix G.
46
with primers and should not be included in the future. qPCR proceeded according to methods described in the previous chapter. Briefly, reaction mixes were cyclically heated and cooled in a thermocycler equipped to record fluorescence of SYBR green intercalating dye. Fluorescence increased predictably over 40 cycles of qPCR, facilitating determination of a CT value
representative of starting mRNA concentration. CT values were compared by E-ΔCT or “Measured Efficiency” as described in the previous chapter. To demonstrate the importance of measuring efficiency by absolute quantification, comparisons using the prevalent assumption of perfect efficiency (E=2) or “Assumed Efficiency” were also conducted.
Gene expression was compared by qPCR for genes of interest CD36 and IL-6 as well as reference genes B2M and HPRT1. Due to inconsistent reference gene expression across
treatment groups, comparisons to reference gene expression were not conducted. Multiple experiments were conducted, each evaluating HUVEC responses to three concentrations of glucose in cell culture media. Basal (5.5 mM) acted as a control while Moderate (10.5 mM) and High (25.5 mM) concentrations induced varying degrees of elevated glucose conditions. An overview of experimental time points and the number of cell culture flasks evaluated, or
“Independent Trials” as well as replicate qPCR samples, or “Technical Replicates” is provided in Table 3.1. In this table and throughout this chapter, evaluations are listed alphabetically by gene name for convenience.
Differences between groups were assessed by ANOVA of CT values in JMP [72].
47 Table 3.1: Experimental Design for qPCR Experiments
Independent Trials
Technical Replicates
Sample Size (n) Replicates
Evaluated for Each Treatment
7 Day B2M 2 3 6
CD36 3 3 9
HPRT1 3 3 9
IL-6 3 3 9
14 Day B2M 2 3 6
CD36 2 3 6
HPRT1 2 3 6
IL-6 2 3 6
3.3 Results
When evaluated at seven days, relative expression of B2M decreased compared to the basal condition at the moderate glucose concentration while expression increased in the high glucose concentration. CD36 expression remained low and relatively consistent across treatment groups. Relative expression of HPRT1 decreased with moderate glucose treatment and was consistent at the high glucose concentration relative to the basal glucose treatment. Expression of IL-6 showed no change at the moderate glucose concentration and increased at the high glucose concentration (p<0.001). Assumed efficiency values used 𝐸 = 2 while measured efficiency values used efficiencies determined for each gene in Chapter 2, which are repeated below in Table 3.2.
Table 3.2: Measured Efficiency Values from Chapter 2
Gene Efficiency (E)
B2M 1.364675
CD36 1.245391
HPRT1 1.383256
48
Figure 3.1 depicts relative abundance (E-CT) of B2M, CD36, IL-6, HPRT1, and CD36 after seven days of treatment at 5.5 mM (Basal), 10.5 mM (Moderate), or 25.5 mM (High).
Evaluation of relative gene expression at 14 days was consistent with results at seven days. B2M expression increased at the highest glucose concentration as did relative expression of IL-6 (p<0.001). HPRT1 expression was more consistent across treatment groups at fourteen days
Figure 3.1: Relative Abundance Comparisons Between Assumed and Calculated Efficiency
Values after 7 Day Treatment. (A)B2M expression increased at High glucose concentration. (B)
CD36 expression remained consistent across treatment groups. (C) HPRT1 expression remained
consistent across treatment groups. (D) IL-6 expression increased at High glucose
concentration. Data are presented as mean ± SEM. -5 0 5 10 15 20 25 30
n=6 n=6 n=6
Basal Moderate High
R el at iv e A bundanc e (E -Δ CT ) B2M Assumed Efficiency Measured Efficiency -0.5 0 0.5 1 1.5 2
n=9 n=9 n=9
Basal Moderate High
R elative Abunda nc e (E -Δ CT ) CD36 Assumed Efficiency Measured Efficiency -2 -1 0 1 2
n=9 n=9 n=9
Basal Moderate High
R el at iv e A bundanc e (E -Δ CT ) HPRT1 Assumed Efficiency Measured Efficiency -5 0 5 10 15 20 25
n=9 n=9 n=9
Basal Moderate High
49
than seven days. CD36 displayed very low expression and relatively consistent expression across treatment groups. Figure 3.2 shows relative expression of gene targets after 14 days of treatment.
3.4 Discussion
This aim sought to compare gene expression results between basal and elevated glucose conditions at seven and fourteen days. Expression of mRNA for cytokines CD36 and IL-6 was analyzed by qPCR. CD36 expression remained consistent across elevated glucose treatments
-5 0 5 10 15 20 25 30
n=6 n=6 n=6
Basal Moderate High
Re lativ e A b u n d an ce (E -Δ CT ) B2M Assumed Efficiency Measured Efficiency -1 -0.5 0 0.5 1 1.5 2
n=6 n=6 n=6
Basal Moderate High
T it le HPRT1 Assumed Efficiency Measured Efficiency -0.5 0 0.5 1 1.5 2
n=6 n=6 n=6
Basal Moderate High
Re lativ e A b u n d an ce (E -Δ CT ) CD36 Assumed Efficiency Measured Efficiency -5 0 5 10 15 20 25 30 35
n=6 n=6 n=6
Basal Moderate High
Re lativ e A b u n d an ce (E -Δ CT ) IL-6 Assumed Efficiency Measured Efficiency
Figure 3.2: Relative Abundance of Target Genes at 14-day Timepoint. (A) B2M expression
increased with High glucose treatment. (B) CD36 expression was unaffected by glucose
treatment. (C) HPRT1 expression decreased with Moderate glucose treatment but remained
consistent from Basal to High glucose treatment. (D) IL-6 expression increased with High
50
indicating that either treatment intensity or treatment duration may be insufficient to induce CD36 upregulation in HUVECs with high glucose culture. This finding was inconsistent with documented work showing increased CD36 expression with elevated glucose treatment in human microvascular endothelial cells, however these evaluations were performed following 24 hours of treatment [31]. Dose- and duration-dependent PKC upregulation following glucose treatment of HUVECs for 7 and 14 days [73] implies upregulation of both CD36 and IL-6 through
connected pathways [50, 66, 67]. Differential expression of CD36 across various endothelial cell sources is the most likely explanation for low CD36 expression regardless of treatment.
Macrovascular ECs, including HUVECs, have substantially lower CD36 expression than microvascular endothelial cells (MVECs) [76]. HUVECs were characterized as lacking surface CD36 expression [77], suggesting low CD36 mRNA production. This validates low levels of expression detected in this thesis, offering support to these analysis methods. While analysis of CD36 expression in HUVEC under high glucose conditions offers no insight into accuracy of the diabetic macrovascular disease blood vessel mimic model, CD36 expression could be used in the future to evaluate alignment of BVM expression with macrovascular vessel expression.
IL-6 mRNA abundance was found to increase in HUVECs treated with 25.5 mM glucose at 7 and 14 days, which is consistent with gene expression in Type 2 Diabetes [70, 71]. IL-6 upregulation appeared similar in magnitude to upregulation of B2M, however without a
![Figure 1.1: Insulin Resistance Increases with Disease State. Progression of severity of insulin resistance and the associated diagnoses with their associated macrovascular symptoms [5]](https://thumb-us.123doks.com/thumbv2/123dok_us/8225449.2180568/16.918.197.716.353.620/resistance-increases-progression-resistance-associated-diagnoses-associated-macrovascular.webp)
![Figure 1.2: Decreased Event-Free Survival in Diabetic Patients with Vascular Stents [13]](https://thumb-us.123doks.com/thumbv2/123dok_us/8225449.2180568/18.918.119.803.114.536/figure-decreased-event-survival-diabetic-patients-vascular-stents.webp)