Calhoun: The NPS Institutional Archive
Theses and Dissertations Thesis and Dissertation Collection
2016-12
Analysis of the effectiveness of the retire tool
when deciding between HIGH-36 retirement
and blended TSP retirement
Gilreath, Nathan D.
Monterey, California: Naval Postgraduate School http://hdl.handle.net/10945/51702
NAVAL
POSTGRADUATE
SCHOOL
MONTEREY, CALIFORNIA
THESIS
Approved for public release. Distribution is unlimited. ANALYSIS OF THE EFFECTIVENESS OF THE RETIRE
TOOL WHEN DECIDING BETWEEN HIGH-36 RETIREMENT AND BLENDED TSP RETIREMENT
by
Nathan D. Gilreath
December 2016
Thesis Advisor: Juanita M. Rendon
REPORT DOCUMENTATION PAGE Form Approved OMB No. 0704-0188
Public reporting burden for this collection of information is estimated to average 1 hour per response, including the time for reviewing instruction, searching existing data sources, gathering and maintaining the data needed, and completing and reviewing the collection of information. Send comments regarding this burden estimate or any other aspect of this collection of information, including suggestions for reducing this burden, to Washington headquarters Services, Directorate for Information Operations and Reports, 1215 Jefferson Davis Highway, Suite 1204, Arlington, VA 22202-4302, and to the Office of Management and Budget, Paperwork Reduction Project (0704-0188) Washington DC 20503.
1. AGENCY USE ONLY (Leave blank)
2. REPORT DATE December 2016
3. REPORT TYPE AND DATES COVERED
Master’s thesis
4. TITLE AND SUBTITLE
ANALYSIS OF THE EFFECTIVENESS OF THE RETIRE TOOL WHEN DECIDING BETWEEN HIGH-36 RETIREMENT AND BLENDED TSP RETIREMENT
5. FUNDING NUMBERS
6. AUTHOR(S) Nathan D. Gilreath
7. PERFORMING ORGANIZATION NAME(S) AND ADDRESS(ES)
Naval Postgraduate School Monterey, CA 93943-5000
8. PERFORMING
ORGANIZATION REPORT NUMBER
9. SPONSORING /MONITORING AGENCY NAME(S) AND ADDRESS(ES)
N/A
10. SPONSORING / MONITORING AGENCY REPORT NUMBER
11. SUPPLEMENTARY NOTES The views expressed in this thesis are those of the author and do not reflect the official policy or position of the Department of Defense or the U.S. Government. IRB number NPS.2017.0003-IR-EP7-A .
12a. DISTRIBUTION / AVAILABILITY STATEMENT
Approved for public release. Distribution is unlimited.
12b. DISTRIBUTION CODE 13. ABSTRACT (maximum 200 words)
The Department of Defense has enacted military retirement reforms that will change the vested pension system into a hybrid pension and matching Thrift Savings Plan contribution called the Blended Retirement System.
The purpose of this research was to evaluate the effectiveness of a previously developed retirement tool (RETIRE Tool) that allows service members to evaluate and compare the net present values (NPV) of the HIGH-36 retirement system (HIGH-36) and the blended Thrift Savings Plan retirement system (BRS) in order to make an informed retirement decision. The effectiveness of the RETIRE Tool was assessed through a before-and-after survey of military personnel at the Naval Postgraduate School. Service members who have less than 12 years of active service by December 31, 2017 can opt into the BRS between January 1, 2018 and December 31, 2018. The RETIRE Tool provides financial value estimates of the old retirement system compared to the new retirement system.
The research findings show evidence that the RETIRE Tool has a positive net effect on the confidence levels of service members given the choice between HIGH-36 and the BRS. Participants were able to identify which methods of financial education would best assist them with the decision between HIGH-36 and the BRS.
14. SUBJECT TERMS
military retirement, blended retirement, HIGH-36, thrift savings plan, investment risk, retirement taxes, net present value, personal discount rate, retirement risk, annuity, risk tolerance, matching contributions, tsp, retirement reform, time value of money, volatility, pension 15. NUMBER OF PAGES 115 16. PRICE CODE 17. SECURITY CLASSIFICATION OF REPORT Unclassified 18. SECURITY CLASSIFICATION OF THIS PAGE Unclassified 19. SECURITY CLASSIFICATION OF ABSTRACT Unclassified 20. LIMITATION OF ABSTRACT UU
NSN 7540-01-280-5500 Standard Form 298 (Rev. 2-89)
Approved for public release. Distribution is unlimited.
ANALYSIS OF THE EFFECTIVENESS OF THE RETIRE TOOL WHEN DECIDING BETWEEN HIGH-36 RETIREMENT AND BLENDED TSP
RETIREMENT
Nathan D. Gilreath
Captain, United States Marine Corps B.S., The University of Arizona, 2010
Submitted in partial fulfillment of the requirements for the degree of
MASTER OF BUSINESS ADMINISTRATION from the
NAVAL POSTGRADUATE SCHOOL December 2016
Approved by: Juanita M. Rendon
Thesis Advisor
Steven P. Landry Co-Advisor
Don Summers Academic Associate
ABSTRACT
The Department of Defense has enacted military retirement reforms that will change the vested pension system into a hybrid pension and matching Thrift Savings Plan contribution called the Blended Retirement System.
The purpose of this research was to evaluate the effectiveness of a previously developed retirement tool (RETIRE Tool) that allows service members to evaluate and compare the net present values (NPV) of the HIGH-36 retirement system (HIGH-36) and the blended Thrift Savings Plan retirement system (BRS) in order to make an informed retirement decision. The effectiveness of the RETIRE Tool was assessed through a before-and-after survey of military personnel at the Naval Postgraduate School. Service members who have less than 12 years of active service by December 31, 2017 can opt into the BRS between January 1, 2018 and December 31, 2018. The RETIRE Tool provides financial value estimates of the old retirement system compared to the new retirement system.
The research findings show evidence that the RETIRE Tool has a positive net effect on the confidence levels of service members given the choice between HIGH-36 and the BRS. Participants were able to identify which methods of financial education would best assist them with the decision between HIGH-36 and the BRS.
TABLE OF CONTENTS
INTRODUCTION...1 I. A. BACKGROUND ...1 B. RESEARCH PURPOSE ...3 C. RESEARCH QUESTIONS ...3 D. METHODOLOGY ...3 E. IMPORTANCE OF RESEARCH ...4F. BENEFITS AND LIMITATIONS...4
G. ORGANIZATION OF REPORT ...5 H. SUMMARY ...6 LITERATURE REVIEW ...7 II. A. INTRODUCTION...7 B. CURRENT ENVIRONMENT ...7
1. Pending Retirement Change ...10
2. Comparison between Old and New Retirement Systems ...11
3. Population Affected ...15
4. Expected Implementation ...15
C. VARIABLES AFFECTING FUTURE VALUE OF THE TSP ...16
D. ELEMENTS OF RETIRE TOOL ANALYSIS ...18
1. Cash Flow Analysis ...20
2. Tax Impacts ...23
3. Cash Flow Comparison ...24
4. Volatility Analysis ...25
5. NPV of Payments ...27
E. INVESTMENT RISK OF THE TSP ...29
1. Historical Returns ...29
2. TSP Volatility ...30
3. Investment Options ...30
4. Conservative Shift of Investments in the Lifecycle Funds ...31
F. SUMMARY ...32
METHODOLOGY ...33
III. A. INTRODUCTION...33
B. RETIRE TOOL METHOD OF ANALYSIS ...33
1. Inputs of the RETIRE Tool ...33
2. Target Population of the RETIRE Tool...34
4. Study Design ...34
C. SURVEYING NPS STUDENTS ...36
D. PRE-SURVEY AND POST-SURVEY QUESTIONS...37
E. DATA ANALYSIS METHOD ...38
F. SUMMARY ...38
ANALYSIS AND RESULTS ...39
IV. A. INTRODUCTION...39
B. RESEARCH PARTICIPATION ...39
1. Sample Population Characteristics ...39
2. Personal Discount Rates of Participants ...40
3. Participants Who Plan to Serve Less Than 20 Years ...42
C. ANALYSIS OF PARTICIPANTS’ LEVEL OF CONFIDENCE GIVEN THE CHOICE BETWEEN HIGH-36 AND THE BRS ...42
1. Hypothesis ...42
2. Data Organization ...42
3. Analysis of Pre-survey and Post-survey Responses to Survey Question Six, Question Seven, and Question Ten ...44
D. ANALYSIS OF CONFIDENCE TO CHOOSE BETWEEN HIGH-36 AND THE BRS WITHOUT ADDITIONAL TRAINING ...44
1. Hypothesis ...44
2. Data Organization ...45
3. Analysis of Pre-survey and Post-survey Responses to Survey Question 13 ...46
E. ANALYSIS OF CHANGES IN LEVELS OF KNOWLEDGE AFTER A RETIRE TOOL INTERVENTION ...47
1. Hypothesis ...47
2. Data Organization ...47
3. Analysis of Pre-survey and Post-survey Responses to Survey Question Five ...48
4. Additional Analysis of Levels of Knowledge ...49
F. ANALYSIS OF TSP CONTRIBUTION DECISIONS ...49
1. Hypothesis ...49
2. Data Organization ...50
3. Analysis of Pre-survey and Post-survey Responses to Survey Question Three ...51
G. ANALYSIS OF DECISIONS BETWEEN HIGH-36 AND THE BRS ...51
3. Analysis of Pre-survey and Post-survey Responses to
Survey Question One ...53
H. ANALYSIS OF PARTICIPANT AWARENESS OF FINANCIAL BENEFIT ...53
1. Hypothesis ...53
2. Data Organization ...53
3. Analysis of Pre-survey and Post-survey Responses to Question 12 ...55
I. ANALYSIS OF RETIRE TOOL FEATURES MOST INFLUENTIAL TO PARTICIPANTS ...56
1. Discussion...56
2. Data Organization ...56
3. Analysis of Post-survey Questions 14, 15, and 16 Responses ...57
J. ANALYSIS CONSIDERING WHAT MORE CAN HELP SERVICE MEMBERS GIVEN THE CHOICE BETWEEN HIGH-36 AND THE BRS ...58
1. Discussion...58
2. Data Organization ...58
3. Analysis of Post-survey Responses to Question 17...60
K. SUMMARY OF FINDINGS RELATED TO RESEARCH QUESTIONS ...60
L. RECOMMENDATIONS BASED ON ANALYSIS ...61
M. SUMMARY ...62
SUMMARY, CONCLUSIONS, AND AREAS FOR FURTHER STUDY ...63
V. A. CONCLUSION ...63
B. AREAS FOR FURTHER STUDY ...64
APPENDIX A. RETIRE TOOL SCREENSHOTS ...67
APPENDIX B. PRE-SURVEY AND POST-SURVEY RESPONSES ...73
APPENDIX C. CAPTURED INPUTS FROM RETIRE TOOL ...85
LIST OF REFERENCES ...91
LIST OF FIGURES
Figure 1. BRS Implementation Timeline. Source: DOD (2016). ...10
Figure 2. Annual Expected Pension Benefits (Defined Benefit) of an E-8 with 22 YOS...12
Figure 3. Cash Flow Analysis of the HIGH-36 Pension within the RETIRE Tool ...20
Figure 4. Cash Flow Analysis of the BRS Pension and TSP within the RETIRE Tool ...22
Figure 5. Cash Flow Analysis of the BRS and the TSP within the RETIRE Tool ...25
Figure 6. Estimated Volatility of TSP Accounts over Time ...26
Figure 7. NPV Formula. Source: NPV%201.gif (2016). ...27
Figure 8. NPV Analysis of HIGH-36 and BRS within the RETIRE Tool ...28
Figure 9. TSP Fund Historical Performance ...29
Figure 10. TSP Volatility Fund Comparison Matrix. Adapted from “Thrift Savings Plan” (n.d.). ...30
Figure 11. Allocation of the TSP Lifecycle 2050 Fund at Inception and Completion. Adapted from “Lifecycle Funds: L 2050” (n.d.). ...31
Figure 12. Observed Personal Discount Rates while Using the RETIRE Tool ...41
Figure 13. Question Five Changes in Levels of Knowledge and Two-Tail P-values ...48
LIST OF TABLES
Table 1. BRS TSP Matching Structure. Source: DOD (2015). ...13
Table 2. Approved Military Raises and Inflation by Year. Adapted from
“United States Military Basic Pay History” (n.d.) and Worldwide Inflation Data (n.d.)...21
Table 3. 2016 Federal Tax Brackets for Single Filers. Adapted from “Tax
Brackets” (n.d.). ...23
Table 4. Participants’ Current and Expected Future Pay Grades ...40
Table 5. Question Six ANOVA Results and Responses within the Pre-survey
and Post-survey ...43
Table 6. Question 13 ANOVA Analysis and Responses within the Pre-survey
and Post-survey ...46
Table 7. Question Three ANOVA Analysis, Pre-survey, and Post-survey
Responses ...50
Table 8. Question One ANOVA Analysis, Pre-survey and Post-survey
Responses ...52
Table 9. Question 12 ANOVA Analysis, Pre-survey and Post-survey
LIST OF ACRONYMS AND ABBREVIATIONS
AFADBD Armed Forces Active-Duty Base Date
ANOVA analysis of variance
BRS Blended Retirement System
DLI Defense Language Institute
DOD Department of Defense
IRB Institutional Review Board
NPS Naval Postgraduate School
NPV net present value
PDR personal discount rate
RETIRE Tool realistic evaluation of taxes, interest, risk and equity tool
SRB Scientific Review Board
TIG time in grade
TIS time in service
TSP Thrift Savings Plan
TVM time value of money
WACC weighted average cost of capital
ACKNOWLEDGMENTS
I would like to express my sincere gratitude to Dr. Rendon, Dr. Landry, Dr. Euske and Dr. Eger. Your combined efforts pushed me toward a refinement of ideas that I would not have been able to produce otherwise. This research truly felt like a team effort. I would like to especially thank Dr. Rendon for the countless hours of guidance and editing that she provided to me; ma’am, thank you for everything! Finally, I would like to thank my wife, Janine, and my two daughters for having great patience and understanding to allow me to create the research I originally envisioned.
INTRODUCTION
I.
A. BACKGROUND
Retirement systems exist within private and government organizations throughout the world as a means to provide benefits to employees after they no longer work within the organization. Significant differences exist between these retirement systems; some plans require lengthy periods of employment while other retirement systems offer benefits after shorter periods of employment.
One purpose of retirement systems is to provide employees an incentive to maintain longer periods of employment and to reduce employee turnover (Lewis & Stoycheva, 2016). To further incentivize this desired behavior, some retirement systems require a specified period of employment prior to retirement system vesting (Graham, 1988). Organizations must find a balance between the cost of retirement systems and the value of employee retention. The current retirement system in the Department of Defense (DOD) is called the HIGH-36 system. This retirement system requires that active-duty service members serve a minimum of 20 years to gain retirement benefits (Bradford, 2015).
After December 31, 2017, U.S. service members with less than 12 years of service (YOS) will face a decision between the HIGH-36 military retirement system and the new Blended Retirement System (BRS). All service members with more than 12 YOS as of December 31, 2017, will remain under the HIGH-36 military retirement system. The election period between the two retirement systems will start on January 1, 2018, and will conclude on December 31, 2018. Once a service member selects a retirement system, this election is final and cannot be changed at a later date (DOD, 2016).
Across the DOD, military branches are preparing financial education designed to inform service members of the benefits of the new retirement system (Perdew, 2016). Given the changes to the retirement system, military leadership at all levels face new challenges to ensure service members make an informed financial decision about their retirement. Service members choosing between the two retirement systems face
challenges as they attempt to discern the financial value of the HIGH-36 system and compare it to the new system. The new retirement system is expected to affect military retention and recruitment; however, it is not entirely clear whether this effect will be positive or negative (Enns et al., 1984).
The previous retirement structure was an “all or nothing” plan, and service members who left prior to 20-years of service were ineligible for retirement benefits. The new BRS allows service members to realize retirement benefits by way of government matched Thrift Savings Plan (TSP) contributions up to 5 percent of base pay. The TSP is a “tax-deferred retirement savings and investment plan that offers Federal employees the same type of savings and tax benefits that many private corporations offer their employees under 401(k) plans” (OPM, n.d.). The BRS also includes the traditional pension after 20 YOS at a reduced rate of 2.0 percent of base pay per year of active service while the HIGH-36 retirement system offers 2.5 percent of base pay per year of active service (DOD, 2016). For a service member, the financial benefit of the HIGH-36 retirement system and the new BRS is dependent on a number of variables. These variables include the service member’s current pay grade, entry date into the armed forces, total YOS, expected future pay grade, life expectancy, TSP account selection, and contribution of base pay to the TSP.
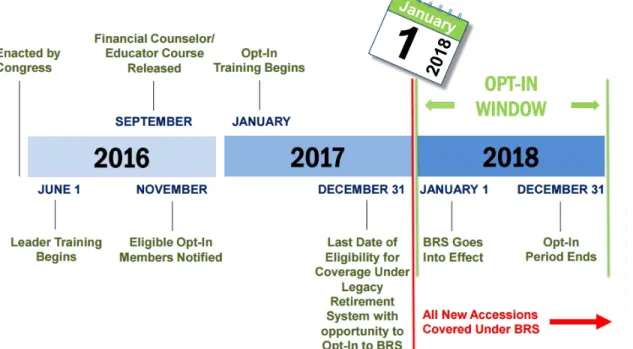
The implementation timeline specified by the DOD starts with leadership training that was released in June 2016. For service members deciding between the two retirement systems, the “opt-in” period will occur throughout Calendar Year 2018 (DOD, 2016). If service members do not want to “opt-in” to the BRS, they simply do nothing and remain under the HIGH-36 retirement system. Starting on January 1, 2018, new military entrants will be automatically enrolled in the BRS. On December 31, 2018, the “opt-in” period for current military members will close.
B. RESEARCH PURPOSE
The purpose of this research is to evaluate the effectiveness of a previously developed tool called the Realistic Evaluation of Taxes, Interest, Risk, and Equity Tool (RETIRE Tool), which was developed by the researcher. The RETIRE Tool allows service members to evaluate and compare the net present values (NPVs) of the HIGH-36 retirement system and the Blended TSP retirement system in order to make an informed retirement decision. The effectiveness of the RETIRE Tool will be assessed through a before and after survey of military personnel at the Naval Postgraduate School (NPS). The RETIRE Tool provides financial value estimates of the old retirement system compared to the new retirement system.
C. RESEARCH QUESTIONS
The research questions are as follows:
1. What effect will the use of the RETIRE Tool have on U.S. service
members’ level of confidence when deciding between the HIGH-36 Retirement system and the Blended TSP Retirement system?
2. Which features of the RETIRE Tool are most influential to service
members when deciding between the HIGH-36 Retirement system and the Blended TSP Retirement system?
3. How can service members best be assisted to make informed financial
decisions related to their retirement?
D. METHODOLOGY
A sample population consisting of active-duty U.S. military officers at the Naval Postgraduate School (NPS) was chosen to participate in this study. This sample population was chosen to measure the effectiveness of the RETIRE Tool with potential participants who are at varying stages of their military careers. This research study was approved by the Naval Postgraduate School (NPS) Institutional Review Board (IRB).
Participants in the study completed a voluntary and anonymous online survey using LimeSurvey. Upon completing the pre-survey, participants were provided with a brief instruction session on the use of the RETIRE Tool. Participants then returned to computer stations and were given access to the RETIRE Tool. After using the RETIRE
Tool, participants completed a post-survey using LimeSurvey which was also voluntary and anonymous.
E. IMPORTANCE OF RESEARCH
With a decision looming for many service members between two retirement systems, this research serves to provide a customizable evaluation tool that allows service members to consider the financial value of both retirement systems. The importance of this research is the measurement of levels of confidence that service members experience after using the RETIRE Tool. This research has the potential to provide benefits across the DOD. As individual services look to prepare their service members through financial education, the RETIRE Tool has the potential to serve as the critical link between financial education and financial analysis. By focusing on individual evaluative training to educate service members, this research is different from typical military education programs, which rely upon large classroom environments to educate service members on new policies. The investigator of this research shares the following goal congruence with senior leadership within the DOD: allowing service members to make an informed
retirement decision which will benefit the individual and the organization (Empowering
and Protecting Servicemembers, 2011).
F. BENEFITS AND LIMITATIONS
Prior to the development of the RETIRE Tool, NPV calculations comparing the HIGH-36 retirement system and the BRS would be complicated and time consuming. Even with a knowledge of finance, computing the expected value of payments would require knowledge of both retirement systems and the effective rates of return within the TSP. Possibly the greatest potential benefit of this research is that it allows service members to create financial computations which would otherwise be very complicated.
One limitation of this research is its focus on active-duty service members. While the RETIRE Tool can be used by all ranks within the United States Armed Forces, the focus of the tool is towards active-duty service members. The investigator within this research focused on active-duty U.S. military officers in an effort to test the
Another limitation of this research is the handling of Lump Sum payment options. Under BRS, service members can elect to receive 25 percent or 50 percent of their retirement pension as a Lump Sum payment at some future point in their career (DOD 2016). These Lump Sum payments are expected to be discounted based on a pre-determined rate established by the DOD to reflect the time value of money (TVM) of service members. The research investigator within this research study considered these payments outside the scope of this research.
One final limitation of this research is the valuation of the TSP. Suffice it to say that the research investigator in this study does not have the true rate of return of future TSP contributions. As a result, the RETIRE Tool was developed using historical returns of TSP accounts to estimate future financial value of the TSP.
G. ORGANIZATION OF REPORT
This report consists of five chapters. The introductory chapter is followed by a literature review exploring the current environment. Factors within the current environment include the population affected, the anticipated implementation including the expansion of financial training, and the provisions of default contributions into the TSP. During the literature review, the previously developed RETIRE Tool is discussed in greater detail including the cash flow analysis, tax impacts, cash flow comparison, volatility analysis, and NPV of payments. Chapter II concludes with a review of the potential investment risks of the TSP by looking at historical returns, volatility, investment options, and the shifting risk of Lifecycle Funds.
The methodology of the research is introduced in Chapter III. The methods of analysis within the RETIRE Tool are presented, and the survey structure and method by which the survey was given to U.S. military officers at NPS are described. Chapter III concludes with a discussion of the data analysis method used in this research.
Chapter IV begins with an analysis of the three sources of data (pre-survey responses, RETIRE Tool results, and the post-survey responses). Analysis of the data is explored further through descriptive and quantitative methods. Data is evaluated using a “before and after” analysis of the pre-surveys and post-surveys to answer the research
questions. In Chapter IV, recommendations are provided based on the descriptive and quantitative data analysis. Chapter IV also includes limitations of the study and the identification of the strongest measures found within the pre-surveys and post-surveys. Based on the responses of the service members, recommendations for financial training are provided. Chapter IV also includes a discussion on the implications of the findings. Chapter IV concludes with analytic evidence in support of the answers to the research questions.
Chapter V consists of a summary of the research study and continues with the conclusions and answers to the three research questions. Chapter V concludes with the recommendations of areas for further study.
H. SUMMARY
Chapter I included background information relevant to the research and an introduction to the variables affecting the financial value of the HIGH-36 retirement system and the BRS. The research purpose and research questions were presented, followed by the methodology of the study. The importance of the research was described, and then the benefits and limitations of the research were provided. The chapter concluded with the organization of the report. The following chapter will provide the literature review.
LITERATURE REVIEW
II.
A. INTRODUCTION
This chapter is centered on previous studies and current policy to discern the actions leading to military retirement system changes that service members currently face. These issues are addressed through a review of the current environment, with a focus on the comparison between the HIGH-36 retirement system and the Blended Retirement System (BRS). This chapter includes a discussion on the population that is affected compared to those service members who are grandfathered into the old system. This chapter also introduces the expected implementation of the new retirement system, including the implications of expanding financial literacy throughout the Department of Defense (DOD) and the default contribution structure for service members who elect the Blended Retirement System (BRS).
Furthermore, this chapter introduces the financial elements built into the Realistic Evaluation of Taxes, Interest, Risk, and Equity Tool (RETIRE Tool). These financial elements include cash flow analysis, tax impacts, cash flow comparison, volatility analysis, and net present value (NPV) of payments. This chapter concludes with a review of investment risk of the Thrift Savings Plan (TSP). This section explores the historical returns of the TSP, TSP volatility, investment options provided to service members, and the conservative shift of investments over time of Lifecycle funds within the TSP.
B. CURRENT ENVIRONMENT
Retirement benefits in any organization serve as an incentive to workers towards career longevity within the organization (Enns et al., 1984). Specific to the military, the HIGH-36 retirement system is an “all or nothing” system, with retirement vesting occurring after 20 years of service (YOS). With the new BRS retirement system, service members will be offered financial incentives prior to the 20-year mark (DOD, 2016).
On January 29, 2015, the final report on Military Compensation and Retirement Modernization was published by a commissioned board (Bryant, McKinney, LaRue, Cicotte, & Samuels, 2015). The board members and supporting staff consisted of civil
and military leaders, and the board considered feedback from over 100,000 active-duty service members (Bryant et al., 2015). The final report was published with the following three primary goals of the commission:
1. Sustaining an all-volunteer force for the future.
2. Reinforcing recruitment and retention goals and maintaining a high quality
of life for service members.
3. Achieving fiscal sustainability within the military retirement system.
(Bryant et al., 2015)
The report offers 15 recommendations, a number of which have been adopted into the current military reform. The following recommendations are the most relevant to this research as many of the other criteria do not deal directly with military retirement:
1. Allow more service members to save for retirement earlier in their career.
2. Promote financial literacy throughout the DOD. (Bryant et al., 2015)
This research is based on the premise that in the current environment, service members do not have adequate financial literacy to effectively choose between the HIGH-36 retirement system and the BRS. In a 2015 study, researchers found that financial literacy creates trust in financial markets. This trust that is created from financial literacy results in a positive correlation between trust and investing participation (Kersting, Marley, & Mellon, 2015). The DOD is addressing the improvement of financial literacy; however, more can be done, given what is at stake for service members.
Multiple sources inside and outside of the DOD cite financial literacy as a necessary competency for service members to make a sound financial decision between HIGH-36 and the BRS. Financial literacy is defined as
the education and understanding of various financial areas. This topic focuses on the ability to manage personal finance matters in an efficient manner, and it includes the knowledge of making appropriate decisions about personal finance such as investing, insurance, real estate, paying for college, budgeting, retirement and tax planning. (“Financial Literacy,” 2016)
The issue of financial literacy in the DOD reached the highest levels of government through a 2011 hearing before the Senate Committee on Banking, Housing,
and Urban Affairs (Empowering and Protecting Servicemembers, 2011). During this
hearing, many senators voiced the need for continued financial literacy throughout the DOD. This point has not been lost on senior military leaders, and new financial literacy training has been developed to meet this objective (Perdew, 2016).
The DOD is working to improve financial literacy through training developed for leaders that introduces BRS for the Uniformed Services (“Leader Training,” n.d.). The web-based training module was designed to prepare military leadership with financial literacy to assist their subordinates with these changes (“Leader Training,” n.d.). Improved financial literacy is accomplished by introducing military leaders to financial definitions applicable to the policy change and the new components of the BRS (Perdew, 2016). Given the complexity of these changes, the expectation is that the DOD will work to improve financial literacy through a series of continuing classes and web-based training (“BRS Education Strategy,” 2016).
The question that arises is: “What resources should service members anticipate will be available to them as they face the decision between the HIGH-36 retirement system and the BRS?” At the time that this research is being conducted, the answer to that question is not perfectly clear since a number of the resources are still in development (“Leader Training,” 2016). The changes to the military retirement system have the potential to affect the financial readiness of service members. Poor financial readiness can lead to lower unit readiness. Navy Region Southwest has studied the issue of financial readiness and has found that “over 80% of clearances are revoked due to financial mismanagement” (Fleet & Family Support Center, 2015).
An online financial calculator will be made available throughout the DOD starting in January 2017. This calculator is being designed to show the financial value of the BRS. In addition to this calculator, the current web-based training module will be expanded to include training for service members who will be eligible to “opt-in” to the BRS (Perdew, 2016). Service members will have access to financial professionals to better understand their unique financial circumstances (“BRS Education Strategy,” 2016).
Finally, it is anticipated that service members will be provided with classroom-type training to provide the necessary training and education across the DOD to eligible individuals (“BRS Education Strategy,” 2016).
1. Pending Retirement Change
The implementation timeline for the BRS has been designed to allow service members an adequate amount of time to learn about the BRS and to make a decision regarding their retirement (“BRS Education Strategy,” 2016). Figure 1 shows the timeline of BRS implementation. The “opt-in” training begins in January 2017, and the “opt-in” period ends on December 31, 2018 (DOD, 2016).
Figure 1. BRS Implementation Timeline. Source: DOD (2016).
Understanding the financial differences between the HIGH-36 retirement system and the BRS is crucial for service members to make an informed financial decision (Perdew, 2016). With this in mind, the following key differences are explored in greater detail:
1. Differences in defined pension benefits between the HIGH-36 retirement system and the BRS
2. The addition of DOD matching contributions of base pay not available in
the HIGH-36 retirement system
3. The addition of continuation pay and lump sum options under the BRS
2. Comparison between Old and New Retirement Systems
a. Changes in Defined Pension Benefits
As previously mentioned, defined military pensions benefits under HIGH-36 are accrued only after serving for 20 years or more. Active-duty service members accrue 2.5 percent of their base pay in pension benefits per year of service (Bryant et al., 2015). For example, active-duty service members who served for 20 years on active-duty would be eligible for 50 percent of his or her base pay. The final base pay is calculated by averaging the base pay received during the last 36 months of service (Bryant et al., 2015).
Under the BRS, active-duty service members also become eligible for a retirement pension upon serving for 20 years. Under BRS, the multiple per year of service is reduced from 2.5 percent to 2.0 percent (DOD, 2015). Therefore, active-duty service members enrolled in BRS and who served for 20 years on active-duty would be eligible for 40 percent of his or her base pay as a pension. Figure 2 captures an example of the expected difference in pension benefits between the HIGH-36 retirement system and the BRS. Calculations were estimated using 2016 military pay tables. The example in Figure 2 is an E-8 service member with 22 YOS.
Figure 2. Annual Expected Pension Benefits (Defined Benefit) of an E-8 with 22 YOS
b. Matching Contributions in the BRS
Perhaps the most important feature of the BRS is the DOD TSP matching feature. Providing matching funds to a retirement account is likely to increase overall contribution to an individual’s retirement savings. Dworak-Fisher (2011) found that matching funds into retirement accounts results in higher contributions into retirement accounts. The TSP matching feature is also in line with the Military Compensation Commission’s recommendation to “allow more service members to save for retirement earlier in their career” (Bryant et al., 2015, p. 23). For members who elect the BRS, the DOD will begin contributing one percent of the service member’s base pay into a TSP account (DOD, 2016). Members currently on active-duty who elect BRS will not need to wait the mandated 60 days for these one percent contributions to start. However, no contributions will begin until January 1, 2018. The timing of cash flows in the BRS and the HIGH-36 retirement will have an impact on the nominal, real, and perceived value of the two retirement systems (Goodman, Ashworth, Landry, & Yin, 2016).
Time value of money (TVM) is defined as “the idea that money available at the present time is worth more than the same amount in the future due to its potential earning
$34,543.08
$27,634.46
capacity” (“Time Value of Money,” n.d.). TVM serves as a financial tool in corporate financial planning, but TVM is a concept that may be unfamiliar to some service members. TVM calculations are dependent on the identification of when future cash flows are to be received. A component of the difference between HIGH-36 and the BRS retirement system is the timing of future cash flows. Given that the cash flows of the HIGH-36 and the BRS occur at different times, NPV is used to allow for comparison between these cash flows.
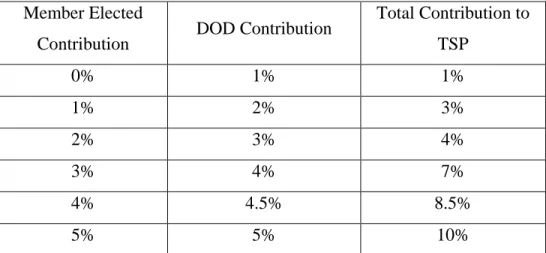
In addition to the 1 percent automatic contributions, service members under BRS will also be eligible for up to 4 percent additional matching contributions of their base pay to the TSP. Table 1 illustrates the structure of the TSP matching feature.
Table 1. BRS TSP Matching Structure. Source: DOD (2015).
Member Elected
Contribution DOD Contribution
Total Contribution to TSP 0% 1% 1% 1% 2% 3% 2% 3% 4% 3% 4% 7% 4% 4.5% 8.5% 5% 5% 10%
A portion of the financial value of the BRS hinges upon the service member elected contributions to the TSP. Research suggests that the number of investment options impacts the fund allocation of investors when deciding between low risk and high risk investments (Morrin & Broniarczyk, 2008). Whether the number of options available within the TSP will affect a service member’s investment choices is yet to be seen.
The future value of the service member’s TSP will vary within the range of zero contributions up to the maximum matching contribution of five percent. The earliest that service members will be eligible to withdraw from their TSP account is when they reach
the age of 59 ½ (Bryant et al., 2015). The limit on when funds can be withdrawn has TVM implications. The complexity of estimating the financial value of the TSP represents a necessity for focused education throughout the military to ensure service members can make an informed financial decision (Perdew, 2016).
c. Continuation Pay and Lump Sum Options under the BRS
Two additions to the BRS offer new financial incentives to service members facing the choice between the two retirement systems. First, continuation pay is a feature within the BRS that “is provided to Service members at the completion of 12 YOS for those who commit to an additional four years” (“Leader Training,” n.d.). In its current structure, service members will be eligible for a minimum payment of 2.5 months of base pay after 12 YOS in exchange for a commitment of four more YOS (DOD, 2016). This portion of the BRS serves as a financial retention incentive.
Second, the Lump Sum feature within the BRS provides an option for service members to take part of their retirement benefits as a one-time payment. The lump sum, if selected, will reduce future pension payments by either 25 percent or 50 percent (“Leader Training,” n.d.). According to the online training available to military leaders for the BRS, lump sum payments will be discounted using a “personal discount rate” (PDR) based on existing research (Bryant et al., 2015). In theory, this rate of discount, once applied to the reduction of future payments, would leave a service member indifferent between the lump sum payment and the future portion of the pension forfeited (Nord, 1987). Since lump sum payments are elections by the service member, it is at best difficult to determine the likelihood of service members taking these payments. At this time, the policy for Lump Sum payments is still in formulation within the DOD (DOD, 2016). Since the DOD has not yet published the PDR’s that will be used, this research does not address the Lump Sum feature.
3. Population Affected
The modernization of the military retirement system will affect three distinct groups of service members:
1. Service members who have more than 12 years of active service as of
December 31, 2017, or more than 4,320 retirement points (for reserve component) (DOD, 2016)
2. Individuals who will join the U.S. military after December 31, 2017
(DOD, 2016)
3. Service members who have less than 12 years of active service as of
December 31, 2017, or less than 4,320 retirement points (for reserve component) (DOD, 2016)
These populations are affected in different ways. For service members who will have more than 12 years of active service at the end of 2017 or more than 4,320 retirement points, these service members will remain under the current retirement system (Perdew, 2016). This population is not eligible for the BRS. For the individuals who join the U.S. military after December 31, 2017, these future service members will only be eligible for the BRS (DOD, 2016). They are not eligible for the HIGH-36 retirement system. For those service members who will have less than 12 years of active service at the end of 2017 or less than 4,320 retirement points, these service members may choose between the old retirement system and the BRS (DOD, 2016). For the purposes of this research, the service members who must make this decision represent the population affected. While the other two groups are also affected by the decision, these populations do not have a decision to make; the decision has already been made for them.
4. Expected Implementation
Leading up to the 2018 opt-in period, the DOD will make resources available to service members so that they may make an informed financial decision. Given that the decision service members make is irreversible, special attention should be given to ensuring that members of the United States Armed Forces have the right resources when faced with this retirement decision.
a. Expansion of Financial Literacy throughout the DOD
On the surface, the elements that separate the HIGH-36 retirement system and the BRS may appear to be simplistic and easy to explain. With respect to the difference in pension benefits, this is appearing to be the case. Explaining the differences between a 2.5 percent multiple of base pay compared to a 2.0 percent multiple of base pay is simple and straightforward. What is not as simple is helping service members to understand the financial value of the DOD matching portion of the BRS. This portion of the BRS will possibly be a point of emphasis for DOD leadership as they seek to improve financial literacy throughout the ranks.
b. Default Contribution of the TSP
Provided that service members elect enrollment in the BRS, they will be given a choice of investing in several TSP accounts. They will also be able to elect the percentage of base pay that goes into their TSP. If service members elect the BRS, but do not elect a TSP account or a percentage of base pay, by default they will be enrolled in the TSP Lifecycle Fund closest to their 62nd birthday (“Managing Your Account,” 2015). Without a selected percentage of base pay, by default, service members will contribute 3 percent of their base pay as well. While service members must make the decision between the HIGH-36 retirement system and the BRS now, the management of the TSP goes beyond that decision. Because of this, financial literacy must continue well beyond the “opt-in” period to help service members understand how to continue to manage their retirement savings (Pampuro, 2016).
C. VARIABLES AFFECTING FUTURE VALUE OF THE TSP
The following list represents the variables with the greatest effect on the future value of the TSP retirement account of the service member. Variables were selected based on their ability to financially impact the future value of the TSP. Variables were selected by the researcher. These variables were selected to keep the RETIRE Tool user interface simple while still allowing for detailed calculations.
1. Current Pay Grade: Under the BRS, government matched TSP
contributions will be tied to the service member’s base pay. Officers and enlisted members of varying pay grades will choose between the current and new retirement system, and this results in different contributions for service members.
2. Birth Date: Date of birth is an indirect variable which will affect the financial benefit of the two retirement systems. Differing ages of service members with otherwise similar variables will change the length of time that their TSP will grow until retirement. All else being equal, the older a service member is, the less time their TSP has to grow until retirement age.
3. Date of Active Duty: The Armed Forces Active-duty Base Date
(AFADBD) variable will determine when service members are eligible for traditional pension benefits. The AFADBD will also affect the current pay of service members. As service members reach Time in Service (TIS) milestones, they will receive pay raises as applicable.
4. Total YOS: The number of years that service members remain on active-duty will affect the total amount of individual contributions and
government matched TSP contributions. Under the BRS, service members will be eligible for matching contributions through their 26th year of service.
5. Expected Future Pay Grade: In conjunction with the number of years a service member will remain on active-duty, the expected future pay grade of the service member will affect the financial value of the retirement system. For the HIGH-36 retirement system, future pay grade will determine the total value of the pension payment. For the new retirement system, pension calculations will also be based on pay grade, and TSP contributions will be based on base pay. Service members who attain higher pay grades will have larger contributions to the TSP compared to service members who do not promote as quickly. This is a result of a higher base pay; and therefore, a higher amount being contributed to their TSP.
6. Life Expectancy: The length of time that a service member lives after leaving service will affect the value of his or her military retirement benefits. For service members electing the HIGH-36 military retirement system who vested for 20 years or more, the financial value of their program grows as they live longer (by continuing to receive pension payments). For service members electing the BRS, the pension portion of benefits also increases in value, but at a lower rate compared to the HIGH-36 retirement system.
7. TSP Account Selection: Service members who choose to contribute to the TSP may choose between six groups of funds (“TSP Fund Comparison Matrix,” n.d.). The first fund is the G Fund, which is a Government Securities Investment Fund (“TSP: G Fund,” n.d.). The second fund is the F Fund, which is a Fixed Income Index Investment Fund (“TSP: F Fund,” n.d.). The third fund is the C Fund, which is a Common Stock Index Investment Fund (“TSP: C Fund,” n.d.). The fourth fund is the S Fund, which is a Small Cap Stock Index Investment Fund (“TSP: S Fund,” n.d.). The fifth fund is the I Fund, which is an International Stock Index
Investment Fund (“TSP: I Fund,” n.d.). The sixth group of funds consists of Lifecycle Funds, or L Funds. The Lifecycle Funds consist of a “mix of G, F, C, S and I Funds to a particular time horizon, or target retirement date. The investment mix of each L Fund becomes more conservative as its target date approaches” (“TSP: Lifecycle Funds,” n.d.).
Each TSP fund offers different potential rates of return and differing levels of market risk. The choice between the TSP accounts will affect the
financial value of the BRS.
8. Contribution of Base Pay: Given that the new BRS offers matching government contributions to the TSP, the service member’s percentage of base pay contribution will affect the financial value of the new retirement system. Upon active service of 60 days, service members enrolled in the BRS will receive DOD Automatic contributions of 1 percent of their base pay (DOD, 2016). Completion of two years of active service results in an additional DOD matching of up to 4 percent of base pay (the 1 percent matching occurs regardless of service member contributions; however, the 4 percent additional matching is dependent upon member contributions).
D. ELEMENTS OF RETIRE TOOL ANALYSIS
The elements that comprise the previously developed RETIRE Tool were selected based on the following question: What financial tools will help service members make an informed financial decision regarding the decision between the HIGH-36 retirement system and the BRS? This question brought about a “user-focused” approach to the RETIRE Tool development. The elements of financial analysis serve to provide different ways to look at the same information. A goal of this research is to measure the effectiveness of these elements through a change in a service member’s level of confidence after using the tool. The following elements are found in the RETIRE Tool:
1. HIGH-36 Pension Element: This element of the RETIRE Tool estimates
the annual pension benefits that the service member will receive based on the responses to questions in the RETIRE Tool. The HIGH-36 Pension
Element provides an annual estimate and a monthly estimate of pension payments. This section of the RETIRE Tool also provides federal tax estimates based on current tax brackets.
2. BRS Pension Element: This element of the RETIRE Tool provides
estimates of the annual pension benefit that service members will receive if they choose the BRS. The BRS Pension Element provides an annual estimate and a monthly estimate of pension payments. This section of the RETIRE Tool also provides federal tax estimates based on current tax brackets.
3. TSP Growth and Annuity Element: This element of the RETIRE Tool
provides an estimate of the service members’ TSP account when he or she turns 59 ½. This element also provides an estimate of an annual annuity that the service member could withdraw from the TSP based on life expectancy and the TSP account selected. The TSP Growth and Annuity Element also estimates how taxes will increase at the time the service member begins receiving annuity and pension payments.
4. HIGH-36 and BRS Cash Flow Element: This element of the RETIRE Tool
provides a comparison of cash flows from the present date until the end of life expectancy of the service member. This element separates these cash flows into three categories: HIGH-36 cash flows, BRS cash flows, and member-elected TSP contributions under the BRS.
5. TSP Growth and Withdrawal Chart: This element of the RETIRE Tool
allows service members to see a visual estimate of the growth of their TSP account, and the subsequent decline in account value as service members begins to withdraw an annuity.
6. TSP Volatility Element: Based on the TSP account that the service
member selects, the TSP Volatility Element displays the average volatility of that account over time. The purpose of this element is to help the service member better understand the financial risks associated with their TSP account.
7. NPV of HIGH-36 and the BRS: This element of the RETIRE Tool
provides the service member with a calculated NPV of the HIGH-36 retirement system and the BRS. The PDR of the service member is applied, with an option for the service member to enter a different rate.
8. Graphical NPV of HIGH-36 and the BRS: This element of the RETIRE
Tool provides the service member with a graphical monthly calculated NPV of the HIGH-36 cash flows compared to the cash flows of the BRS. This element shows the service member the NPV of these cash flows based on when they are received over the service member’s life.
1. Cash Flow Analysis
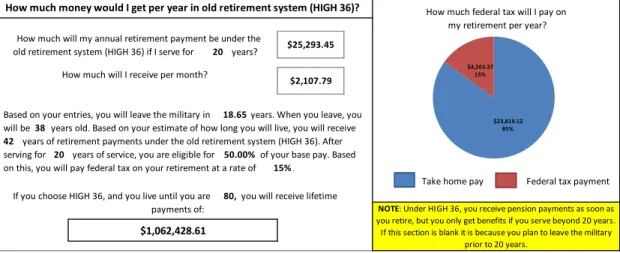
Within the RETIRE Tool, service members are provided with a cash flow analysis of the HIGH-36 retirement system and the BRS. This analysis is provided by estimates of future cash flows presented as annual amounts, monthly amounts, and lump sum amounts between the two systems. Figure 3 is a sample output of the HIGH-36 cash flow analysis section of the RETIRE Tool.
Figure 3. Cash Flow Analysis of the HIGH-36 Pension within the RETIRE Tool
It is important to discuss a few of the underlying assumptions built into the cash flow analysis so that readers of this research understand the logic behind the RETIRE Tool. Given that these pension payments described in Figure 3 are not occurring for another 18.65 years, the handling of TVM is critical. Without properly displaying retirement cash flows, service members may be misled to believe that these future payments have greater spending power than they truly have. The two central forces that must be considered are congressionally approved military pay increases and the effect of inflation (Sanchez, 2015). How do these two forces change the spending power of future pension payments in terms of “today’s dollars”? Table 2 is a comparison between military pay raises and inflation between 2006 and 2010.
old retirement system (HIGH 36) if I serve for years?
years. When you leave, you will be years old. Based on your estimate of how long you will live, you will receive
years of retirement payments under the old retirement system (HIGH 36). After serving for of your base pay. Based on this, you will pay federal tax on your retirement at a rate of
Take home pay Federal tax payment If you choose HIGH 36, and you live until you are you will receive lifetime
NOTE: Under HIGH 36, you receive pension payments as soon as you retire, but you only get benefits if you serve beyond 20 years. If this section is blank it is because you plan to leave the military
prior to 20 years.
$1,062,428.61 20 years of service, you are eligible for 50.00%
15% 80,
payments of:
How much will I receive per month? $2,107.79 Based on your entries, you will leave the military in 18.65
38 42
my retirement per year? How much will my annual retirement payment be under the $25,293.45
20
How much money would I get per year in old retirement system (HIGH 36)? How much federal tax will I pay on
.
$23,819.12 85% $4,203.37
Table 2. Approved Military Raises and Inflation by Year. Adapted from “United States Military Basic Pay History” (n.d.) and
Worldwide Inflation Data (n.d.).
Year Military Raise CPI Inflation
2015 1% .12% 2014 1% 1.62% 2013 1.7% 1.47% 2012 1.6% 2.07% 2011 1.4% 3.16% 2010 3.4% 1.64% 2009 3.9% -.34% 2008 3.5% 3.85% 2007 2.7% 2.85% 2006 3.1% 3.24%
During this ten-year period of observation, military pay increases averaged 2.33 percent and inflation averaged 1.968 percent. A study published by the RAND Corporation explored whether military pay is increasing at too high of a rate compared to other factors like inflation (Hosek, 2012). Studying data from 2000 through 2012, Hosek (2012) found that even after adjusting for inflation, military pay is increasing at a rate higher than specified benchmarks. Trends between military pay and inflation over the last four years are much closer, with average military pay increases and inflation between 2012 and 2015 being 1.325 percent and 1.32 percent, respectively. For the purposes of the RETIRE Tool cash flow analysis, the effects of inflation and future military pay increases are treated as equal offsets.
The next assumption rests on this question: Will service members be best served by seeing financial information in ‘today’s dollars’ or in ‘future dollars?’ (GAO, 2015).
The RETIRE Tool was built upon the assumption that service members will benefit from seeing future cash flow payments in ‘today’s dollars,’ or put another way, in today’s spending power. To accomplish cash flow analysis presented in today’s spending power, the RETIRE Tool calculates current military pay and future expected pay (from promotion and TIS) using the 2016 military pay table. Given the previous assumption of inflation and retirement pay offsetting each other, service members are provided with an estimate of the current spending power of future payments. Figure 4 shows the BRS cash flow analysis section of the RETIRE Tool.
Figure 4. Cash Flow Analysis of the BRS Pension and TSP within the
RETIRE Tool
One area of particular focus in the RETIRE Tool is the treatment of market growth of the TSP account with respect to inflation. Given that future withdrawals from the TSP will have a decreased spending power due to inflation, the TSP annuity payment is calculated by estimating future dollar payments and determining an annuity. Next, the
How much will I receive per year after I retire and Under the new hybrid retirement, if you serve beyond 20
years, you will receive a pension equivalent to 2% of your base pay per year of service. After serving for years, you will receive this much in pension payments per year: How much will my pension payment be per month?
Under the new hybrid system, you will also receive benefits from the Thrift Savings Plan. You will be eligible to withdraw these benefits when you are
59 1/2 years old. Based on your previous response, you will invest in the Take home pay Federal tax payment
Thrift Savings Plan Funds. These funds are estimated to perform at at an annual rate of .
What is the estimated value of my Thrift Savings Plan when
When you reach 59 1/2 years old, you will be able to start withdrawing your Thrift Savings Plan contributions. Based on your risk tolerance, you elected to place your funds in investments after you turn 59 1/2. Historically, these funds perform at an annual rate of .
Based on when you expect to live, you will be able to make withdrawals from your Thrift Savings Plan for years. Your annual withdrawal will be approximately:
If you choose the new hybrid retirement, and you live until you are you will Federal tax payment Pension take home pay TSP take home pay
receive lifetime payments of:
$1,087,627.60 L FUND 2050 6.55% $15,014.83 20.50 80, $1,531.98 L FUND 2050
6.55% How much will I receive per year after I turn 59 1/2?
$200,051.32
I can start withdrawing funds at 59 1/2?
How much money will I get per year in new hybrid retirement?
before I turn 59 1/2? $18,383.79 20 .. $2,564.43 , 13% $17,096.23 , 87% $17,096.23 , 50% $12,259.81 , 36% $4,921.07 , 14%
annuity payment is discounted back to present value dollars by a 2 percent estimate supported by research from the Organization for Economic Co-operation and Development (“U.S. Inflation Forecast,” 2016).
2. Tax Impacts
The current structure of federal taxation is a bracketed tax rate based on a tax filer’s taxable income over the year. Table 3 provides the 2016 federal tax brackets for single filers.
Table 3. 2016 Federal Tax Brackets for Single Filers. Adapted from
“Tax Brackets” (n.d.).
Single Filing Taxable Income Brackets Tax Rate Up to $9,275 10% $9,276 to $37,650 15% $37,651 to $91,150 25% $91,151 to $190,150 28% $190,151 to $413,350 33% $413,251 to $415,050 35% $415,051 or more 39.6%
In an effort to limit the input complexity of the RETIRE Tool while still providing realistic estimates, the RETIRE Tool calculates future cash flow tax liability based on the single filer’s taxable income brackets. Given the long-term nature of these cash flows, the RETIRE Tool was built using a conservative tax approach. It is likely that service members may fall under other tax brackets through marriage, may receive Social Security benefits which impact tax liability, and may also have other sources of income which will
impact tax liability. These impacts would be difficult to estimate, so in attempts to keep the user interface of the RETIRE Tool as simple as possible, they are not included. Therefore, while these additional impacts on tax liability are certainly worthy of investigation, they are outside the scope of this research, so they are not incorporated in the RETIRE Tool.
3. Cash Flow Comparison
The cash flow comparison element of the RETIRE Tool was designed to allow service members to visually estimate the future cash flows provided by the HIGH-36 retirement system and compare it to the cash flows of the BRS. In the model, future cash inflows and cash outflows are expected to exist within the following categories:
1. Cash inflow from active-duty pay
2. Cash inflow from BRS Lump Sum payment
3. Cash inflow from HIGH-36 pension
4. Cash inflow from BRS pension
5. Cash inflow from TSP account withdrawals
6. Cash outflow from TSP contributions
The cash flow comparison section combines these categories to provide a graphical estimation of cash flows from present day until the end of the life expectancy of the service member. Figure 5 illustrates the cash flow comparison chart.
Figure 5. Cash Flow Analysis of the BRS and the TSP within the RETIRE Tool
Identifying future cash inflows and cash outflows is a necessary step towards NPV; however, there is also a value in displaying this financial information graphically. Every service member is expected to weigh the value of the two retirement systems in his or her own way (Tannahill, 2012). The cash flow comparison section provides a visual tool of expected cash inflows and cash outflows. It becomes the responsibility of the service member to interpret his or her own financial value based on these estimates.
Another consideration with the graphical display of financial value is the relatively young population who is making this decision. Tannahill (2012) found that the skill of making financial decisions is at its highest for individuals in their early 50s. Given that the affected population is likely between the ages of 18 and 30, visual tools like the cash flow comparison may provide greater financial clarity in making an otherwise complex decision.
4. Volatility Analysis
When comparing the expected volatility of the HIGH-36 retirement system and the BRS, volatility is virtually non-existent in the HIGH-36 system. In an effort to expand financial literacy in the wake of this change, it became necessary to quantify the volatility
of the TSP portion of the BRS. Merriam-Webster defines volatility as something
“characterized by or subject to rapid or unexpected change” (“Volatile,” n.d.). Financial
volatility is defined as “a measure of a security's stability. It is calculated as the standard This chart shows the estimated
combined cash flows of the old retirement system and the new retirement system (annual pay). Included in this analysis is the amount of base pay that you will invest in the Thrift Savings Plan if you select the new retirement
system. $20,000.00 $40,000.00 $60,000.00 $80,000.00 $100,000.00 $120,000.00
HIGH 36 (OLD SYSTEM) CASH FLOWS BLENDED TSP (NEW SYSTEM) CASH FLOWS Member elected TSP
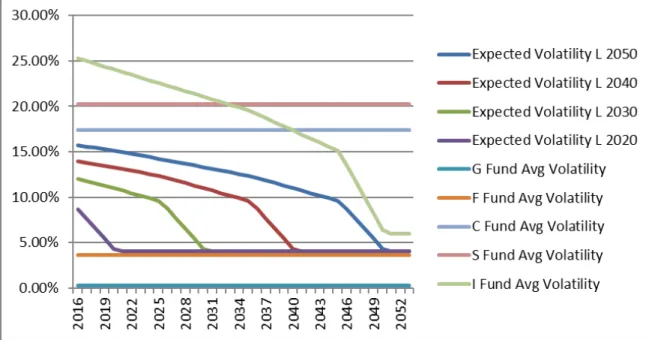
deviation from a certain continuously compounded return over a given period of time” (“Volatility,” 2012). The measure of expected volatility of Thrift Savings Plan accounts is displayed in Figure 6.
Figure 6. Estimated Volatility of TSP Accounts over Time
This element of the RETIRE Tool displays the TSP account volatility based on the account selection of the service member. Understanding volatility within the TSP accounts is a necessary step toward improving the financial literacy of service members. The RETIRE Tool provides a brief explanation of volatility in conjunction with visual volatility estimates of the selected TSP account.
Volatility and portfolio growth are inherently intertwined. Armstrong found a direct link in his research between portfolio volatility and the “survival of the portfolio at any given time horizon” (Armstrong, 2005, p. 10). Given that the HIGH-36 retirement system has little to no expected volatility, and the BRS has a range of expected volatility, it is useful to educate service members on the potential financial impact of volatility.
5. NPV of Payments
The final element of the RETIRE Tool is a net present value analysis of future cash flow payments. NPV is defined as “the difference between the present value of the future cash flows from an investment and the amount of investment. The present value of the expected cash flows is computed by discounting them at the required rate of return” (“Net Present Value,” n.d.). When NPV is utilized by a business, the rate applied will often be the Weighted Average Cost of Capital (WACC), also referred to as the “hurdle rate” (WACC, 2016). For service members, the Personal Discount Rate (PDR) serves as the required rate of return that would make them indifferent between these cash flows today or at the specified time according to the selected retirement system (Nord, 1987). The formula in Figure 7was used to calculate NPV.
0 1 1 2 ... 1 (1 ) (1 ) T T C C C NPV C r r r = − + + + + + + + 0
C
−
= Initial Investment C=Cash Flow r=Discount Rate T=TimeFigure 7. NPV Formula. Source: NPV%201.gif (2016).
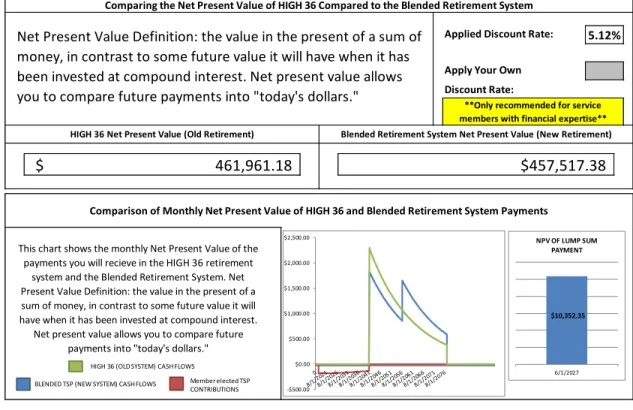
The RETIRE Tool presents NPV as a summed total between the two retirement systems and as a graphical chart. Figure 8 shows the NPV section of the RETIRE Tool. Given that the active-duty pay of service members will be the same between the two retirement systems (except for contributions to the TSP), active-duty pay is not captured within the NPV calculation. The three cash flow categories considered within NPV are as follows:
1. Cash inflows to HIGH-36 retirement from pension payment
2. Cash inflows to BRS from pension payments and TSP Annuity
Figure 8. NPV Analysis of HIGH-36 and BRS within the RETIRE Tool
The applied discount rate within the RETIRE Tool is the PDR of the service member. This is calculated through three TVM questions presented to the service member designed to encourage long-term TVM responses. If a service member does not feel that the PDR is truly representative of his or her value of money over time, he or she may override the original discount rate by entering in a different discount rate in the specified field. The PDR determines the total value in the NPV section of the HIGH-36 retirement and the BRS, including the TSP.
NPV has been used by businesses throughout the world as a means to identify a value of a project or financial event in contrast to a specified rate. One method of application of NPV involves the comparison of multiple project options, with preference given toward the project with the highest NPV. Nader (1991) provided strong evidence of the value of NPV in retirement decision making from the perspective of a corporation, but less research could be found that takes the perspective of a retirement system
Applied Discount Rate: Apply Your Own Discount Rate:
HIGH 36 Net Present Value (Old Retirement) Blended Retirement System Net Present Value (New Retirement)
461,961.18
$ $457,517.38
Comparing the Net Present Value of HIGH 36 Compared to the Blended Retirement System
Net Present Value Definition: the value in the present of a sum of money, in contrast to some future value it will have when it has been invested at compound interest. Net present value allows you to compare future payments into "today's dollars."
5.12%
**Only recommended for service members with financial expertise**
This chart shows the monthly Net Present Value of the payments you will recieve in the HIGH 36 retirement
system and the Blended Retirement System. Net Present Value Definition: the value in the present of a sum of money, in contrast to some future value it will have when it has been invested at compound interest.
Net present value allows you to compare future payments into "today's dollars."
Comparison of Monthly Net Present Value of HIGH 36 and Blended Retirement System Payments
-$500.00 $0.00 $500.00 $1,000.00 $1,500.00 $2,000.00 $2,500.00
HIGH 36 (OLD SYSTEM) CASH FLOWS
BLENDED TSP (NEW SYSTEM) CASH FLOWS Member elected TSP CONTRIBUTIONS
$10,352.35
6/1/2027 NPV OF LUMP SUM