2-2020
Predicting Pilot Misperception of Runway Excursion Risk Through
Predicting Pilot Misperception of Runway Excursion Risk Through
Machine Learning Algorithms of Recorded Flight Data
Machine Learning Algorithms of Recorded Flight Data
Edwin Vincent Odisho IIFollow this and additional works at: https://commons.erau.edu/edt
Part of the Aviation Safety and Security Commons, and the Risk Analysis Commons
This Dissertation - Open Access is brought to you for free and open access by Scholarly Commons. It has been accepted for inclusion in Dissertations and Theses by an authorized administrator of Scholarly Commons. For more information, please contact [email protected].
DATA
By
Edwin Vincent Odisho II
A Dissertation Submitted to the College of Aviation in Partial Fulfillment of the Requirements for the Degree of
Doctor of Philosophy in Aviation
Embry-Riddle Aeronautical University Daytona Beach, Florida
iv Researcher: Edwin Vincent Odisho II
Title: PREDICTING PILOT MISPERCEPTION OF RUNWAY
EXCURSION RISK THROUGH MACHINE LEARNING ALGORITHMS OF RECORDED FLIGHT DATA
Institution: Embry-Riddle Aeronautical University Degree: Doctor of Philosophy in Aviation
Year: 2020
The research used predictive models to determine pilot misperception of runway
excursion risk associated with unstable approaches. The Federal Aviation Administration defined runway excursion as a veer-off or overrun of the runway surface. The Federal Aviation Administration also defined a stable approach as an aircraft meeting the following criteria: (a) on target approach airspeed, (b) correct attitude, (c) landing configuration, (d) nominal descent angle/rate, and (e) on a straight flight path to the runway touchdown zone. Continuing an unstable approach to landing was defined as
Unstable Approach Risk Misperception in this research. A review of the literature revealed that an unstable approach followed by the failure to execute a rejected landing was a common contributing factor in runway excursions.
Flight Data Recorder data were archived and made available by the National Aeronautics and Space Administration for public use. These data were collected over a four-year period from the flight data recorders of a fleet of 35 regional jets operating in the National Airspace System. The archived data were processed and explored for evidence of unstable approaches and to determine whether or not a rejected landing was
v
processed for the purposes of building predictive models.
SAS™ Enterprise Miner® was used to explore the data, as well as to build and assess predictive models. The advanced machine learning algorithms utilized included: (a) support vector machine, (b) random forest, (c) gradient boosting, (d) decision tree, (e) logistic regression, and (f) neural network. The models were evaluated and compared to determine the best prediction model. Based on the model comparison, the decision tree model was determined to have the highest predictive value.
The Flight Data Recorder data were then analyzed to determine predictive accuracy of the target variable and to determine important predictors of the target variable, Unstable Approach Risk Misperception. Results of the study indicated that the predictive accuracy of the best performing model, decision tree, was 99%. Findings indicated that six variables stood out in the prediction of Unstable Approach Risk Misperception: (1) glideslope deviation, (2) selected approach speed deviation (3) localizer deviation, (4) flaps not extended, (5) drift angle, and (6) approach speed deviation. These variables were listed in order of importance based on results of the decision tree predictive model analysis.
The results of the study are of interest to aviation researchers as well as airline pilot training managers. It is suggested that the ability to predict the probability of pilot misperception of runway excursion risk could influence the development of new pilot simulator training scenarios and strategies. The research aids avionics providers in the development of predictive runway excursion alerting display technologies.
vi
I would like to dedicate this work to my parents and my wife. My parents, Edwin and DeAnn Odisho, instilled upon me the value of education and the pursuit of
knowledge. The encouragement you provided in my formative years, to ask why and seek answers, laid the foundation for a lifelong journey in aviation. Without your support and love, this journey would not have been possible. Although I lost you in the middle of the program, your presence in my life persists and will be with me until we meet again.
I would like to share this dedication with my wife, Bettina Odisho. Bettina was with me every step of the way on this journey. Without you I would not have had the intestinal fortitude to begin this endeavor, much less the shared responsibility of balancing family, full time flying, and pursuing a Ph.D. During the challenging times, your love and encouragement gave me the courage and motivation to succeed.
vii
To successfully complete an endeavor of this magnitude is not an individual accomplishment. I received immeasurable support, encouragement, guidance, advice, and help. I would first like to acknowledge my family. The day to day effort required to complete this program would not have been sustainable without complete and
comprehensive teamwork at home. The demands of the program necessitated sacrifice and selflessness on behalf of my wife, Bettina and daughters, Natalie and Sofia. I am forever grateful to you all.
I have been fortunate to receive coaching, guidance, instruction, and mentorship from teachers, coaches, flight instructors, professors, and others in my lifelong journey of learning. No one has been more important or valuable to me than my mentor and
committee chairman, Dr. Dothang Truong. His unique ability to constructively criticize, encourage improvement, and maintain high standards was crucial to my development on this journey of scholarship. I have never met a finer gentleman in my nearly 40 years in aviation. I feel fortunate and blessed to have had the opportunity to work with Dr. Truong.
Dr. Dothang Truong was assisted by a very special group of scholars on my dissertation committee. External committee member, Dr. Robert Maxson, is Director, National Centers for Environmental Prediction, and is an expert in data mining and predictive modeling. Dr. David Esser is an acknowledged expert in flight data analysis programs such as FOQA. Dr. Robert “Buck” Joslin, a fellow Marine Corps aviator and test pilot, is an expert in governmental regulatory issues associated with flight deck technology integration. Semper Fidelis!
viii
importance and value to the program could not be stressed enough. Mrs. Susie Sprowl, Administrative Assistant, School of Graduate Studies, College of Aviation, and Ms. Katie Esguerra, Marketing and Admissions Coordinator, School of Graduate Studies, College of Aviation, greatly assisted me in my transition back to student status after many years out of academia. I would also like to acknowledge Mrs. Jan Neal, Lead Instructional Designer, School of Graduate Studies, College of Aviation, for her assistance in the production aspect of my dissertation document.
I would be remised if did not acknowledge each of my professors in the program: Dr. Bruce Conway, (Management of Systems Engineering); Dr. Haydee Cuevas (Human Factors in Aviation, Quantitative Research Methods in Aviation, User-Centered Design in Aviation); Dr. Mark Friend, Academic Advisor (Aviation Safety Management Systems); Dr. Steven Hampton, Associate Dean of Research and Graduate Studies, College of Aviation, (Current Practices/Future Trends in Aviation); Dr. Kadie Mullins, (Instructional Design in Aviation); Dr. Alan Stolzer, Dean College of Aviation (Topics in Safety Management Systems); and Dr. Dothang Truong, Dissertation Committee
Chairman (Advanced Quantitative Data Analysis, Research Methods, Quantitative and Qualitative Data Analysis, Operations Research and Decision Making). Although I was not fortunate enough to have taken a class from Dr. Scott Winter, I would like to
acknowledge the important role he played in my development in the program. Thank you all for your encouragement and support.
ix
Page
Signature Page ... iii
Abstract ... iv
Dedication ... vi
Acknowledgements ... vii
List of Tables ... xiv
List of Figures ... xv
Chapter I Introduction ... 1
Background ... 11
Statement of the Problem ... 15
Purpose Statement ... 16
Significance of the Study ... 17
Theoretical Implications ... 17
Practical Implications ... 18
Research Questions ... 19
Delimitations ... 19
Limitations and Assumptions ... 19
Summary ... 21
Definitions of Terms ... 22
x
Federal Aviation Administration Guidance for Stabilized
Approaches ... 30
Unstable Approaches and Runway Excursions ... 33
Pilot Risk Perception and Risk Tolerance ... 35
Aviation Research Using Data and Text Mining Methods ... 39
Data Mining Methods ... 39
Text Mining Methods ... 43
Data Mining and Machine Learning Techniques ... 45
Decision Tree ... 47
Neural Network ... 49
Regression ... 49
Support Vector Machine ... 53
Random Forest ... 61
Gradient Boost Machine ... 68
Gaps in the Literature ... 77
Unstable Approach and Runway Excursion Hazards ... 77
Pilot Risk Perception and Risk Tolerance ... 78
Predictive modeling using recorded flight data. ... 79
Theoretical Foundation ... 83
Aviation Safety Knowledge Discovery Process ... 83
xi
Research Method Selection and Design ... 93
Population/Sample ... 95
Population and Sampling Frame ... 95
Sample Size ... 96
Sampling Strategy ... 97
Data Collection Process ... 97
Procedures ... 97
Data Coding and Algorithm Development ... 99
Data Mining Process ... 106
Apparatus and Materials ... 109
Sources of the Data ... 109
Ethical Consideration ... 109
Aviation Safety Knowledge Discovery Process ... 110
Categories ... 110
Variables and Scales ... 111
Data Analysis Approach and Process ... 112
Model Steps ... 113
Decision Tree ... 113
Logistic Regression ... 116
Neural Network ... 116
Support Vector Machine ... 118
xii
Model Comparison ... 121
Scoring ... 122
Descriptive Statistics ... 123
Reliability Assessment Method ... 123
Validity Assessment Method ... 124
Summary ... 126
Chapter IV Results ... 127
Demographics ... 128
UARM Algorithm Development ... 136
Descriptive Statistics ... 138
Data Exploration ... 143
Model Reliability and Validity ... 143
Reliability Assessment ... 143
Validity Assessment ... 145
Model Building and Evaluation ... 148
Variable Importance ... 155
Scoring ... 166
Summary ... 169
Chapter V Discussion, Conclusions, and Recommendations ... 170
Discussion ... 171
Research Question 1 ... 173
xiii
Pilot risk perception and risk tolerance ... 180
Predictive modeling using recorded flight data ... 181
Conclusions ... 185
Theoretical Contributions ... 186
Practical contributions ... 190
Limitations of the findings ... 191
Recommendations ... 192
Recommendations for the target population ... 192
Recommendations for future research ... 193
References ... 196
Appendices ... 207
A Data Source Authorization ... 207
B Flight Data Code ... 208
xiv
Table Page
1 Comparison of Prediction Methods ... 76
2 Summary of Primary Aviation Research Using Recorded Flight Data ... 91
3 Summary of Unstable Approach Criteria Using Recorded Flight Data ... 102
4 Summary of Recorded Flight Data Approach Frequencies ... 140
5 Summary of Unstable Approach Criteria Descriptive Statistics ... 140
6 Summary of Unstable Approach Flight Data Variable Exceedance Frequency 141 7 Decision Tree Misclassfication Rate Training and Validation Comparison ... 145
8 Decision Tree Confusion Matrix ... 148
9 Decision Tree Sensitivity/Specificity ... 149
10 Summary of Model Comparison Misclassfication Rate ... 150
11 Variable Importance for UARM ... 166
12 UARM Confusion Matrix for Champion DT Model ... 167
13 Specificity and Sensitivity Analysis of Champion DT Model ... 168
C1 Decision Tree Node Properties ... 221
C2 Results of the Decision Tree ... 226
C3 Decision Mining Tasks ... 227
C4 Equation Modeling Properties ... 228
C5 HP SVM Node Functions ... 234
C6 Recorded Flight Data Variables ... 238
xv
LIST OF FIGURES
Figure Page
1 Fatal Accidents and Onboard Fatalities by Phase of Flight from 2007–2016 ... 2
2 Stabilized Approach ... 3
3 Risk Management Decision-Making Process ... 7
4 Aviation Safety Knowledge Discovery (AVSKD) Process ... 84
5 Sample, Explore, Modify, Model, Assess (SEMMA) Knowledge Discovery ... 87
6 Data Collection Points ... 96
7 Research Procedure Framework ... 99
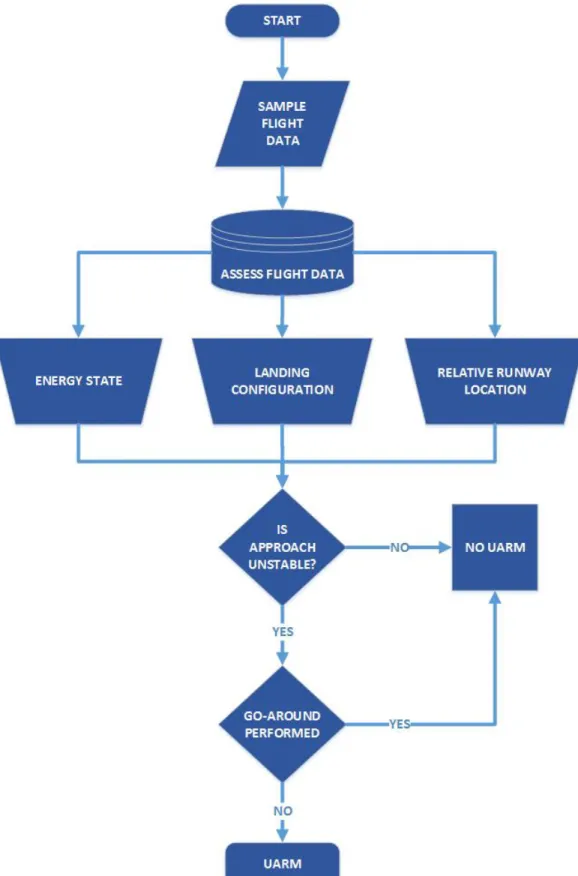
8 Unstable Approach Risk Misperception Algorithm Flow Diagram ... 105
9 U.S. carrier fleet ... 132
10 U.S. commercial air carrier domestic enplanements by carrier group ... 133
11 Regional jet payload-range data in 2017 ... 134
12 Unstable approach data comparison ... 135
13 Cumulative Lift Characteristics Chart for DT Train and Validate Comparison 144 14 Receiver Operating Characteristics Chart for Train and Validate Comparison . 147 15 Cumulative Lift Chart for Train and Validate Comparison ... 147
16 SAS EM model diagram example ... 149
17 Receiver Operating Characteristics chart for the model comparison ... 151
18 Cumulative Lift chart for the model comparison ... 152
19 Subtree Assessment Plot for DT model ... 153
xvi
22 Variable importance plot for predictor variables ... 156
23 Decision tree model of UARM ... 160
24 Cumulative lift chart for DT model ... 162
25 Receiver Operating Characteristics chart for DT model ... 162
26 Leaf statistics plot for DT model ... 164
27 Subtree assessment plot for DT model ... 165
28 Example of scoring codes for DT model ... 168
29 FAA predictive Safety Risk Mitigation strategy ... 185
B1 Flight variable data code ... 211
B2 SAS DT data code ... 218
CHAPTER I INTRODUCTION
The Federal Aviation Administration (FAA), the National Transportation Safety Board (NTSB), the Flight Safety Foundation (FSF), and the International Air Transport Association (IATA) have identified the continuation of an unstable approach to a landing as a hazard that has contributed to runway excursion (RE) accidents and incidents. The FAA (2003) defined a RE as a landing attempt that results in an overrun or veer off the runway surface. The IATA Accident database indicated that 61% of all aviation accidents from 2012-2016 occurred during the approach and landing phases of flight. IATA also claimed that 16% of those accidents contained unstable approach contributory factors (IATA, 2017). Consequently, the NTSB has issued numerous safety
recommendations to enhance runway safety, which have been consistently included in recent NTSB Most Wanted List of Transportation Safety Improvements (NTSB, 2019a). A review of recent NTSB accident investigation reports produced evidence that aircraft operators have not fully developed effective risk mitigation strategies concerning REs (FAA, 2014, 2015; NTSB, 2000, 2001, 2014a, 2014b, 2016, 2019b).
Boeing Commercial Airplanes (BCA) (2017) has compiled data on commercial aircraft accidents worldwide since 1959. Boeing reported that the highest percentage of fatal accidents over the last 10 years occurred during the approach and landing phases of flight as shown in Figure 1. Boeing also emphasized the contrast of relatively low flight time in the approach and landing phases of flight and the higher percentage of fatal accidents relative to other phases of flight (BCA, 2017).
Figure 1. Fatal accidents and onboard fatalities by phase of flight from 2007–2016. Percentages may not sum to 100% due to numerical rounding. Reprinted from “Statistical Summary of Commercial Jet Airplane Accidents Worldwide Operations: 1959-2016,” Aviation Safety, 2017. Copyright 2017 by Boeing Commercial Airplanes, p. 20. Adapted with permission. Source: www.skybrary.aero
To facilitate safety risk mitigation strategies for commercial airline operators, the FAA commissioned a working group, the Commercial Aviation Safety Team (CAST), in 2002. One of the key recommendations from the CAST was the drafting of Advisory Circular (AC) 120-71A, Standard Operating Procedures for Flight Deck Crewmembers
(subsequently replaced with AC 120-71B). This Advisory Circular introduced stabilized approach criteria, based on aircraft glide path, energy state, and configuration for landing (FAA, 2003). The FAA subsequently removed the stabilized approach criteria from AC 120-71A when it was updated to AC-120-71B. Although the specific criteria for the stabilized approach concept was not listed subsequent documentation, the FAA provided guidance on stable approaches in AC-91-79A, Mitigating the Risks of a Runway Overrun Upon Landing. In this AC, the FAA presented a case study on an unstable approach scenario as well as listing unstabilized approaches as the primary contributory factor in runway excursions (FAA, 2009, p. 3). Although FAA stable approach criteria have not been updated or modified in subsequent advisory circulars, both 120-71A and
AC-91-79A have been referred to in FAA documentation regarding unstable approaches. For example, the FAA advised readers to “refer to AC-120-71” in its description of stabilized approaches in AC-120-108, Continuous Descent Final Approach, (FAA, 2011, p. 2) and also made a similar suggestion in FAA Safety Briefing 18-09, FAA Stabilized Approach and Go-Around Concept, but referred readers instead to AC-91-79A (FAA, 2018, p. 2). References to specific FAA stable approach criteria were made to those listed in AC-120-71A (FAA, 2003) in this research.
The FAA also discussed unstable approaches in recommendations made to pilots concerning energy state management techniques in Advisory Circular 120-111, Upset Recovery and Prevention Training. In this AC, the FAA asserted that proper energy state management was a critical component in flight path management associated with stable approaches. (FAA, 2017a). Figure 2 shows an overview of a stabilized approach.
Figure 2. Stabilized approach. Reprinted from “Air Traffic Bulletin Procedures (ATB 2019-1),” by Federal Aviation Administration Air Traffic Procedures, April 2019, p. 2. Retrieved from https://www.faa.gov/air_traffic/publications/media/atb_april_2019.pdf
Additionally, in Advisory Circular 91-79A the FAA informed operators of the importance of safety risk mitigation strategies regarding runway excursions and highlighted concerns associated with unstable approaches. The FAA asserted that exceedances in stable approach criteria could be contributory factors in runway
excursions (FAA, 2013). For example, approach airspeed exceedance could cause a long landing, contributing to a runway overrun.
In 2008, the FAA formed the Runway Safety Council in collaboration with industry, to address hazards associated with runway safety. One of the stated goals of this cooperative effort was to decrease the number and severity of REs (FAA, 2008). The FAA asserted that REs play a crucial role in the overall risk-based scope of runway safety, with over 30 percent of REs resulting in accidents (FAA, 2008). The FAA and industry stakeholders subsequently developed action plans to reduce REs focused on identifying important factors that contribute to REs, using a data-driven approach (FAA, 2015).
An NTSB (2013) report presented details on the importance of aeronautical decision making (ADM) in the unstable approach/rejected landing process in an accident involving an Embraer 505 (also known as the Embraer Phenom 300 light jet) regional jet. The primary contributory cause of the accident was the failure of the pilots to execute a rejected landing when faced with evidence of an unstable approach (NTSB, 2013). The NTSB noted that the correct approach reference speed was 110 knots indicated airspeed (KIAS); however, data from the flight data recorder (FDR) indicated an actual approach speed of 158 KIAS. The approach speed exceedance contributed to a RE as the aircraft experienced a runway overrun, resulting in destruction of the aircraft
Runway excursion caused by unstable approach to a landing was also stated as the primary contributory factor in an average of 10 accidents and incidents per year from 2005 to 2016, resulting in the NTSB issuing Safety Recommendations A-08-16 through A-08-20 (FAA, 2014a, 2014b; NTSB, 2016). These Safety Recommendations detailed significant deficiencies in industry-based initiatives mitigating the risk of runway excursions through pilot training alone, substantiated with evidence presented in NASA Aviation Safety Reporting System (ASRS) pilot reports (NTSB, 2008). The suggested lapse in ADM, which occurs when a pilot elects to continue an unstable approach to landing, thus risking a runway excursion, was defined as Unstable Approach Risk Misperception (UARM) in the research.
Several examples of accidents with UARM-like contributory factors have been reported by the NTSB:
• Asiana Air Flight 214 crashed at the San Francisco International Airport, due to a RE (veer-off) caused by exceedance of glidepath stabilized approach criteria (well below glidepath). The accident resulted in destruction of the Boeing 777 as well as fatal injuries to three passengers (NTSB, 2014).
• UPS Flight 1354 crashed while attempting a night instrument approach to a landing at the Birmingham-Shuttlesworth International Airport,
Birmingham, Alabama in August 2013. The NTSB reported the primary cause of the accident was the flight crew continuing an unstable approach to landing, resulting in destruction of the Airbus A300 as well as fatally injuring the sole occupants, the two pilots. The report noted that the A300
exceeded stable approach criteria based on excessive glidepath deviations (below glidepath), resulting in the aircraft impacting the ground short of the runway (NTSB, 2014).
• Federal Express (FedEx) Flight 14 crashed during landing at the Newark International Airport, Newark, New Jersey in July 1997, resulting in destruction of the McDonnell Douglas MD-11. The NTSB stated that the probable cause of the accident was the Captain’s lapse in ADM,
continuing a landing with evidence of exceedance of stabilized approach criteria (excessive descent rate). The unstable approach resulted in a hard, bounced landing, leading to a loss of directional control on the runway, and ultimately a RE (NTSB, 2000).
Based on these and other related aviation accidents and incidents associated with REs, the NTSB (2019b) issued Safety Alert 077 advising pilots that failure to reject a landing associated with an unstable approach could result in not only a RE, but also loss of control and/or collision with terrain. In this Safety Alert, the NTSB advised pilots who face evidence of an unstable approach at 500 ft in visual conditions, to execute a rejected landing. The NTSB also advised pilots to beware of operational pressures and
continuation bias to continue a landing attempt when unstable, and reiterated the importance of performing a rejected landing when faced with evidence of an unstable approach (NTSB, 2019b).
These examples of lapses in ADM, which resulted in the occurrence of UARM and REs, provide evidence of an aviation hazard. The FAA explained the importance of ADM as it related to pilot risk management in AC 60-22, Aeronautical Decision Making.
In this document, the FAA detailed how pilot risk mismanagement could lead to aviation incidents and accidents (FAA, 1991). Orasansu et al. (2001) provided details on the criticality of risk perception in ADM with a discussion of several perspectives on risk perception factors such as: (a) organizational pressures, (b) pilot experience levels, (c) job responsibilities, and (d) mental modeling. The researchers described pilot risk tolerance and perception as they relate to ADM as depicted in Figure 3.
Figure 3. Risk management decision-making process. From “Pilot’s Handbook of Aeronautical Knowledge (FAA-H-8083-25),” by Federal Aviation Administration, 2016 (https://www.faa.gov/regulations_policies/handbooks_manuals/aviation/phak/media/04_p hak_ch2.pdf). In the public domain.
Additionally, the FAA (2016) asserted that the goal of risk management “is to proactively identify safety-related hazards and mitigate the associated risks” (p. 2-3). The FAA
continued to describe how the development of good risk assessment skills were necessary for pilots to demonstrate successful ADM.
Hunter (2005) provided much of the foundational research on pilot risk perception of hazards. Hunter defined pilot risk perception as the cognitive ability to appraise and discern risk involved in the formulation of an environmental mental model. The
researcher detailed the misconception of risk perception when this appraisal of a situation is in error. When pilots either underestimate the risk inherent in the situation or
overestimate their own capabilities, pilot risk perception error is probable. You and Han (2013) build on the work of Hunter (2005) with the assertion that the effects of airline pilot risk perception on threat and error management (TEM) are significant. Effective risk perception aspects of ADM enable pilots to successfully identify hazards while addressing the cognitive demands inherent to flight operations.
Orasanu et al. (2001) described how inappropriate risk perception could
contribute to lapses in ADM. The researchers described how continuation errors, also referred to as continuation bias by Dismukes (2010), could occur when pilot ADM and SA do not evolve and adapt to a dynamic environment. For example, if evidence of an unstable approach becomes apparent to the flight crew and they elect to continue to landing, as originally planned, Dismukes (2010) and Orasanu et al. (2001) assert that
continuation bias may have been experienced.
Pilots have been trained to compare actual aircraft performance variables, such as (a) indicated airspeed, (b) descent rate, (c) angle of bank, and (d) engine thrust, with stable approach criteria recommended by the FAA and further customized by each operator. Based on this assessment, pilots are expected to execute a rejected landing if
stable approach criteria have not been met (Moriarty & Jarvis, 2014). Although the literature indicated that several variations of the term rejected landing have been used interchangeably (i.e., missed approach or go-around), for purposes of standardization, the term rejected landing was used in this research when referring to the procedure pilots perform to abandon a landing attempt.
Although pilots have been trained to reject landings based on evidence of an unstable approach, a study by Giles (2013) on compliance with Standard Operating Procedures (SOP), an aspect of Aeronautical Decision Making, stated the following:
For the most part pilots will comply with SOP, but when they (1) don’t agree with SOP, (2) don’t understand SOP or the risks associated with not complying with SOP, or (3) don’t feel adequately trained to know what SOP is, it is difficult to motivate them to comply. (p.2)
Hence, pilots may not comply with stabilized approach criteria if they do not perceive the risk of a runway excursion associated with not executing the required rejected landing. The FAA suggested that one possible consideration to this risk misperception was that 97% of unstabilized approaches have resulted in a safe landing, although 10% of these safe landings exceeded some parameter (e.g. landing long). Regardless, the FAA suggested that non-compliance with an SOP was indicative of ineffective ADM (FAA, 2016).
With the continued advancements in FDR and Cockpit Voice Recorder (CVR) technology on commercial airliners, large volumes of data have been recorded and archived at a very rapid pace (Walker, 2017). W. Vogt, G. Vogt, Gardner, and Haeffele (2014) define big data as data so large in volume that it would be impossible for one person to code and analyze in less than one year without utilizing a computer. FDR
technology was originally used to assist accident investigations with mathematical analytical techniques concurrently evolving as FDR technology improved. As a result of these developments, new applications in safety risk management (SRM) emerged. Examples of these SRM processes include the Flight Operations Quality Assurance (FOQA) and FDM programs (Treder & Crane, 2004).
The advent of large data gathering methods has also provided the impetus for the continued development of advanced data analytical tools. Other industries have utilized advanced techniques in computing capability to develop complex mathematical
algorithms with the capability to handle large data (Tufféry, 2011). Recently, aviation researchers have begun to utilize these advanced data analytical tools in the exploration of large flight data (Li, Das, Hansman, Palacios, & Srivastava, 2015). Machine learning (ML) techniques have emerged as a preferred technique to rapidly analyze large volumes of flight data (Koteeswaran, Malarvizhi, Kannan, Sasikala, & Geetha, 2017).
The purpose of the research was to utilize machine learning techniques to explore large flight data in order to predict UARM. The exploration focused on the approach and landing phases of flight, specifically on unstable approaches. Variable selection
processes were based on the stable approach criteria as defined in AC 120-71A (FAA, 2003) and AC-91-79A (FAA, 2014). Variables were defined using the recorded flight data parameters including: (a) target approach speed deviation, (b) flap position, (c) landing gear position, (d) engine speed, and (e) glide path deviation. Additional criteria were based on: (a) vertical and lateral position of the aircraft with reference to the landing runway, (b) energy state, and (c) landing configuration. The information gathered in the data analysis was used to predict the probability of the pilot misperceiving the runway
excursion risk of continuing an unstable approach to landing. Pilot misperception was represented by non-compliance (either intentional or not) with standard operating
procedures regarding FAA guidance on required actions when faced with evidence of an unstabilized approach. Machine learning techniques were used to populate and compare various predictive models, and to determine the most accurate model, which was then used to make predictions of the probability of the manifestation of the target dependent variable, UARM. The occurrence of UARM contradicts best safety practices as
recommended by the NTSB and the guidance by the FAA, which is considered the minimum requirement in the operations specifications (OPSPECS) of any air carrier (FAA, 2003, 2014; NTSB, 2016, 2019b).
Background
The background on stable approaches began in 1997 with NTSB Safety
Recommendation A-97-85 that requested the FAA require all 14 CFR Part 121 and 135 operators to provide guidance for pilots regarding critical safety-of-flight
decision-making, particularly regarding stabilized approaches. A Part 121 air carrier (i.e. airliners) is an alias for scheduled passenger/freight operations and a Part 135 carrier comprises only commuter and on-demand operations. In response to the NTSB recommendations, the FAA issued Flight Standards Handbook Bulletin for Air Transportation (HBAT) 98-22, stabilized approaches. A key component of this document was the requirement for all 14 CFR Part 121 and 135 operators to establish defined criteria for stabilized approaches and also to train pilots to perform rejected landings if stabilized approach conditions were not met (NTSB, 2001). Although unstable approaches were also a
known hazard with general aviation (GA) aircraft, these operators were considered out of scope because data have only been obtained for a Part 121 carrier.
Despite these initiatives, American Airlines flight 1420 crashed during a landing attempt in June 1999 at the Little Rock National Airport in Little Rock, Arkansas. The McDonnell Douglas MD-82 aircraft overran the runway resulting in destruction of the aircraft. The Captain and 10 passengers were fatally injured. In addition to attempting to land in spite of evidence indicating exceedance of aircraft operating manual (AOM) crosswind limitations, the aircraft was not in the correct landing configuration (i.e.
spoilers were not armed), as required for a stabilized approach. The spoilers are normally armed to automatically deploy upon touchdown, reducing lift/increasing drag and
assisting in aircraft deceleration. The spoilers were particularly important on this flight as the runway was wet and the increased drag could have assisted in the prevention of hydroplaning (i.e. tires losing contact with the runway surface, on a thin layer of water). Because the spoilers were not armed, upon touchdown they did not automatically deploy, or extend, resulting in excessive rollout speeds and hydroplaning, which contributed to the aircraft being unable to stop prior to overrunning the runway (NTSB, 2001).
The NTSB (2001) noted that when the AA 1420 accident occurred in 1999, the only written guidance available to the crew concerning the stabilized approach concept was a vaguely worded description of a landing technique in the carriers’ SOPs. The NTSB (2001) stated that:
The only stabilized approach guidance provided in aircrew training at AA stipulated that the minimum recommended stabilized approach altitudes for IFR and visual flight rules (VFR) conditions were 1,000 and 500 feet, respectively,
and that landing flaps were to be selected by 1,000 feet above ground level. Before descending below the specified minimum stabilized approach altitude, the airplane was to be in the final landing configuration (gear down and final flaps), on approach speed, on the proper flightpath, at the proper sink rate, and at
stabilized thrust; these conditions were expected to be maintained throughout the rest of the approach. However, the guidance did not define what was meant by “on” approach speed, “on” the proper flightpath, and “at” the proper sink rate. In addition, the guidance did not describe the necessary flight crew actions if the stabilized approach criteria were not met. Information presented in the
“Techniques” section was not considered by American to be required procedures but rather suggested ways of accomplishing a task. (p.160)
The FAA responded to the recommendations by the NTSB with the development of the stabilized approach concept. The fundamental premise of the stabilized approach concept was that a general description of the aircraft state in the final approach and landing phases of flight should be based on three main aspects: (a) aircraft position on glide path and lateral extended runway centerline, (b) energy state, and (c) landing configuration (FAA, 2003). More restrictive criteria were left to the discretion of the operator and with the approval of each operator’s FAA Principal Operations Inspector (POI). The POI is tasked with ensuring air carrier compliance with their FAA approved Operator SOPs.
Campbell, Schroeder, Shah, and Zaal (2018) provided additional information regarding the collaboration between the FAA, NASA, and the NTSB on unstable approaches and pilot rejected landing ADM. The researchers detailed NTSB assertions
that AC 91-79A did not provide specific guidance on rejected landing requirements as recommended, which resulted in the NTSB closing the recommendation in 2012 with an unsatisfactory response. Campbell et al. (2018) contended that previous studies had not accurately investigated the root causes of the lack of compliance regarding rejected landings following an unstable approach. The researchers insisted that stable approach criteria were too complex and restrictive to the operational environment (Campbell et al., 2018).
In 2000, the FAA developed the first advisory circular on standard operating procedures (SOPs), now universally recognized as a basic component in an
organization’s safety management system (SMS) (FAA, 2003). An organization’s SOPs are the foundation to effective crew performance and help pilots maintain an accurate mental model of an aviation task. The FAA has provided air carriers with guidance that a rejected landing is a successful outcome when given evidence of an unstable approach (FAA, 2014). Analysis of FDR data in air carriers shows that the frequency of unstable approaches was 4% in 2009. Additionally, line operations safety audit (LOSA) jump seat observers on the flight decks of 4532 commercial flights between 2002 and 2006
reported, based on visual observation of flight instrument indications, that 5% of approaches were unstable and of those only 4% of unstable approaches resulted in a rejected landing (Moriarty & Jarvis, 2014).
The Flight Safety Foundation (2009) concluded that the number of rejected landings greatly underestimates the number of unstable approaches. This evidence was based on data gathered not only by the FSF but also by the collaborative industry based Commercial Aviation Safety Team, formed by the FAA in 2008 to address runway safety
(FAA, 2008). Conclusions made by both the FAA and the FSF suggest that current risk mitigation strategies have fallen short of stated objectives by the NTSB and FAA in their collaboration on the Runway Safety Council (RSC) (FSF, 2009). One of the main
objectives of the RSC was to reduce the risk of REs (FAA, 2014). Although aeronautical decision making, human error, and situation awareness have been well represented in the literature, little work has been presented regarding the use of machine learning to predict probability of pilot misperception of the runway excursion hazard, when faced with evidence of an unstable approach.
Statement of the Problem
Runway excursions are an aviation safety risk associated with hazards inherent in unstable approaches. The NTSB described problems of continuing unstable approach to landing in Safety Alert 077 (2019b). In this document, the NTSB (2019b) listed
problems associated with unstable approaches as:
• Failure to establish and maintain a stabilized approach, or continuing an unstabilized approach, could lead to landing too fast or too far down the runway, potentially resulting in a runway excursion, loss of control, or collision with terrain.
• Regardless of the type of aircraft, the level of pilot experience, or whether the flight was being conducted under instrument flight rules or visual flight rules, an unstabilized approach was a key contributor to runway excursions, loss of control, and terrain collisions control. (p. 1)
The FAA and NTSB have consistently identified unstable approaches as one of the most frequent causal factors in aircraft runway excursions, with flight data indicating
an average of 10 accidents per year from 2005 to 2016 (FAA, 2014, 2016; NTSB, 2010, 2016). The FSF (2009) presented details concerning the hazards associated with unstable approaches and the risk of runway excursion that resulted when pilots elected to continue to landing. The FAA, NASA, and the NTSB have confirmed the existence of the hazard and have made efforts to address the issue with guidance to air carriers regarding the following: (a) aircrew training, (b) SOP enhancement, and (c) safety mitigation strategies (e.g. pilot simulator training scenarios). However, an analysis of flight data gathered via LOSA, FOQA, and NASA ASRS voluntary pilot reports revealed that this hazard continued to exist (FAA, 2003, 2014; FSF, 2009; NTSB, 2014a, 2014b, 2016, 2019b). The NTSB has communicated its concern that even though air carriers now have stabilized approach guidance, as described in FAA Flight Standards HBAT 98-22,
runway excursions have continued to occur in part due to lapses in pilot perception of the risk when faced with evidence of an unstable approach (FSF, 2009; NTSB, 2001, 2016, 2019b).
Purpose Statement
The purpose of this research was to utilize machine learning techniques to explore large flight data in order to predict UARM. The study had two main objectives: (a) use machine learning algorithms to develop a prediction model for UARM, and (b) determine variables that contribute to the prediction of UARM. Predictive models were constructed based on advanced machine learning algorithms using 186 recorded flight data variables. Specific machine learning techniques applied to the flight data included: (a) decision tree, (b) logistic regression, (c) neural network, (d) support vector machine, (e) random forest, and (f) gradient boost machine algorithms. The flight data were recorded by FDRs on a
fleet of 35 regional jets over a period of four years (2001-2004). NASA had de-identified these data and made them available to the public. These data points were analyzed to identify unstable approaches and to construct prediction models. Once the models were built and validated, the model with the highest predictive score was used to predict the probability of UARM, which could be used to identify RE hazard. Additionally, SAS™ EM® software was used to rank flight data variables in order of importance to the occurrence of UARM. SAS™ EM® defined variable worth as the rank order (from 0 to 1) of input variables determined by the Chi-square statistic and described the strength of the relationship between categorical input variables and the target variable. SAS™ EM® used binning to derive categorical input variables from continuous input variables
(Sarma, 2013).
Significance of the Study
The research helps to enhance the effectiveness of commercial airline pilot simulator training as a hazard mitigation strategy by utilizing scenarios involving unstable approaches. Given the ability to predict UARM and the identification of flight variables most important in the prediction of UARM, airline training managers can evaluate and improve pilot ADM specifically to mitigate runway excursions.
Theoretical implications. The development of prediction models based on the application of ML algorithms to recorded flight data was a seminal study that focused on using data mining of data to build models to predict a desired or undesired event.
Additionally, the results of predictive algorithms could be used to detect lapses in decision making in other high risk fields such as medicine (e.g., surgery). For example, medical professionals perform many of the similar tasks requiring decisions to be made
based on safety of the patient. This decision-making ability relies on the management of risk and the perception of risk versus an estimate of one’s ability to complete the task; the predictive algorithm could provide the capability to the medical professional to mitigate and reduce such risk The ability to predetermine exceedance could also contribute to the evolution of pilot alerting technologies, such as Honeywell’s SmartLanding™ software algorithms that increase pilot SA of the aircraft state in the approach and landing phases of flight.
Practical implications. Key beneficiaries of the research are airline pilot simulator training programs and airline Safety Management System managers. The ability of airline pilot training managers to not only predict UARM but also identify hazardous trends in aircraft state variables involved in ADM could have a positive impact on airline safety risk mitigation strategies inherent in pilot simulator training programs, such as developing realistic runway excursion scenarios. Results of the study could be used to further refine not only FAA (2014) stabilized approach criteria but also in the oversight of air carrier pilot training programs.
Safety Management Systems managers could use the results of the study to improve SRM effectiveness, as required under 14CFR Part 5. Because SMS programs have traditionally relied on hazard identification using accident and incident reports rather than proactive measures, predictive capabilities could be beneficial. The ability to predict UARM could provide SMS managers with a predictive tool that would enhance safety risk mitigation effectiveness.
Research Questions
The study was exploratory and data-driven in nature, based on the following research questions (RQ):
• RQ 1: How can the application of data-mining and machine learning techniques to recorded flight data be used to predict the probability of Unstable Approach Risk Misperception by the pilot?
• RQ 2: What flight data variables are the most important predictors of pilot
misperception of a runway excursion hazard as evidenced by continuing an unstable approach to a landing?
Delimitations
Exceedance criteria described in FAA AC 120-71A were considered the threshold for determining an unstable approach. Reference approach speed criteria excluded Category A approach speeds (i.e. ≤ 90 knots), as that category generally applies to helicopters (no stall speed) and light GA airplanes certified under 14 CFR §23.49 (FAA, 2012).
Limitations and Assumptions
Limitations. The data were limited to the 186 flight variables provided by the NASA public access website for four years (2001-2004) of flight operations by 35 regional jet aircraft. No data were available regarding passenger configuration, which is used by the FAA to describe regional jet commercial aircraft (less than 100 passengers) (FAA, 2005). Because CVR data were not available for the study, CRM influence on pilot misperception could not be analyzed. Additionally, pilot/automation interface was also not available. Because only FDR aircraft state data were available, the study could
not consider any other variables that may have contributed to pilot UARM, such as weather (e.g. turbulence, wind shear, cross-winds), emergency or abnormal conditions (e.g. low fuel, engine or flight control anomalies), runway conditions (e.g. contamination with snow, water, lights) or visual illusions. In addition to weather considerations, day/night flight conditions were not provided and as such, were not considered in the analysis. No data were available to indicate if any of the approaches resulted in an actual runway excursion.
Assumptions. The 186 flight data variables were sufficient to develop predictive models. The data were redacted for any identifying information such as specific air carrier, aircraft type, airports, and name/type of instrument approach, hence assumptions pertaining to certain approach parameters such as approach speed, glideslope and landing configuration were made. Because FAA guidelines have allowed for more restrictive criteria to be developed by an air carrier, it was assumed that the air carrier had an SOP that followed the FAA stable approach guidance at least as restrictive as those criteria defined in AC 120-71A. Although there was no regulatory definition of regional jets, the FAA used a passenger configuration of less than 100 passengers to describe RJs in AC 150/525-4b, Runway Length Requirements for Airport Design (FAA, 2005). It was assumed that the flight data were sampled from RJs configured for less than 100 passengers.
Approaches were assumed to be conducted on a three-degree glideslope, and any flap setting greater than zero was assumed to be a proper landing configuration. Pilot indications of stabilized approach criteria were assumed to be provided with standard transport aircraft flight instruments. For example, descent rate, airspeed, and glidepath
indications were assumed to be provided to the pilots on industry standard pilot display technology, such as electronic flight instrument systems (EFIS), primary flight display (PFD) and navigational display (ND) avionics. Target reference approach speed range was assumed to be from 105 to 140 knots indicated airspeed and was based on FAA approach category airspeed determination characteristics detailed in Title 14 CFR, Chapter I, Subchapter F, Part 97, Subpart A., § 97.3 (FAA, 2012). Additionally, target approach speed was assumed to be calculated based on a zero-wind condition. Pilots flying the aircraft represented in the study were fully qualified professional pilots. Summary
The FAA and NTSB have identified unstable approaches as one of the primary contributory factors to runway excursion hazards (FAA, 2014; NTSB, 2000, 2001, 2014, 2014, 2016, 2019b). In the effort to enhance runway safety, the FAA has stipulated that operators adhere to criteria defining stable approaches (FAA, 2003, 2014). Data
indicated that although unstable approaches still occurred, pilots may not have always followed the FAA guidance by performing a rejected landing (FAA, 2014; FSF, 2009).
Non-compliance, whether intentional or not, of FAA approved air carrier
OPSPECS and SOPs concerning stabilized approaches, suggested a lapse in pilot ADM, and often had been included as a primary contributory factor in accidents and incidents involving runway excursions (NTSB, 2016, 2019b). With the advent and deployment of advanced digital data recording devices, required under 14CFR §91.609 for all air carriers with an operating certificate, opportunities exist to sample and analyze recorded flight data. Concurrently, recent developments in complex mathematical machine learning algorithms have improved research capability regarding the analysis of these
flight data (Oehling & Barry, 2019). Data mining techniques, both exploratory and predictive, have provided aviation researchers the tools necessary to both analyze these large flight data and also to predict abnormal flight occurrences.
The results of the study present an example of aviation research using machine learning to predict Unstable Approach Risk Misperception. Subsequent chapters present a review of relevant peer-reviewed research, including gaps in the literature. Six machine learning algorithms were used for the analysis to identify which most accurately modeled the prediction of the probability of pilot misperception of runway excursion risk, as well as to identify the stabilized approach criteria flight variables associated with frequent non-compliance of rejected landing guidelines. Finally, recommendations for further research are made, based on how large flight data monitoring can be used to improve and enhance aviation safety through training, procedures, and aircraft flight instrument design.
Definitions of Terms
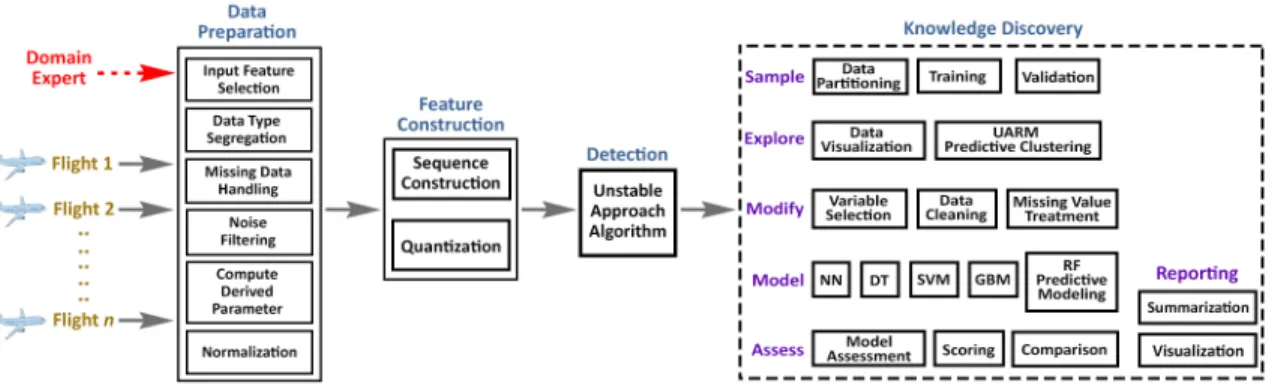
AVSKD Aviation Safety Knowledge Discovery Process. The process of analyzing aviation data, beginning with the collection of raw FOQA or FDM data via aircraft flight data recorders, though several phases: data preparation, detection, feature selection, and knowledge discovery. For the purposes of the research study, the AVSKD process concludes with the assessment of predictive models, as described in Chapter III (Mathews et al., 2013).
Data Mining Data mining is the set of methods and techniques for exploring and analyzing large data sets, in order to find certain unknown or hidden rules,
associations or tendencies. It is the art of extracting information (knowledge) from the data. For the purposes of the study, predictive data mining techniques are used to extrapolate new information based on the present information (Tufféry, 2011, p. 4).
Decision Tree A decision tree represents a hierarchical
segmentation of the data and is composed of a set of rules that can be applied to partition the data into disjoint groups (Sarma, 2013, p. 196).
Energy State Management The interrelationship between kinetic energy
(airspeed), potential energy (altitude), and chemical energy (power). Refers to pilot energy state
management technique options available for pilots to change or maintain a safe and stable energy state, including external factors and corrective techniques (FAA, 2017a, p. 3).
Gradient Boost Machine A form of ML technique, using ensemble learning, used in the construction of predictive models,
generally classification and regression. Typically, weaker decision trees are used in the ensemble. Neural Networks A neural network is a complex nonlinear function of
inputs, divided into different layers and different units within each layer. A large number of nonlinear functions can be generated and fitted to the data by means of different architectural specifications (Sarma, 2013, p. 362). This architecture can be based on that of the brain, organized in neurons and synapses, and takes the form of interconnected units (or formal neurons), with each continuous input variable corresponding to a unit at a first level, called the input layer, and each category of a qualitative variable also
corresponding to a unit of the input layer (Tufféry, 2011, p. 217).
Random Forest A form of ML learning, using ensemble learning for purposes of classification and regression. Builds models consisting of multiple decision trees for training and produces a mode of classes or mean prediction of the individual decision tree models. Runway Excursion This term is limited to veer off or overrun from the
landing, based mainly on an unstable approach (FAA, 2014).
SAS® Enterprise MinerTM SAS® Enterprise Miner™ is a software package consisting of different levels of data, such as textual or numeric, and was used for the construction and analysis of predictive models. SAS EM utilizes machine-learning algorithms that streamline the data mining process and create highly accurate predictive and descriptive models that are based on analysis of vast amounts of data (Sarma, 2013). Stabilized Approach Concept “A stabilized approach is characterized by a
constant-angle, constant-rate of descent approach profile ending near the touchdown point, where the landing maneuver begins” (FAA, 2003, Appendix 2, para 2). The energy state, landing configuration, aircraft location approach criteria are applied at 500 ft height above touchdown.
Standard Operating Procedures Aircrew procedures developed by an airline for normal, abnormal, and emergency procedure compliance to ensure safe, efficient, and on-time flight performance (Giles, 2013).
Support Vector Machine A machine learning model using algorithms that analyze data for classification and regression
analysis. SVMs can perform both linear and non-linear classification using the kernel trick. SVMs can be used in both supervised and non-supervised approaches, in addition to clustering techniques in data analysis (Lauer & Bloch, 2008).
Unstable Approach Risk Misperception Pilot lapses in aeronautical decision making occurring when evidence of an unstable approach exists, and the pilot elects to continue the approach to a landing, risking a runway excursion (FAA, 2014).
List of Acronyms
AC Advisory Circular
ADM Aeronautical Decision Making
ADMS Aircraft Diagnostic and Maintenance System
ADS-B Automatic Dependent Surveillance-Broadcast
AGL Above Ground Level
AOM Aircraft Operating Manual
ASPM Aviation System Performance Metrics
ASRS Aviation Safety Reporting System
AVSKD Aviation Safety Knowledge Discovery Process
BADA Base of Aircraft Data
BCA Boeing Commercial Airplanes
CART Classification and Regression Tree
CAST Commercial Aviation Safety Team
CEDAR Comprehensive Electronic Data Analysis and Reporting
CFR Code of Federal Regulations
CI Cost Index
CRM Crew Resource Management
CVR Cockpit Voice Recorder
DH Decision Height
DWH Data Warehouse
EFIS Electronic Flight Instrument System
FAA Federal Aviation Administration
FDM Flight Data Monitoring
FDR Flight Data Recorder
FOQA Flight Operations Quality Assurance
FSF Flight Safety Foundation
GA General Aviation
HAS Hazardous Attitude Scale
HBAT Handbook Bulletin for Air Transportation
HIP Human Information Processing
IATA International Air Transport Association ICAO International Civil Aviation Organization
ILS Instrument Landing System
IMC Instrument Meteorological Conditions
LOSA Line Operations Safety Audit
MKAD Multiple kernel anomaly detection
ML Machine Learning
MLM Multilevel Modeling
MTS Multi-variate Time Series Search
NAS National Airspace System
NASA National Aeronautics and Space Administration
ND Navigational Display
NOAA National Oceanic Atmospheric Administration NTSB National Transportation Safety Board
OPSPECS Operations Specifications
PFD Primary Flight Display
POI Principal Operations Inspector
RE Runway Excursion
SA Situation Awareness
SMS Safety Management Systems
SOP Standard Operating Procedures
SVM Support Vector Machine
TAWS Terrain Awareness and Warning System
TEM Threat Error Management
UARM Unstable Approach Risk Misperception
UPS United Parcel Service
VFR Visual Flight Rules
VIPR Vehicle Integrated Prognostics Reasoner
VMC Visual Meteorological Conditions
CHAPTER II
REVIEW OF THE RELEVANT LITERATURE
The following chapter presents a review of extant literature pertaining to the topic of the research and consists of three sections: (a) FAA guidance for stabilized
approaches, (b) a review of data and text mining methodologies in aviation research, and (c) a description of the machine learning algorithms and data processing techniques that were applied in this research.
Federal Aviation Administration Guidance for Stabilized Approaches
The FAA has asserted that stabilized approaches are one of the most important factors in safe landings. One of the products that resulted from a working group study by the Commercial Aviation Safety Team was the creation of FAA Advisory Circular (AC) 120-71A: Standard Operating Procedures for Flight Deck Crewmembers (2003). In this AC, the FAA describes a stabilized approach as one in which all landing checklists and approach procedures have been completed, the aircraft is in landing configuration, on constant rate of descent, with the engines providing stable thrust, and in a position to make a normal landing on the runway in use. Appendix 2 of the AC provides other specific details of a stabilized approach:
• Flight should be stabilized by 1000’ Height Above Touchdown (HAT) in
Instrument Meteorological Conditions (IMC) and by 500’ HAT in Visual Meteorological Conditions (VMC).
• The airplane is on the correct track.
• The airplane is in the proper landing configuration (i.e. landing gear, flaps and slats, and speed brakes).
• After glide path intercept, the pilot flying requires no more than normal bracketing corrections to maintain the correct track and desired profile (3° descent angle, nominal) to landing within the touchdown zone.
• The airplane speed is within the acceptable range specified in the approved operating manual used by the pilot (e.g. Vref).
• The rate of descent is no greater than 1000 feet per minute (fpm).
• If an expected rate of descent greater than 1000 fpm is planned, a special approach briefing should be performed.
• Power setting is appropriate for the landing configuration selected and is within the permissible power range for approach specified in the approved operating manual used by the pilot (p. A2.1)
The FAA (2003) allows for nominal bracketing adjustments related to engine thrust, descent rate and angle of bank. Recommended ranges allow for more restrictive limitations, but are provided as follows:
• Angle of bank less than 30°
• Descent rate ± 300 fpm from target
• Operator specified thrust management, per flight manual
• Momentary exceedances are acceptable, but continuous exceedance is not considered acceptable (p. A2.2).
In the aftermath of the accident involving American Airlines Flight 1420 on June 1, 1999, the NTSB (2001) recommended that the FAA further define stabilized approach criteria. In response to the NTSB recommendations, the FAA provided a brief
approach gates could be customized by a carrier as milestone points in which flight crew are to assess performance criteria during an approach, in order to maintain situation awareness concerning stabilized approach indications. These approach gates are
predetermined intervals at which the flight crew compare aircraft glidepath, lateral track, and airspeed data against stabilized approach criteria. It is at these intervals where the flight crew must use the information determined from the stabilized approach criteria to make the decision to either continue the approach to landing or to execute a rejected landing (NTSB, 2001).
The FAA assigns a Principal Operations Inspector (POI) to provide regulatory oversight and guidance to each air carrier. Among other functions, the POI applies federal oversight to the carrier on the stabilized approach concept stated in FAA Order 8900.1 (2007) as follows:
• Airspeed within 5 knots of approach speed at the 100-foot decision height (DH),
• The flight deck remains within the lateral confines of the runway at the 100-foot DH,
• After passing the outer marker (OM), the glidepath deviation does not exceed one half of full deflection, and
• After passing the middle marker (MM), no unusual changes in aircraft occur. (p. 4-221)
Turbojet aircraft operators must incorporate procedures that are based on
stabilized approach criteria set forth in FAA Order 8900.1, as well as the recommended guidelines provided in FAA AC 120-71A (subsequently AC 91-79A). Additionally,
operator standard operating procedures (SOPs) may incorporate more restrictive stabilized approach criteria than that provided by FAA guidance from these two documents. Each carrier must provide flight crew training and SOP materials which contain a description of acceptable deviations from glidepath and lateral track when covering approach and landing procedures. Once the operator's training programs are approved by the FAA, the carrier is not free to revise these procedures without approval from their POI.
The purpose of the approach gate criterion is to provide the flight crew with target values to fly, as displayed on flight deck instruments (to assess the feasibility and safety of continuing the approach to landing or to execute a rejected landing). In its report on AA Flight 1420, the NTSB notes that the pilots should have executed a rejected landing during the final approach, when stabilized approach criteria were not met. The failure of the flight crew to configure the landing flap configuration before reaching 1,000 feet AGL, and their failure to maintain a normal rate of descent, combined with deteriorating weather conditions, decreased the safety margin enough that the pilots should have executed a rejected landing (NTSB, 2001).
Unstable approaches and runway excursions. The NTSB (2013) presents additional details on the importance of ADM in the rejected landing process in its report on the accident involving an Embraer 505 regional jet. The NTSB listed the primary contributory cause of the accident as failure of the pilots to execute a rejected landing when faced with evidence of an unstable approach. The correct approach reference speed was 110 knots indicated airspeed (KIAS), and the FDR data indicated that an actual approach speed of 158 KIAS was flown. The approach speed exceedance contributed to
a RE as the aircraft experienced a runway overrun, resulting in destruction of the aircraft. Runway excursion caused by unstable approach landing was stated as the primary
contributory factor in this accident, as well as approximately 10 other accidents and incidents per year from 2005 to 2016 resulting in the NTSB issuing Safety
Recommendations A-08-16 through A-08-20 (FAA, 2014a, 2014b; NTSB, 2016). These Safety Recommendations detailed significant deficiencies in industry-based initiatives mitigating the risk of runway excursions with pilot training substantiated with evidence presented in NASA ASRS pilot reports (NTSB, 2008).
Several recent examples of accidents with UARM-like contributory factors are described by the NTSB:
• Asiana Air Flight 214 crashed at the San Francisco International Airport, due to a RE caused by exceedance of glidepath stabilized approach criteria. The accident resulted in destruction of the Boeing 777 as well as fatal injuries to three
passengers (NTSB, 2014).
• UPS Flight 1354 crashed while attempting an approach to landing at the Birmingham-Shuttlesworth International Airport, Birmingham, Alabama in August 2013. The NTSB lists the primary cause of the accident as the flight crew continuing an unstable approach to landing, resulting in destruction of the Airbus A300 as well as fatally injuring the sole occupants, the two pilots. The NTSB reports that the A300 exceeded stable approach criteria based on incorrect landing configuration and excessive glidepath deviations, resulting in the aircraft
• Federal Express (FedEx) Flight 14 crashed during landing at the Newark
International Airport, Newark, New Jersey in July 1997, resulting in destruction of the McDonnell Douglas MD-11The NTSB states that the probable cause of the accident was the Captain’s lapse in ADM, continuing a landing with evidence of exceedance of stabilized approach criteria (i.e. excessive descent rate). The unstable approach resulted in a hard landing, bounce, loss of control, and ultimately a RE (NTSB, 2000).
These examples of lapses in aeronautical decision making, which result in the occurrence of UARM and REs, provide evidence of an aviation hazard. Large amounts of flight operations data have been collected with the advent of Flight Data Monitoring technologies. The evolution of advanced and complex data processing algorithms has provided aviation researchers with the opportunity to explore what patterns or
relationships might exist in these large flight data.
Pilot risk perception and risk tolerance. A key point in the study is the
prediction of pilot risk misperception. The FAA (1991) relates pilot risk management to task accomplishment in AC 60-22, Aeronautical Decision Making, with the
self-assessment technique of asking oneself “Is the success of the task worth the risk?” (p. 22). Orasanu et al. (2001) describe a relative lack of aviation research on pilot risk perception and risk tolerance. The researchers continue to describe the importance of better understanding of pilot risk perception and risk tolerance in the ADM process. Martinussen and Hunter (2010) assert that pilot risk assessment and management are crucial aspects of pilot ADM. They then define pilot risk perception as “recognition of the risk inherent in a situation” (p. 198). Hunter (2005) professes that pilots can be prone
to display poor risk judgement and substantially underestimate risk. The researcher’s conclusions are based on evidence of pilots pressing on when faced with evidence of deteriorating performance conditions, while underestimating the impact of external factors to the aircraft and overestimating their self-capacity to accomplish certain tasks. The conclusions of Hunter (2005) are in agreement with those reached by both Orasansu et al. (2001) and Dismukes (2010) regarding the propensity of pilots to exhibit lapses in ADM regarding continuation bias (i.e., pressing on or continuation errors). Hunter (2005) states that risk perception can be mediated by both pilot self-assessment, as well as more accurate mental modeling of the environment. Martinussen and Hunter (2010) conclude that risk perception is primarily a cognitive activity and involves the accurate perception and projection of aircraft state and external factors, and the resulting mental model, to maintain a high level of situation awareness.
Hunter (2005) provides further evidence of pilot risk perception measurement using a Hazardous Attitude Scale (HAS). Airline pilots were presented with 10 different aviation scenarios and provided alternative solutions to assess ADM. Hunter concludes that poor risk perception was a more significant variable than poor risk tolerance. For example, pilots who experienced significantly more hazardous events generally rated hazardous scenarios less risky than those pilots who had experienced fewer hazardous events. Hunter subsequently deduces that poor correlation between pilot hazardous experiences and estimation of risk supports this supposition.
Hunter (2005) further expands the definition of pilot risk perception as the
cognitive ability of the pilot to appraise and discern risk, while involved in the process of formulating an environmental mental model. The researcher goes on to describe the