Wide-Area Internetworks
The Harvard community has made this
article openly available.
Please share
how
this access benefits you. Your story matters
Citation Gwertzman, James. 1995. Autonomous Replication in Wide-Area
Internetworks. Harvard Computer Science Group Technical Report TR-17-95.
Citable link http://nrs.harvard.edu/urn-3:HUL.InstRepos:25691717
Terms of Use This article was downloaded from Harvard University’s DASH
repository, and is made available under the terms and conditions
applicable to Other Posted Material, as set forth at http://
nrs.harvard.edu/urn-3:HUL.InstRepos:dash.current.terms-of-use#LAA
Internetworks
James Gwertzman
TR-17-95
April 1995
Center for Research in Computing Technology
Harvard University
A Thesis presented by
James Gwertzman
to
Computer Science
in partial fulllment of the honors requirements for the degree of
Bachelor of Arts Harvard College Cambridge, Massachusetts
The number of users connected to the Internet has been growing at an exponential rate, resulting in similar increases in network trac and Internet server load. Advances in microprocessors and network technologies have kept up with growth so far, but we are reaching the limits of hardware solutions. In order for the Internet's growth to continue, we must eciently distribute server load and reduce the network trac generated by its various services.
Traditional wide-area caching schemes are client initiated. Decisions on where and when to cache information are made without the benet of the server's global knowledge of the situation. We introduce a technique|push-caching|that is server initiated; it leaves caching decisions to the server. The server uses its knowledge of network topology, geography, and access patterns to minimize network trac and server load.
The World Wide Web is an example of a large-scale distributed infor-mation system that will benet from this geographical distribution, and we present an architecture that allows a Web server to autonomously repli-cate Web les. We use a trace-driven simulation of the Internet to evaluate several competing caching strategies. Our results show that while simple client caching reduces server load and network bandwidth demands by up to 30%, adding server-initiated caching reduces server load by an additional 20% and network bandwidth demands by an additional 10%. Furthermore, push-caching is more ecient than client-caching, using an order of magni-tude less cache space for comparable bandwidth and load savings.
To determine the optimal cache consistency protocol we used a generic server simulator to evaluate several cache-consistency protocols, and found that weak consistency protocols are sucient for the World Wide Web since they use the same bandwidth as an atomic protocol, impose less server load, and return stale data less than 1% of the time.
Contents
1 Introduction
3
1.1 Push-Caching: : : : : : : : : : : : : : : : : : : : : : : : : : :
5 1.2 Assumptions: : : : : : : : : : : : : : : : : : : : : : : : : : :
7 1.3 Thesis Roadmap: : : : : : : : : : : : : : : : : : : : : : : : :
7 1.4 A Note on Terminology: : : : : : : : : : : : : : : : : : : : :
82 Related Work
9
2.1 Distributed File Systems
: : : : : : : : : : : : : : : : : : : : :
102.2 Internet Caching Schemes
: : : : : : : : : : : : : : : : : : : :
132.3 Resource location
: : : : : : : : : : : : : : : : : : : : : : : : :
152.4 Internet Analysis
: : : : : : : : : : : : : : : : : : : : : : : : :
163 The Case for Push-Caching
19
3.1 Web-Trace Analysis
: : : : : : : : : : : : : : : : : : : : : : :
203.2 Static Mirroring is Unlikely to Work
: : : : : : : : : : : : : :
233.3 Deriving Network Topology
: : : : : : : : : : : : : : : : : : :
254 Experimentation
31
4.1 Simulator Design Goals
: : : : : : : : : : : : : : : : : : : : :
314.2 Simulator Implementation
: : : : : : : : : : : : : : : : : : : :
324.3 Simulator Parameters
: : : : : : : : : : : : : : : : : : : : : :
375 Simulator Results
45
5.1 Caching-strategyand Lookup-strategy
: : : : : : : : : : :
455.2 Push-threshold
: : : : : : : : : : : : : : : : : : : : : : : : :
515.3 Server-number
: : : : : : : : : : : : : : : : : : : : : : : : : :
545.4 Pages-to-Push
: : : : : : : : : : : : : : : : : : : : : : : : : :
575.5 Client-initiated caching vs. Push-caching
: : : : : : : : : : : :
605.6 Proxy-caching vs. Push-caching
: : : : : : : : : : : : : : : : :
655.7 Push-Caching Scalability
: : : : : : : : : : : : : : : : : : : : :
676 Consistency Control
70
6.1 Related Work
: : : : : : : : : : : : : : : : : : : : : : : : : : :
716.2 Cache Consistency Simulator
: : : : : : : : : : : : : : : : : :
726.3 Trace-driven Simulator Modications
: : : : : : : : : : : : : :
756.4 Conclusion
: : : : : : : : : : : : : : : : : : : : : : : : : : : :
797 Conclusion
84
7.1 Future Work: : : : : : : : : : : : : : : : : : : : : : : : : : :
85 7.2 Availability: : : : : : : : : : : : : : : : : : : : : : : : : : : :
85 7.3 Appreciation: : : : : : : : : : : : : : : : : : : : : : : : : : :
86A Group Communication
87
A.1 Weak Consistency Group Communication
: : : : : : : : : : :
87A.2 Service Replication
: : : : : : : : : : : : : : : : : : : : : : : :
89Bibliography
94
Introduction
Note: we are currently experiencing severe network problems on our 256 Kb/s school Internet connection. Please be understand-ing! I am still looking for a site willing to mirror the WebLouvre exhibit (30 Mb in all), preferably in the USA. |WebLouvre[31].
Trac on the Internet1 has been growing at an exponential rate for
sev-eral years, but so far network technology has kept pace. There have been few growing pains, and bandwidth today is still plentiful despite annual pre-dictions that the Internet is on the verge of collapse. We fear, however, that Internet growth is accelerating, and we believe that more ecient caching techniques are required to conserve Internet bandwidth and to allow Internet information servers to keep up with demand.
Table 1.1 summarizes the Internet's growth over the past few years, and also charts the growth of a relatively young Internet service, the World Wide Web [1]. Practically non-existent in 1991, the Web has grown in only 3 years to account for 23% of the total Internet trac, 8% of that trac in the last three months alone. The Web is popular, not only for the ease with which it allows information to be published, but also for the ease with which it allows information to be viewed.
Using Web client software, a click of the mouse can move megabytes of data across countless network hops. This ease of use has proven quite popular, and millions of new users are signing up to access the Web through online services.
1A glossary is provided for readers unfamiliar with certain technical terms used in this
thesis.
Date Total Trac (Gb) WWW Percentage (bytes) 12/91 1900 0.00% 12/92 4300 0.02% 12/93 8200 2.21% 12/94 16,000 15.98% 3/95 20,239 23.88%
Table 1.1:
Summary of Internet growth.
Notice that while trac over theInternet only doubled last year, the percentage of that trac for which the World Wide Web is responsible grew by a factor of 9.
The only problem with the Web is that it is inherently inecient because it operates for the most part as a cache-less distributed system. When two clients retrieve a document from the same server, the document is transmit-ted twice, regardless of the two clients' proximity. This places more load on the server and uses more network capacity than is strictly necessary.
Some Web browsers have addressed this problem by adding local client caches. These caches store copies of data, allowing a client to re-access a previously viewed document without having to transfer it across the network again. Another approach to reducing server load and network bandwidth usage is the deployment of Web proxies [25, 29] that allow many clients to share one nearby cache. Since these clients all request their documents through the proxy cache, a given document only has to be transferred once across the Internet in order for many clients to view it.
The problem with both of these solutions is that they are myopic. A client cache does not reduce trac to a neighboring computer, and a proxy cache does not reduce trac to a neighboring proxy. Furthermore, these caches are typically limited in size: 5Mb for a client cache, and 100Mb-2Gb for a proxy cache are typical values. Disks might be inexpensive, but disk space will always be a limited resource, the growing use of multimedia on the Web means that les are growing larger, and local caches will only be able to cache the most popular items, resulting in many copies of the most popular items but no copies of only slightly less popular items.
A better solution would allow clients to share cache space cooperatively. The degree to which a le is replicated should be proportional to that le's global popularity, and objects should be cached where clients can reach them most eciently. A system can achieve both goals by relegating caching
decisions to the server. A server has the ability to monitor the request stream and decide both when and where objects should be cached. In making these decisions, the server can take advantage of its understanding of the network topology and the le's access history to maximize bandwidth savings and reduce load. No existing caching technique satises all these constraints, however, so we found it necessary to create our own.
1.1 Push-Caching
The goal of this work is to understand the access patterns observed in to-day's systems and evaluate a new, server-initiated caching policy that we have named push-caching. Servers record their access histories and use this information to decide where to place replicas of their data. We envision a network infrastructure with thousands of push-cache servers onto which les may be pushed. These push-cache servers may be created in an orga-nized manner, but they may also be created in a grass-roots manner such as that which has driven Internet development to date. This infrastructure will of necessity be dynamic with push-cache servers added and removed on a continuous basis.
A centralized registry service tracks available push-cache servers, helping servers decide where to replicate their objects by providing a list of available
push-cache servers on demand. This can be as simple as selecting
n
serversrandomly from its list of all participating push-cache servers. The registry will be discussed more thoroughly in section 5.7.
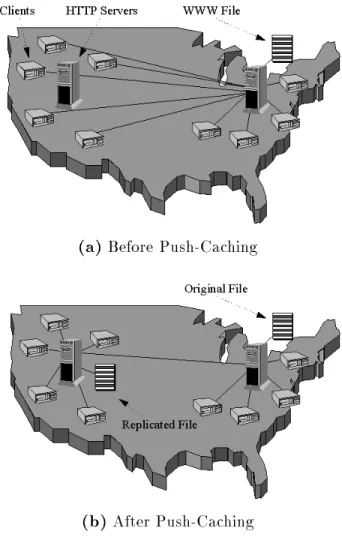
Figure 1.1 provides an illustration of push-caching in action, and demon-strates the two independent parts to a push-caching system. The server on the east coast experiences a great demand for its les, so it must decide when and where to replicate its les. Once the le is replicated west coast clients must eciently locate the nearest copy of the les to access.
The optimal cache solution may be found with a perfect knowledge of network topology (i.e. which hosts are in close network proximity) and the access history of the documents in question. Topology information is not widely available on the Internet, however, so we also explore alternative ways to generate it using geographical information.
Although we limited this study to World Wide Web access, the algo-rithms and analyses are easily extended to any wide-area, distributed infor-mation system. Push-caching is especially applicable to applications such as video-on-demand that require large les to be eciently and autonomously
(a)
Before Push-Caching(b)
After Push-CachingFigure 1.1:
Visualization of push-caching.
(a) Several clients accessing aWorld Wide Web le on the east coast. (b) The le has been replicated onto a west coast server so as to minimize network bandwidth, and now all west coast clients request the le from the west coast server.
distributed around a wide-area network such that bandwidth and latency are minimized. Server-initiated caching can also help solve the replication problems plaguing information services such as Archie [14], since we envision that scripts implementing these services may be replicated and distributed as easily as more traditional static objects.
1.2 Assumptions
We have made several assumptions in pursuing this work. We have assumed that the network on which this system will be built is unreliable, and that there is no guarantee that two arbitrary hosts will always be able to commu-nicate. Given the unreliable nature of the Internet this is not a pessimistic assumption. We have also assumed a weak-consistency model for caching where data updates are not propagated to all replicas simultaneously; it is acceptable to occasionally provide stale data to clients as long as guarantees are made regarding how out-of-date data is allowed to become. We will prove the validity of this assumption in chapter 6.
Finally, we have assumed that ownership of a le is limited to one ma-chine. Changes to a le can only be made by that le's owner, or primary host. This is a characteristic that distinguishes wide-area information sys-tems from distributed le syssys-tems or other distributed syssys-tems with multiple write privileges. The primary host model simplies the protocols because there is no need to grant or revoke write privileges, thereby helping to insure that push-caching will scale to millions of hosts.
1.3 Thesis Roadmap
Chapter 2 will discuss other research that has inuenced our work, and place our investigations in context. Chapter 3 provides a motivation for our work, discussing several studies we performed to validate our initial assumptions. Chapter 4 discusses the trace-driven simulator we built to investigate push-caching in depth. Chapter 5 explores our results including a discussion of scalability. Finally, chapter 6 investigates various cache-consistency protocols, and chapter 7 concludes this work, summarizing our results and discussing the questions that still remain. Appendix A provides related works information that is important for distributed services but that does not directly aect push-caching.
1.4 A Note on Terminology
Throughout this document we will try to be consistent in our use of ter-minology. All of the various items available through the World Wide Web such as articles, pictures, les, etc. will be referred to as objects. The terms World Wide Web and Web will be used interchangeably, and they refer to the same thing. We distinguish between Web clients, Web servers, and push-cache servers. A server oers objects over the Web, and a client re-trieves them. Servers push replicas of their objects onto push-cache servers, and push-cache servers may also push objects onto other push-cache servers. Finally, a host is any computer that is connected to the Internet: clients, servers, and push-cache servers included.
Throughout this document we will also make frequent references to the Internet; The Internet is a collection of many smaller networks, dubbed sub-nets. Subnets are connected to regional service providers that span specic geographic areas. Harvard, for example, is connected to NEARNet, the re-gional service provider for New England. These rere-gional service providers are connected together by backbone networks: extremely high-speed net-works that span the globe.
Related Work
Little research has been performed directly on large-scale autonomous repli-cation; only in the past few years have researchers begun assembling such systems [5]. There has, however, been a great deal of research on the various components of such a system, such as data caching and resource location. We anticipate that in the next few years we will witness a convergence among distributed systems research toward large-scale autonomous replication as large-scale systems such as the World Wide Web become more ubiquitous. Traditional client caching, for example, has slowly been giving way to more aggressive types of client caching, and recent cache consistency research has focused on increasingly sophisticated ways to update caches.
This chapter discusses current research into the various elds that have inspired large-scale autonomous replication. Section 2.1 examines distributed le systems, and section 2.2 considers recent applications of older distributed le system research. Section 2.3 covers research into locating nearby Inter-net resources of interest, and nally, section 2.4 discusses recent InterInter-net surveys. We delay analysis of cache consistency protocols until chapter 6, where we examine consistency research in greater detail, and we include a description of group-communication research in Appendix A. This research does not directly apply to the work performed for this thesis, but is neces-sary for eciently maintaining a large, shared database such as that used by the proposed registry of push-cache servers.
2.1 Distributed File Systems
Much of the current research in autonomous replication has been heavily inuenced by the caching subsystems of distributed le systems. Ecient operation of a large-scale distributed le system depends on caches to reduce the load on le servers; systems like Sun's NFS [27, 26] that do not rely on long-term caches cannot support more than a few hundred clients, whereas systems like xFS [35] that distribute server load among clients are designed to scale to many thousands of clients.
The challenge of oering distributed access to a wide-area information system is almost identical to that faced by a large-scale distributed le sys-tem; some researchers have proposed making this relation explicit [33] by actually serving les from the Web over a wide-area distributed system like the Andrew File System [28]. This idea is still contentious, because the semantics of the World Wide Web may not match those of a distributed le system. File systems, for example, need to rapidly create and destroy very small les that will never be shared by multiple users. The Web, on the other hand, needs to provide rapid access to many les from across the entire Internet. Very few of these les are local. We can nevertheless learn much from the distributed le system community about building large-scale systems since many of the scalability concerns are the same. In the next section we discuss the large-scale distributed le system designed by Blaze as part of his doctoral dissertation.
2.1.1 Large-Scale Hierarchical File Systems
The goal of Blaze's thesis [4] was to design a distributed le system that could scale to a very large size, operating across the Internet. He achieved this goal by building a hierarchical system where clients can not only cache items indenitely but can also serve them to other clients.
Blaze introduces four types of scale that a successful system must ad-dress: population, trac, administrative, and geographic. Each type has its own set of issues. Scaling with population requires a system to cope with growth in the total number of potential clients and implies that a server should not need to store any information about its clients. Scal-ing with trac requires the ability to handle the workload generated by all clients. Scaling administratively implies an ability to span autonomous entities. Finally, coping with geographic scale requires the ability to span large distances, with the inherent latency implied therein.
The Web in its current form addresses these by eliminating many of the frills associated with distributed le systems such as caching and write-sharing. Our challenge is adding an optimized caching system to the Web without reducing its ability to scale along these lines.
Before designing his system, Blaze gathered traces from an NFS server to determine optimal cache strategies for his distributed le system. The most important trend that emerged is that les tend to display strong inertia, meaning that the same les tend to be opened again in the same mode by the same user. Blaze found, for example, that keeping a le in a le system client cache for two hours resulted in an average hit rate of over 66%.
Blaze also found that most les are overwritten while still very young. If a le is not changed soon after creation, the probability of its ever being changed drops quickly. Files therefore move rapidly toward a state of being read-only, and Blaze found that shared read-only les are even less likely to be written to than private read-only les. Finally, les opened for reading by other machines are likely to be opened for reading by still others. These results imply that cache sharing will work well for a distributed le system because it is unnecessary to update shared-read les often. We will see that a similar analysis drives the Alex FTP cache as well, and in chapter 6 we will see that these results also apply to the World Wide Web since Web les that are globally popular changes less often than those that are primarily used locally.
Blaze analyzed a variety of dierent caching schemes. Flat le systems, where all clients connect to the same server, inevitably suer from a bottle-neck eect. Eventually the single server is unable to cope with the connected clients. Even with optimal client caching strategies the server must still deal with 8-12% of the original trac, and as the system grows this will eventu-ally overwhelm any server. Such systems include not only le systems such as NFS, but also the existing World Wide Web.
The solution is to distribute load among several servers. This is tradi-tionally done through a xed hierarchy, where a client does not request les directly from the primary host, but rather from one of several intermediate servers. If the intermediate server does not have the le it forwards the request for the le on to the primary server.
There are problems with this solution, however. Replicating all primary server les on the intermediate servers is inecient, but caching items at intermediate servers as requests pass through them creates delays. Further-more, having an intermediate cache process all requests yields surprisingly little gain. Most objects not in the client cache were not in the intermediate
cache either. The answer is to look in the caches maintained by other clients: 60-80% of client cache misses were of les already in another client cache.
Blaze's architecture is similar to our push-cache architecture. In his system, servers record the identity of clients who request a given le. When a le receives too many requests the server stops serving the le directly and instead returns the list of clients who have accessed (and therefore cached) the le. Clients use this list to locate nearby replicas of a given le, storing the list of other clients in a name cache. We use a similar method, described in section 4.3.4, to locate replicated les on the Web.
We are unable to apply Blaze's work directly to the Web because it makes assumptions about clients that we cannot: that clients can function as servers, and that clients have sucient cache space to cache les on a long-term basis. The rst assumption is false because the majority of clients on the Web are personal computers that are not available 24 hours a day. The second is false because client caches are typically small, and because the Web encourages a browsing behavior that results in a rapid cache turnover of les. We improve on Blaze's work by not only removing these assumptions, but also by determining the optimal location for caching le replicas rather than relying on the arbitrary list of clients who have cached the le.
2.1.2 Alex
Another system from which we draw inspiration bridges the gap between data replication and distributed le systems and is called Alex [8]. Alex allows a remote FTP server to be mapped into the local le system so that its les can be accessed using traditional le operations. This is ac-complished through an Alex server that communicates with remote FTP sites through FTP, caches les locally, and communicates with the local le system through NFS. When the user wants to access a remote le, Alex downloads the le using FTP and then caches the le locally.
Alex's primary contribution is its cache-consistency mechanism. As we have already seen from Blaze's thesis, the older a le is the less likely it is to be changed. Therefore, the older a le is, the less often Alex has to poll to insure that its local copy is up-to-date. To avoid excessive polling, Alex only guarantees that a le is never more than 10% out of date with its reported age. As an example, if a le is 1 month old, then Alex will serve the le for
up to three days (10%30 days = 3 days) before checking to see if it is still
valid.
le updates, but because they do not have to be modied to perform more sophisticated invalidation techniques. In chapter 6 we nd that this cache-consistency scheme is applicable to the World Wide Web as well as to FTP. In the next section we examine Web proxies that extend the concepts of Alex to the World Wide Web by caching Web data just as Alex cached FTP data.
2.1.3 World Wide Web proxies
A World Wide Web proxy [25] caches Web data for a campus-sized network. They are also used by corporations who are protected by an Internet rewall and whose computers therefore cannot access the Web directly. The proxy accepts requests for Web documents from clients, retrieves and caches the documents, and then makes them available to its clients. When a client wants a document that is already in the cache the proxy can serve it without having to re-retrieve the same document.
The most popular Web browsers support proxies [29], and the HTTP protocol has provisions to help maintain cache consistency. If the proxy wishes to determine if its cached page is up-to-date, a lightweight protocol
exists known as the Conditional GET. A browser may make a getrequest
to the server that includes a timestamp, the If-Modied-Since eld. If the page has been modied since that time, the server will re-send the page. Otherwise the server will respond with a Not Modied message. Some proxies use a similar cache-consistency protocol to that used in Alex.
Netscape, a company that sells a commercial Web proxy, claims that a 2 or 3 gigabyte Web proxy can support thousands of internal users and can provide a cache hit ratio as high as 65%. Results such as these indicate that Web proxies can help alleviate some Web scalability concerns, and we will compare push-caching to proxy-caching in section 5.6. As we saw above with Blaze, however, even optimal proxy-caching will not help distribute server load suciently since proxies must still satisfy cache misses from the primary host.
2.2 Internet Caching Schemes
We are not the only researchers turning our attention toward saving Internet bandwidth. Another group that has been particularly vocal on these issues consists of Bowman, Danzig, Manber, and Schwartz [5, 12, 10, 11].
These researchers believe that the ideal caching architecture for the Inter-net is hierarchically structured, and they have already built a system called Harvest (see section 2.2.2) to test their ideas. We believe that their system will suer from the same limitations that caused Blaze to turn away from hierarchically structured caches, but they do not yet have data to conrm or deny our belief.
We agree with the Harvest group on other issues, however. They have stated that servers should be instrumented to help determine where to place additional replicas; we take that belief to its logical conclusion by designing a system where servers are not only instrumented, but can replicate their most popular objects without human intervention. The fact that our system is capable of this autonomous replication illustrates the primary advantage of a server-initiated caching system over a client-driven one such as their Harvest system.
The rest of this section explores the Harvest group's research in greater detail.
2.2.1 Caching FTP Objects
The primary motivation for the Harvest group's hierarchical cache is a study by Danzig, Hall, and Schwartz that shows that FTP trac across the In-ternet backbone could be reduced by 42% if le caches were installed in a hierarchical manner at strategic locations on the Internet [10]. Specically, they propose placing FTP caches at all juncture points between networks, such as between a backbone network and a regional network. Cache reso-lution would take place in a hierarchical fashion, with each cache satisfying cache misses from its parent, and so on, until the le is eventually retrieved from its home FTP server.
To compute the bandwidth savings of this caching, they used the metric of byte-hops where the cost of a FTP transfer is the size of the le in bytes times the number of network hops the le had to make. This is a useful metric for computing network cost, and we will use this metric in our own simulations.
Their results show a 42% reduction of FTP trac across the Internet backbone by adding these hierarchical caches, but we question the need for a hierarchical structure on the Web given the 65% bandwidth reduction of simple proxy-caching. For one thing, regional network level caches will need to be very large. For another thing, installing these caches in between regional networks and backbone networks will not be trivial, and it is unclear
who should manage these caches. Recall that Blaze stated that hierarchical caches are often not eective; the performance of Web proxies in the absence of any sort of hierarchical caching seems to justify this hesitation.
2.2.2 Harvest
The Harvest system [5] was designed to solve the problem of resource lo-cation, but also includes a hierarchical caching subsystem. This caching subsystem functions like a Web proxy in that clients request Web objects through the local Harvest cache. If the object is not in the cache, then the local cache in turn queries each of its neighbors, its parent, and the object's primary host looking for the object. Whichever host returns a \hit" fastest is the host from which the cache requests the object.
The most interesting feature of this system is that the client requests data from the host that responds most quickly. This is signicant because recent research from Bestavros' group at Boston University shows that la-tency on the Internet between two hosts varies signicantly, even over short time periods. If the goal is to reduce the latency seen by the client then this approach might be the most successful. Problems with the Harvest sys-tem have already been discussed; specically, the requirement that Harvest caches be deployed hierarchically.
2.3 Resource location
The nal component to large-scale autonomous replication is eciently lo-cating the nearest replica of a given le. It is easy to make a copy of a piece of data; deciding which copy to use is dicult. Resource location, for exam-ple, was the primary dierence between Blaze's distributed le system and a traditional distributed le system. Under his system, it was not necessary to satisfy a cache miss with the primary host. A host could locate a copy of a le in another host's cache.
Push-caching is similar to Blaze's system in that cache misses can be satised out of other caches; it is dierent in that the locations of these caches are computed so as to minimize network trac, and cache misses must be satised out of the closest cache. Our resource location scheme will therefore need to be able to locate the closest copy of the le.
Guyton and Schwartz are interested in discovering a nearby resource without any sort of centralized database whatsoever [19]. This diers from
earlier approaches such as that used in Grapevine for example [3] which required centralized shared databases.
2.3.1 Locating Nearby Copies of Replicated Internet Servers
Guyton and Schwartz try to determine how to choose among a collection of replicated servers such that the selection takes into account network topology [19]. They evaluated a variety of approaches using a network simulator, uncovering a number of tradeos between ease of deployment, eectiveness, network cost, and portability. They nally conclude that there is no obvious \best approach," but only a variety of compromises.
At the heart of this research is the fact that in the current Internet there is no magic black box to determine Internet topology. If this information were known, then optimal resource location would be not only possible but trivial, because this global Internet topology map could be consulted to determine exact host distances. The purpose of Guyton's and Schwartz's research is to determine the cost and eectiveness of approximating this information through various means; in section 3.3 we extend this research further by determining how well geographical information approximates In-ternet topology.
Guyton and Schwartz examine the variety of choices that distinguish between various resource discovery approaches, and conclude that each of these choices lies on a spectrum with ease of deployment/high network cost on one end, and dicult deployment/low network cost on the other. None are optimal, and only the least accurate scale in a manner appropriate to the World Wide Web. Route probing, for example, one of the most accurate methods, requires a measurement server to calculate the shortest path in a dense graph, a non-trivial calculation. If the eort is multiplied by the thou-sands of clients that would need to use such a service this option becomes infeasible. The fact that an ecient means for detecting Internet topology does not exist forces us to turn toward more radical solutions, such as using geography to predict topology.
2.4 Internet Analysis
No distributed wide-area system can be built without an analysis of the underlying Internet strata. A designer must understand the performance issues of the Internet in order to build as ecient a nal product as possible.
There have been a number of Internet studies; we describe here the most recent reports.
2.4.1 Web Trac Characterization
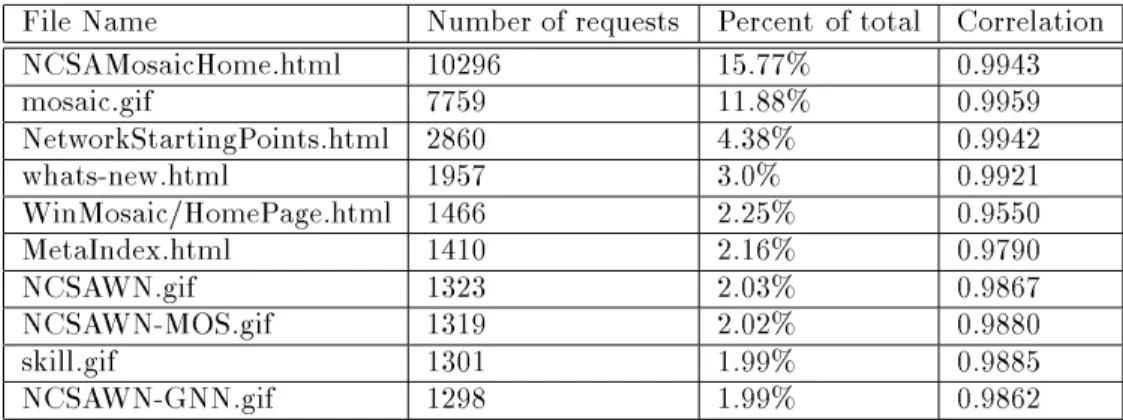
The Applied Network Research Group at the San Diego Supercomputer Cen-ter has been researching the InCen-ternet for years. They have recently turned their attention to the Web and they analyzed access logs from the NCSA server, a globally popular Web server, to show that geographic caching helps reduce network trac, latency, and server load [7].
The ANRG's research anticipates our own research since they provide motivation without implementation specics. They found that server over-loading is a growing problem for Web servers, but are afraid that solving the load problem will lead to more le requests which in turn will aggravate the network bandwidth consumption. Any solution to load balancing must distribute load so as to reduce the network bandwidth requirements.
The ANRG suggest that to help distribute loads, client preference for a cache site might be a function not only of location, but also of current network or server load. To determine how much network bandwidth could be saved by caching les geographically they performed a simulation driven by Web access logs, mapping Internet addresses to states or countries in order to determine geographic location.
The ANRG's proposed model divides the Internet into specic geo-graphic regions and places Web caches in each region. They evaluated the bandwidth savings due to such a system by assuming that all clients in a given region use that region's cache to satisfy their requests. The eciency of geographic caching is computed using an eciency factor of bandwidth savings in bytes divided by total cache size. Their simulations achieved at most an eciency factor of 7; we show in section 5.6 that push-caching can achieve eciency values of 700 or more, since push-cache servers know how popular the items are that they are caching, and therefore can set the amount of replication accordingly.
The ANRG also suggest that one way to solve the resource location problem is to modify a system called the Domain Name System (DNS) that is currently used on the Internet to translate between human-readable ma-chine names and computer-readable mama-chine names. They suggest adding to DNS the ability to look up nearby replicas of objects or services, dening \nearby" to include metrics like physical distance and number of network hops. Finally, they mention that no caching solution is complete without
taking into account le security and dierent levels of cache time-out for dierent types of data. We are particularly interested in the possibility of a modied DNS because it would allow us to avoid contacting the primary host in order to locate a nearby replica.
2.4.2 Web Availability and Latency
Viles and French studied the availability and latency of Web servers on the Internet [34]. Ideally all servers should be available 100% of the time, and should have latencies of 100ms or less. They found that in reality the Web does not live up to these ideals; most servers are on average only available 95% of the time, and the average latency is much higher, on the order of 500ms.
Viles and French suggest one possible way to improve server latency: implement a way for the client to request several documents at one time. This amortizes the cost of the TCP connection setup and takedown times over several documents instead of just one, since TCP costs turn out to be an
important factor for short documents.1 They do not address the availability
issue further.
Both of Viles' and French's ndings have bearing on our work, because autonomous replication should be able to solve both the availability issue and the latency issue. By replicating objects availability is improved, be-cause a single server failure no longer eliminates all access to that server's objects. Latency is improved as well if network topology and access history are both considered when deciding where to cache objects. When nearby ob-ject replicas are available clients will observe decreased latencies in accessing those objects relative to accessing more distant replicas.
1The TCP protocol is used to insure reliable packet delivery across the unreliable
The Case for Push-Caching
Client-based caching is popular on the Web because it is easy to implement, and because it provides signicant bandwidth and latency savings. We are investigating push-caching because there is, unfortunately, an inherent limit to the amount of bandwidth and server load reduction possible with client caching.
Even if every Web site was using a Web proxy, it would still be possible for a site to become swamped if a large number of proxies try to access a specic object at the same time. This is not a rare condition; a current Web
service known as the Cool Site of the Day is very popular [13]. Each
day it lists a \cool" Internet site that subsequently receives so much trac that it often becomes swamped. Push-caching is initiated by the server; it alleviates this problem by autonomously replicating the \cool" site's data when load at that site dramatically increases. Push-caching complements client-based caching by helping to disperse server load; together the two can provide more ecient network transport of data than either can provide independently.
Optimal push-caching is only feasible on the current Internet if it is possible to derive reasonably accurate network topology information from the chaotic, unordered Internet. As explained in section 2.3.1, Guyton and Schwartz showed that it is impossible to directly derive this information eciently from the Internet itself. One goal of this work is therefore to demonstrate that geographical distance, which is easy to derive, predicts topological distance. We also show that a dynamic replication protocol like push-caching is needed because simpler caching solutions, such as a static mirroring of popular Web sites, do not suce.
3.1 Web-Trace Analysis
We collected traces of several dierent Web servers to answer the following questions:
Are access patterns suciently skewed that caching a small number of
objects will satisfy a majority of Web requests?
Are access patterns inconsistent enough that simply mirroring popular
Web sites will not provide good server and network utilization?
How accurately can a server derive Internet topology, thereby
approx-imating the optimal case? Does this topology also relate to Network latency?
We selected four Web sites for trace collection: the globally popular
www.ncsa.uiuc.edu (home of the Mosaic browser), our locally popular
fas.harvard.edu (a campus-wide information server), hcs.harvard.edu
(a computer club's server), and das-www.harvard.edu (the computer
sci-ence department's server).
We modied the three servers on our campus to record when the object being transferred was last modied. This information is not usually logged, but is essential for performing an accurate simulation of consistency mech-anisms. We use this information in chapter 6 to realistically simulate cache consistency issues.
Of the four traces we used to drive our simulator, the NCSA trace is most representative of the globally popular servers that our algorithms are designed to help. The other three traces are more useful for exploring the eect of server-initiated caching on the less popular but more numerous small-scale servers.
Before we began analyzing these traces we had expected that some pages would be much more popular than others, if only because most Web sites have a \home page," or table of contents, that lists the contents of that server. There are usually several other les associated with this home page, and almost every visitor to a Web site sees these les. These pages, at least, will be exceptionally popular relative to the rest of the Web site. We also expected that access patterns would not be consistent across servers; some popular servers such as the Boston Restaurant Guide [9] or New England Alpine Ski Report [32] have specic geographic interest, while others such as the White House home page [20] have a uniform appeal. Finally, we
Server Trac/day (Mb) Requests/day % Static Files Time-Span NCSA 6,492 605,454 66% 5610 1 day FAS 9.3 2,760 73% 292 1 month HCS 8.1 1,750 72% 575 1 month DAS 15 1,390 73% 1405 1 month
Table 3.1:
Summary of the Web server access traces.
The Requests/daycolumn indicates the average number of requests that appeared in the trace for that server per day, while the % Static column indicates that percentage of the requests that are valid and for static objects (as opposed to dynamic pages for example). The Files column indicates the total number of documents that are cacheable on the server. Note that the NCSA trace is for one day, while the other three are for one month.
expected geography to predict topology to some extent|there should be more network hops between a site in California and a site at Harvard than between a site at M.I.T. and the same site at Harvard.
Our trace analysis revealed the following facts:
On average, 75% of Web requests are for 4% of a server's les.
The more globally popular a server is, the smaller the set of popular
documents.
Requests to popular servers are not geographically uniform; dierent
servers have dierent access patterns.
The location of past requests predicts the location of future requests.
The number of network hops and network latency are strongly
corre-lated to each other as well as to the geographical distance between two hosts.
In the rest of this section, we will explore each of these facts in greater detail.
3.1.1 Popular Files are Very Popular
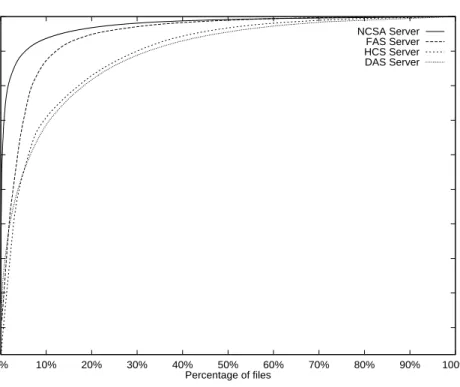
First, we examined the distribution of Web accesses per object. This dis-tribution is shown in Figure 3.1. As we had expected, access patterns are
10% 20% 30% 40% 50% 60% 70% 80% 90% 100% 0% 10% 20% 30% 40% 50% 60% 70% 80% 90% 100%
Cumulative Percentage of File Requests
Percentage of files
NCSA Server FAS Server HCS Server DAS Server
Figure 3.1:
Popularity analysis of requested les from four dierent Web
sites.
The skewed distribution of requests indicates that caching a minority of the les can satisfy a majority of the requests. Files are ordered by their popularity.highly skewed. The graph indicates that a small percentage of the les available on a given server are responsible for a disproportionate share of the requests from that server. For example, the top 5% of the les on the NCSA server were responsible for 90% of the total requests from that server. Bestavros conrms these results [2], adding that the more globally pop-ular a server, the smaller the fraction of pages that account for most of its accesses. Our results agree with this observation: the two most popular servers, NCSA and FAS, are also the two with the smallest percentages of les responsible for the most requests. These results are encouraging be-cause they suggest that caching a small subset of a server's les will reduce the server's load signicantly.
3.2 Static Mirroring is Unlikely to Work
If server popularity were a continuous phenomenon and requests were al-ways clustered in exactly the same way, then mirroring popular Web sites in a static manner would be optimal, and clever caching algorithms would be unnecessary. Unfortunately, this does not seem to be the case. Using a friends-of-friends algorithm, popular with astrophysics researchers for de-tecting galactic clusters, we performed a geographical cluster analysis on our traces to determine groups of hosts with common access patterns. The
algorithm is simple: if a host is within a certain distance
d
of any member ofan existing cluster, then the host joins that cluster. If a host joins multiple clusters, then those clusters are merged together. If the host can not join any cluster, then the host becomes a member of a new cluster.
For the algorithm to work properly,
d
must be set such that the clustersare neither too big nor too small. Through trial and error we found that a range of 50 miles works well for the Internet. Figure 3.2 displays a cluster analysis of the NCSA and the local FAS traces.
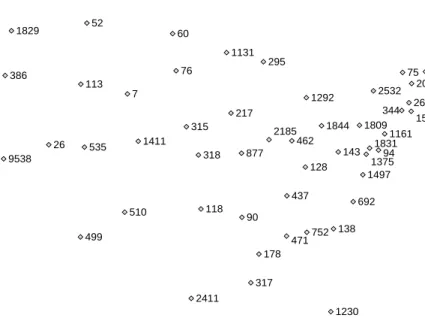
Two results are apparent. There are prominent clusters in both Cal-ifornia and New England on the two graphs; however, the distribution of requests diers signicantly. Secondly, the more popular server has many smaller clusters in addition to those in New England and California. These results indicate that no single server scheme would be able to cache pages for multiple, unrelated servers eciently. Mirroring our campus informa-tion server on the opposite coast might be helpful, but such a simplistic answer would not help the NCSA server, which is popular in 22 separate clusters. On the contrary, a scheme that can autonomously replicate the NCSA server's most popular les in 22 dierent geographic regions while replicating our campus server in only 4 will be more ecient. Furthermore, dynamic replication schemes also help distribute server load more eciently. The graph makes it easy to see the intuitive advantage of distance-sensitive caching: the subnetworks represented by each point lie tantaliz-ingly close to each other. Proxy-caching requires a separate cache on each subnetwork, but distance-sensitive caching enables the entire cluster to au-tonomously share one local cache.
2473 306 311 2296 889 1230 1113 330 520 11267 6036 470 1055 399 1217 312 598 1001 1362 308 378 725
(a)
www.ncsa.uiuc.edu 1961 781 575 48689(b)
fas-www.harvard.eduFigure 3.2:
Cluster analysis of the globally popular
www.ncsa.uiuc.eduand our locally popular
fas-www.harvard.edu. Each point represents anen-tire subnetwork plotted geographically; the numbers indicate the total number of requests received from each cluster. Clusters with fewer than 300 requests have been omitted. Notice that the ratio of requests between the East coast and the West coast for the FAS server is roughly 18 (a), whereas the ratio for the NCSA server is roughly 1.6 (b).
3.3 Deriving Network Topology
For a server to make the optimal decision about where to cache data it must have an accurate representation of network topology. As we saw in section 2.3.1, there is currently no way to determine a priori the Internet's topology. We hypothesized that geographical information could be used to hint at which servers were topologically close.
We surveyed the Internet using the traceroute [21] program to
mea-sure Internet topology, and we used a le maintained by Merit [30, 7] listing the address of each subnet administrator for the 42,000 subnets on the In-ternet today to measure geographic data. The critical datum in the Merit le is the zip code listed in the address; in conjunction with a geography server [24], this provides enough information to establish the latitude and longitude of each network administrator. As long as the zip-code of the subnet administrator matches the zip-code for the subnet as a whole we can accurately place the subnet geographically. It is a simple calculation using this information to compute the distance between two arbitrary hosts on the Internet, accurate to within a zip-code and the size of the subnet. This approach is not eective for subnets that span multiple zip-codes, such as backbone networks or regional networks, but it is eective for the local networks that account for a large fraction of the client requests.
To test the correlation between these two types of information we selected several hundred hosts in the United States and surveyed each one's distance from Harvard. We calculated the latency between our host and it, as well
as the number of network hops between them using traceroute. We also
calculated the distance between them in miles as described above. Since individual workstations are frequently not accessible our survey settles for any computer it can reach on the same subnet as the desired host. If it is not possible to access any host on the desired subnet then a failure is recorded for that host. We ran this program from several other locations around the Internet, including the west coast and Colorado.
We did not expect extremely high correlations because Internet connec-tivity varies widely. While some hosts are connected by a high-speed net-work connection, other hosts are connected by slower, less well-connected networks. Dierent backbone connections are another source of error; be-cause these backbones only connect to one another at a few sites, a le exchanged between two hosts on dierent backbones, no matter how close to each other geographically, may have to travel quite far on the Internet. As
Backbone Sample Hops: Latency: Backbone Hops: Hops: Size Miles Miles Miles Latency All 314 0.3927 0.2400 0.4450 0.4243 204.70 185 0.7394 0.5781 0.7966 0.7340 140.222 64 0.6365 0.4270 0.8535 0.7317 144.228 45 0.4497 0.1146 0.4867 0.4727 137.39 15 0.0568 0.2194 0.1640 0.4468 134.55 5 0.6217 0.9790 0.5468 0.6374
Table 3.2:
Backbone-based correlations for geographical distance versus
network hops, latency, and backbone hops, as well as network hops versus
network latency.
We have divided our samples into groups based on the backbone to which they are connected. Measurements were taken from a host on the 204.70 backbone (the NSFNET); notice how correlations are strongest overall for other hosts on 204.70. Correlations were computed using a power-law regression t.are both located near Boston, but since one is on the MCI backbone and the other is on the Sprintlink backbone packets between them must pass through Washington, DC where the two backbones connect.
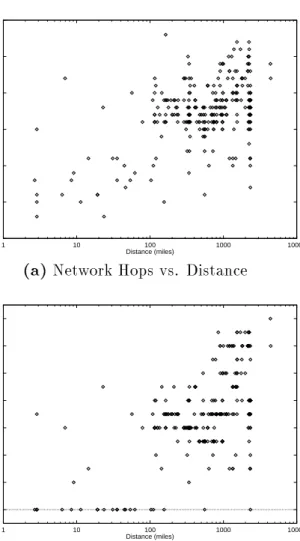
Figures 3.3 and 3.4 display the data from our east coast observations for distance versus network hops, distance versus latency, distance versus backbone hops, and network hops versus latency. The Colorado and west coast observing runs yielded similar results.
In looking for signs that geographical distance predicts network distance (network hops, backbone hops, and latencies), we were encouraged by the apparent correlation shown in the graphs. We also noticed the trend that nearby hosts show the greatest correlation between geographic distance and network distance. Once the distance exceeds 500 miles, the importance of geographic distance decreases.
We hypothesized that if we limited our analysis to hosts on the same backbone network, we would nd stronger correlation between geographi-cal distance and network distance. Table 3.2 presents the results of this study. To examine this hypothesis we divided the hosts into several groups, one group for each backbone, and then computed the correlations for each backbone separately. The correlations were computed using a power-law regression t.
0 5 10 15 20 25 30 1 10 100 1000 10000 Network Hops Distance (miles)
(a)
Network Hops vs. Distance0 2 4 6 8 10 12 14 1 10 100 1000 10000
Network Backbone Hops
Distance (miles)
(b)
Network Backbone Hops vs. DistanceFigure 3.3:
Results of Network Survey: Network Hops and Network
Backbone Hops.
Note that geographical distance establishes a lower bound for network hops. Note also the number of hosts in the sub-100 mile range that are 0 backbone hops away.0 50 100 150 200 1 10 100 1000 10000 Latency (ms) Distance (miles)
(a)
Network Latency vs. Distance0 50 100 150 200 5 10 15 20 25 30 Latency (ms) Network Hops
(b)
Network Backbone Hops vs. LatencyFigure 3.4:
Results of Network Survey: Network Latency.
Note that thelatency graph was cropped at 200 ms for clarity; there were 17 hosts with latencies ranging from 200ms to 1s that were removed.
geographic distance and Internet distance are higher overall when looking at hosts on the same backbone than when looking at all hosts. This result suggests that it will be advantageous to steer clients toward host caches that are both geographically close and on the same backbone network.
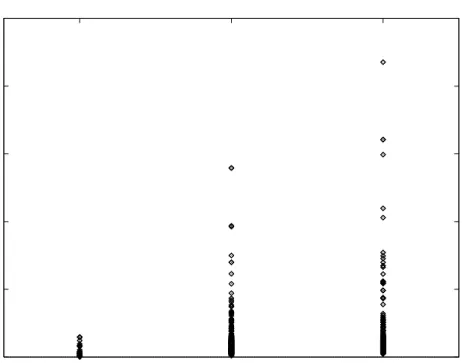
We included a comparison of network hops to latency because calculating expected latency on a network is hard. It requires a knowledge of network bandwidth and expected loading. If the number of network hops between two computers is related to the latency, then by optimizing to reduce network hops we are also optimizing to reduce latency. Figure 3.4 indicates that there is a moderate correlation between hops and latency: fewer than average hops implies low latency, and more than average hops implies a high latency. This is helpful, because it implies that steering a host from a distant cache to a close cache will decrease latency as well as network trac. As we saw in section 2.4.2 this should be one of the primary goals of replication schemes. We investigated latency further by following up on a suspicion voiced by Bestavros in a private conversation. He suspected that latency was primar-ily caused by crossing between backbones, not necessarprimar-ily by the number of individual backbone hops. This hypothesis would make sense if con-nection points between backbones proved to be bottlenecks and sources of congestion. We therefore modied our survey to also include the number of backbones traversed. The results of this new survey are in Figure 3.5. There is a clear correlation between the maximum latency observed and the number of backbones crossed, although we can not draw any further con-clusions from the data. We hope to follow up on this nding in future work; if it turns out that latency is strongly related to the number of bandwidth hops then simply mirroring web sites on multiple backbones should reduce latency considerably.
0 500 1000 1500 2000 2500 0 1 2 Latency (ms)
Number of backbone networks
Figure 3.5:
Number of backbones versus latency.
There is a clear correlationbetween the maximum latency observed and the number of backbones crossed. This would support Bestavros' suspicion that crossing backbones accounts for the majority of the Internet's latency. Notice that no latencies greater than 100 ms were observed without crossing at least one backbone boundary.
Experimentation
The true test of any theory is a real world implementation. Only by actually constructing and distributing a working Web push-cache system can we accurately assess its performance. Unfortunately, such an approach leaves no room for evaluating the various parameters that exist for such a system. Once distributed, any system becomes hard to change.
We decided therefore to rst build an Internet simulator that would allow us to evaluate push-caching and to compare it with other popular caching methods. No simulator is perfect; simulated results are only useful insofar as they provide relative performance between competing schemes. Furthermore, in designing such a simulator it is very important to avoid building any bias into the simulator that might inuence its performance. We were careful to be objective in building the simulator, gathering trace data, and setting the parameters that determine its performance.
4.1 Simulator Design Goals
Before we could design our simulator, we needed to decide what was to be simulated. What questions were we trying to answer, and what data would the simulator need to provide to help us answer those questions? The simu-lator would be used to compare the relative performance of various caching schemes; therefore, it needed to provide data that could be used to judge relative performance. This includes: network bandwidth consumption, net-work latency, cache hit-rates, and resources consumed such as server load and disk space.
We decided to build a general simulator that would simulate the Internet 31
itself. Our caching scheme could be implemented on top of this Internet sim-ulator, and if we wanted to experiment with dierent approaches we could do so without having to build a separate simulator. This would eliminate any potential bias due to simulator dierences.
4.2 Simulator Implementation
Our simulator is divided into three parts; the simulator engine that drives the simulation, the host modules that implement the caching schemes, and the network module that simulates the Internet.
The engine reads in the trace data, and uses it to create events. Each event represents a host requesting a World Web document from a server; the actual event consists of the server and host involved, the name of the document, the size of the document, and the date and time of the transac-tion.
The engine also provides support for periodic jobs that must be run on a frequent basis. When a job is scheduled to run it is removed from the queue and the associated code is run. The code may, as part of its duties, re-insert the job on the queue. This allows us, for example, to reset a host's load every hour, and to print out simulator statistics every six.
There are two dierent types of host modules: servers and clients. Clients are handed an event by the engine and use this information to request a Web document from a server. This request travels through our simulated Internet where the appropriate bandwidth is logged. Servers have all the functionality of clients, but can also serve les. Servers keep track of which les they are caching; one server is designated as the primary host and maintains the most up-to-date versions of les. Both types of hosts record a variety of load parameters such as number of requests, number of bytes stored, number of bytes sent, client-cache hits, and stale client-cache hits.
Depending on the exact caching scheme being simulated, the server can return either the requested document, or the name of another server in the form of a redirect message containing a list of documents currently replicated at that server. Clients can cache not only redirects, but also les themselves in order to simulate client-caching. Servers can also push documents onto other servers; a centralized manager keeps track of servers willing to accept documents.
The Internet module was the most dicult portion of the simulation to build. We wanted it to log not only the number of packets passing across
it, but the exact bandwidth used in terms of bytes hops, where 1000
bytes sent across 10 network hops would use twice the bandwidth of 1000 bytes sent across 5 network hops. In order to log bandwidth accurately the simulator needed an accurate Internet topology, but it would clearly be impossible to calculate and store the entire Internet topology. Even if we limited the amount of information we needed to the 60,000 or so hosts mentioned in the NCSA access log we would still be faced with an impossible amount of information.
We also did not want to synthesize topology information because push-caching is very sensitive to the interaction between geographic information and Internet topology. If we used the same assumptions to generate the topology that push-caching used to approximate it we would see articially high correlations between predicted performance and actual performance, a clear case of simulator bias.
We were fortunate therefore to be given access to the Internet topol-ogy gathered for a Network Time Protocol server survey by Guyton and Schwartz [18], discussed in section 2.3.1. Using this topology we were able to accurately measure the number of hops between two arbitrary hosts, and thereby compare the eciency of using miles to predict topology versus using the actual topology itself. We were unable, however, to accurately measure the number of backbone hops between two hosts or to calculate the latency between two hosts using this data. These are factors that we can only crudely approximate using the results of section 3.3.
4.2.1 Simulated Internet Topology
Of the 6700 hosts in Guyton and Schwartz's database, we were left with 1700 hosts after removing network routers and hosts on networks that span mul-tiple zip-codes (which we could not therefore locate geographically). Figure 4.1 displays the hosts graphically, plotting each host's longitude and lati-tude. It is easy to see the distinctive shape of the United States, as well as the presence of hosts in Alaska and Hawaii.
Since our results rely so heavily on this data we took several steps to assure its authenticity. A host from Harvard was conveniently included in the study; we calculated the number of network hops from this host on the simulated Internet to all the other hosts on the simulated Internet. We also calculated the number of network hops from a real host at Harvard to all the other hosts on the real Internet. The results are shown in Figure 4.2.
Figure 4.1:
Geographical Host Locations.
Each potential client in our database is represented by a dot, plotted using the longitude and latitude infor-mation gathered for each host. Note the distinctive shape of the United States, as well as the presence of clients in Hawaii and Alaska.0 5 10 15 20 25 30 0 5 10 15 20 25
Real Internet Network Hops from 128.103.52.110
Simulated Internet Network Hops from 128.103.108.123
Figure 4.2:
Simulated Internet vs. Real Internet.
Here we have plottednetwork hops to the simulated hosts against networks hops to the real hosts. The regression t correlation is r2= 0:47, the tted line's equation is y = 1:0x + 2:51.
oset on the tted line indicates that the simulated network hops are lower overall than the real network hops. The dierences between the simulated and real networks stem from three causes. First, the simulated data were gathered over a year ago and many of the hosts from the original survey are no longer accessible. Out of the 1700 simulated hosts we were unable to contact 125 real hosts. Secondly, we did not have access to the actual machine at Harvard present in the simulated topology. We had to settle for running our traces from a Harvard machine that is one hop farther away from the backbone than the simulated machine. Thirdly, the real Internet does not always perform optimal routing: the path that a packet takes between two hosts is not always the shortest path. We can not replicate this routing exactly in our simulated Internet|our packets always traveled the shortest route. These dierences are non-trivial, but will not skew our results since all of our caching schemes will use the same topology information.
Since our simulated Internet contains only 1700 hosts and our traces contain up to 50,000 hosts, we needed to create a mapping from real hosts to simulated hosts. Requests in a simulated run appear to be initiated from the mapped host, not from the original host. In computing this mapping we therefore try to maintain geographical information as much as possible. We rst try to map a host onto a simulated host in the same subnetwork of the real host. For example, any requests from hosts on the 128.103 subnet will be mapped to a simulated host also on the 128.103 subnet if possible. If such a mapping is not possible then we try to map the host onto a randomly selected host in the same state. This is possible for all states except Vermont or Wyoming, because no hosts in the topology were located in either of those two states. For requests from those states we choose a mapping completely at random.
We did not initially maintain host mappings between simulation runs. Several of our early results showed excessive noise, however, and we real-ized that this randomization in the host mapping was skewing our results. We therefore set up the mapping such that once a host is mapped it re-mains mapped for all simulations. This was a valuable lesson because it showed us the sensitivity with which host-mapping aects network band-width consumption. We expect therefore that any parameter that aects server selection will aect bandwidth consumption.
4.2.2 Implementation Details
The simulator was written in C++ to simplify the implementation of its modules. Each module was written as a C++ class, and we took advan-tage of inheritance to simplify the substitution of cache-scheme dependent operations. As an example, the network always hands its messages o to a CHost object. Since the server and client classes inherit their interface from the host class, dierent types of hosts can be substituted into the network without having to change any network code.
This approach is also ecient because scheme-independent code need only be written once in the generic module, and then inherited modules can call it. This applies, for example, to the instrumentation built into all the host classes to monitor load. To reduce the simulator's memory requirements we used a disk-backed database to store information such as which clients are caching which documents, the simulated Internet topology, and the host mapping.
We have also built into the simulator extensive logging tools that were used for both debugging as well as gathering results. The debug logs enabled us to test the operation of the simulator by running with contrived test cases in order to verify push-cache operation.
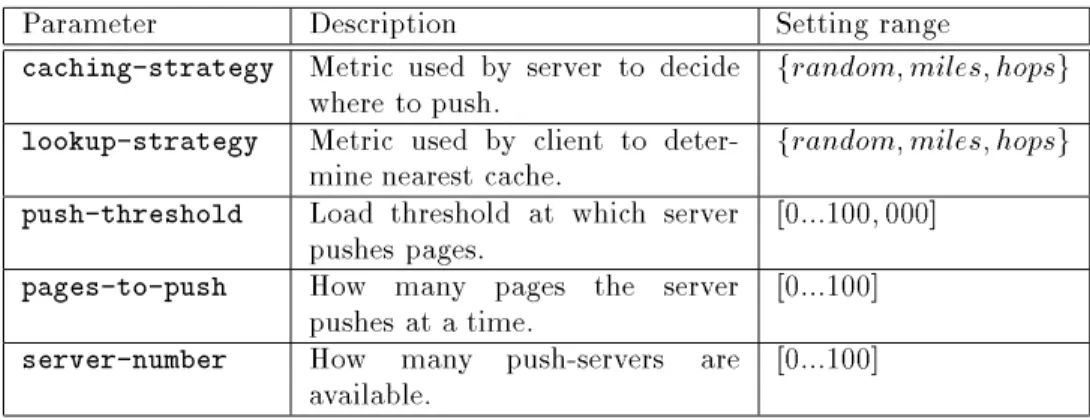
4.3 Simulator Parameters
The remaining open issue is the parameterization of our simulator. Our algorithm relies on the server's ability to distribute objects to remote sites in a manner consistent with the request stream. That leaves several important decisions to make:
When should a server push les to a push-cache server?
To which push-cache server should a server push its les?
How many les should be pushed at a time?
How many servers are needed overall for eective push-caching?
From which push-cache server should a client receive its les?
The rst four questions are \Push Questions" as they describe the server's attempts to push data to other servers, and the last question is a \Pull Question" since it describes from where the client will pull information.
These questions are the topics of the following sections; we answer them in chapter 5.
4.3.1 When to Push
Deciding when to push is very important because of the great range of popularity experienced by servers on the Internet. A globally popular Web server that receives thousands of requests per hour should obviously have push-caching priority over a more obscure server that only receives a few hundred requests per day. To address this question we used an absolute
push-thresholdparameter.
Each server maintains a load factor based on how many requests it ser-vices per hour. Every time the server satises a request for a document
it increments its load. Every half hour the server computes
load
new =load
olddecay
wheredecay
= 0:
5. We chose this formula based on theload formula used by Unix [22] in order to achieve some continuity across
load levels. When a server exceeds the push-threshold it replicates its
most popular les to the optimal location, resetting the load to zero in the process.
In this manner we arbitrate between popular servers and the less popular.
Thepush-thresholdwill need to be reset from time to time to keep up with
the growth of the Web; we envision that the same service that maintains a list of available servers will also maintain the current threshold value.
A related issue concerns stability; we want to prevent a rogue server from ooding caches with thousands of unpopular pages, denying access to legitimate servers. There is no way to deal with this problem directly without imposing a bottleneck at the point where access is controlled, but the problem is also self-correcting. The replacement policy on push-cache servers should be directly tied to the popularity of the pages cached such that servers replace the least-popular pages rst. Pages pushed illegitimately that are not actually popular will therefore quickly be replaced by genuinely popular pages. Caches should also establish a cap on the number of pages they accept from any one server.
We expected that pushing pages frequently would be more ecient than pushing infrequently, but we also thought that there would be a point of diminishing returns. Pushing too frequently would inundate push-cache servers with requests and would be too sensitive to momentary abberations in request patterns.
4.3.2 Where to Push
The server must record information describing the source of Web requests in order to eciently decide where to push documents. Originally we tried reducing the amount of information that the server needed to store by stor-ing access history information at a coarse level. Our rst try recorded the number of requests arriving from each state.
Using states, however, proved to be a particularly inecient because network access does not fall along state lines. Consider the case of a le that is popular on both the east coast and the west coast. We found in early simulations that almost all of the west coast accesses will be from California, whereas the east coast accesses will be spread across several states including New York, Massachusetts, Rhode Island, Vermont, and Maryland. Figure 4.3 shows the state requests graphically for the NCSA access log analyzed above.
10,000 requests clustered in New England compares favorably to 9500 requests from California, yet due to arbitrary political distinctions the 10,000 requests from New England are divided among 8 states. California will dominate the decision of where to cache documents because its single large number will dominate the collection of much smaller numbers from New England.
The solution is not to make the grouping even more coarse; dividing the country into seven regions as suggested by Clay and Braun [7] might help distribute server load but would not have a noticeable eect on network bandwidth.
Instead we record the number of requests that arrive from each individual subnetwork. This information can be used to calculate the optimal location of le replicas, but would overwhelm the server if a separate log were kept for each individual le. An analysis of the server logs showed that this was not necessary.
As shown in Section 3.1.1, a few les make up a large percentage of the requests to a given server. Since these are precisely the pages that are most eciently replicated, we are most interested in recording the access history for these les. It turns out that the request pattern for the entire server closely parallels the request pattern for the most popular les, and therefore only the request patterns for the server as a whole must be kept.
As a rough measure of t we computed the access history for each le by recording how many requests arrived from each state as well as for the server as a whole. We computed the correlation between the request pattern