1
Journal of Refractive Surgery Volume XX Month 200X
Calculation of Intraocular Lens Power Using
Orbscan II Quantitative Area Topography
After Corneal Refractive Surgery
Carlos G. Arce, MD; Eduardo S. Soriano, MD; Robert W. Weisenthal, MD; Stephen M. Hamilton, MD;
Karolinne M. Rocha, MD; Juan B. Alzamora, MD; Eduardo J. Maidana, MD;
Vijayalakshmi L. Vadrevu, MD; Kenneth Himmel, MD; Paulo Schor, MD; Mauro Campos, MD
From the Ocular Bioengineering, Cataract, and Refractive Surgery Sectors, Institute of Vision, Department of Ophthalmology, Paulista School of Medicine, Federal University of São Paulo, Brazil (Arce, Soriano, Rocha, Alzamora, Maidana, Schor, Campos); the Department of Ophthalmology, Upstate Medical Center, State University of New York, Syracuse, NY (Weisenthal, Vadrevu); and Piedmont Better Vision LLC, Atlanta, Ga (Hamilton, Himmel). The authors have no proprietary or financial interest in the materials present-ed herein. Dr Arce is a speaker for Bausch & Lomb Brazil, Territory Manager for Latin America of Vista Optics Limited (UK), and R&D Consultant of Ziemer Ophthalmic Systems (Switzerland).
Preliminary reports were presented at the XXV Pan American Congress of Ophthalmology, March 18-21, 2005, Santiago, Chile; World Cornea Congress V, April 13-15, 2005, Washington, DC; World Ophthalmology Congress, February 19-24, 2006, São Paulo, Brazil; XXIV Congress of the European Society of Cataract and Refractive Surgery, September 9-13, 2006, London, United Kingdom; and the American Academy of Ophthalmology Annual Meeting, November 11-14, 2006, Las Vegas, Nev.
The authors thank José Luis Llanos Carrillo, PhD, for his statistical advice. Correspondence: Carlos G. Arce, MD, Rua Expedicionários 427, Sousas, Campinas, SP 13106-028, Brazil. Tel/Fax: 55 19 3258 3444; E-mail: [email protected] Received: June 30, 2007
Accepted: November 25, 2008 ABSTRACT
PURPOSE: To present the prospective application of the Orbscan II central 2-mm total-mean corneal power obtained by quantitative area topography in intraocular lens (IOL) calculation after refractive surgery.
METHODS: Calculated and achieved refraction and the difference between them were studied in 77 eyes of 61 patients with previous radial keratotomy (RK), RK and additional surgeries, myopic LASIK, myopic pho-torefractive keratectomy (PRK), or hyperopic LASIK who underwent phacoemulsifi cation without complications in 3 eye centers. All IOL calculations used the average from the central 2-mm Orbscan II total-mean power of maps centered on the pupil without the use of previous refractive data. Six IOL styles implanted within the bag were used.
RESULTS: Using the SRK-T formula, the overall
calculat-ed refraction was ⫺0.64⫾0.93 diopters (D). The overall
achieved spherical equivalent refraction (⫺0.52⫾0.79
D) was ⫾1.00 D in 78% of eyes and ⫾2.00 D in 99% of
eyes. The overall difference between the calculated and
achieved refraction (0.12⫾0.93 D, P=.27) was ⫾1.00
D in 77% of eyes and ⫾2.00 D in 96% of eyes. This
dif-ference was ⫾1.00 D in 77% of eyes with RK (P=.70)
and in 90% of eyes with myopic LASIK (P=.34) or
myo-pic PRK (P=.96). In eyes with RK followed by LASIK,
a trend toward undercorrection was noted (P=.03). In
eyes with hyperopic LASIK, a trend toward
overcorrec-tion was noted (P=.005).
CONCLUSIONS: In eyes with previous corneal refractive surgery, IOL power calculation can be performed with reasonable accuracy using the Orbscan II central 2-mm total-mean power. This method had better outcomes in eyes with previous RK, myopic LASIK, and myopic PRK than in eyes with hyperopic LASIK or RK with LASIK. [J Refract Surg. 2009;xx:xxx-xxx.]
A
lthough not currently popular, it has been estimatedthat approximately 1.5 million eyes underwent ra-dial keratotomy (RK) in Brazil since 1980. Almost 200,000 refractive procedures were performed in Brazil in
2003.1 There are more than 800,000 LASIK procedures
per-formed annually by members of the American Society of
Cataract and Refractive Surgery2—currently the most
popu-lar technique to correct myopia.2-4 With these large numbers
of refractive surgeries around the world, cataract surgery with intraocular lens (IOL) implantation following refractive surgery will become increasingly common. Intraocular lens power calculation in these cases is challenging. Signifi cant postoperative hyperopic error (undercorrection) in eyes with previous myopic surgery and myopic error (overcorrection) in eyes with previous hyperopic surgery has been reported. The inexact IOL calculation seems to be due to biometric in-accuracies, incorrect corneal power assessment, or less
accu-rate IOL formulas.5-17
JRSonlineARCE_Jan15.indd 1
journalofrefractivesurgery.com
2
In 2004, Sónego-Krone et al18 reported that the
refrac-tive change at the corneal plane after myopic LASIK (calculated by subtracting the postoperative residual re-fractive defect from the preoperative ametropia) had a
difference of 0.07⫾0.62 D with the corneal power change
determined by quantitative area topography in a 2-mm-di-ameter central zone of Orbscan II (Bausch & Lomb, Roch-ester, NY) total-mean postoperative maps. With a
compa-rable change (difference of ⫺0.08⫾0.53 D), the average of
a 4-mm-diameter central zone from an Orbscan II
total-optical postoperative map was almost always ⬍1.00 D
steeper.18-21 Quantitative area topography is distinct from
quantitative point topography, which assesses the
aver-age of only two single steeper and fl atter values.22 The
to-tal-mean power maps represent the spherical equivalent refraction of both corneal curvatures with regard to the corneal thickness and are comparable to the equivalent
power of the cornea assessed by the thick lens formula.23
The total-optical power maps represent the ray tracing of
light through the whole cornea.23
In the clinical history method,8-13,15 the change
in refraction is subtracted from the anterior corneal curvature before the refractive surgery to obtain the keratometric value to be used in IOL formulas. In the
Sónego-Krone et al approach,18 the pre- and
postopera-tive average total-mean and total-optical powers were determined from all points of both surfaces within specifi c zones. The great advantage of this method is that the fi nal total corneal powers to be used in IOL calculation may be obtained directly from the topo-graphic maps, as measured after the previous corneal
refractive surgery18,19 without depending on regression
formulas,24,25 artifi cial refraction indices,16,26,27 contact
lens over-refraction,28-30 aphakic intraoperative
refrac-tion,31,32 previous refractive11-14,33-39 or topographic
data, algorithms, or correction factors.39,40 This method
has already been evaluated in a retrospective compari-son between the ideal IOL power calculated for emme-tropia and the IOL power calculated using the SRK-T formula in 10 eyes of 7 patients who underwent RK. By using the fl atter of either 2-mm total-mean or 4-mm to-tal-optical Orbscan II powers, 8 of 10 cases would have
had a residual ametropia of ⫾1.00 diopter (D).19
The purpose of this article is to present a prospective application of the Orbscan II quantitative area topogra-phy in IOL calculation in 77 eyes from 61 patients with previous myopic or hyperopic refractive surgeries who underwent phacoemulsifi cation with intraocular lens implantation in three independent institutions.
PATIENTS AND METHODS
As a result of their participation in the Keranet list, three surgeons (R.W.W., S.M.H., and C.G.A.) decided
to share their experience regarding the calculation of IOL power in patients who had undergone previous refractive surgery. Thus, despite no original common protocol, this multicenter study reports the outcomes of their prospectively collected cases with previous re-fractive surgery between 2004 and 2006. Uneventful clear cornea phacoemulsifi cation and IOL implanta-tion were performed in 13 eyes of 11 patients at the Institute of Cataract, Department of Ophthalmology, Paulista School of Medicine, Federal University of São Paulo, Brazil with a recorded postoperative follow-up between 1.5 to 24 months at the time collection of data was stopped. The study also includes 29 eyes of 20 patients from the Upstate Medical Center, State Uni-versity of New York, Syracuse, New York with a post-operative follow-up between 1 and 24 months, and 35 eyes of 30 patients from the Piedmont Better Vision LLC, Atlanta, Georgia, with a postoperative follow-up between 1 and 14 months.
Cases were grouped according to the institution of origin and type of refractive surgery. There were 30 eyes with previous RK (4, 8, or 16 incisions) or RK with arcuate keratotomy (AK); 7 eyes with RK fol-lowed by LASIK (2 eyes with two LASIK procedures); 1 eye with RK and automated lamellar keratoplasty (ALK); 1 eye with RK, vitrectomy, and retinopexy; 10 eyes with myopic photorefractive keratectomy (PRK); 22 eyes with myopic LASIK; and 6 eyes with hyper-opic LASIK. Most cases did not have previous refrac-tive data available.
This study reports the analysis of the achieved re-fraction and its difference (deviation) from what it was calculated using the average of the 2-mm–diam-eter central zone from the Orbscan II total-mean power maps centered on the pupil, as measured after the pre-vious corneal refractive surgery (Fig 1). The Orbscan II statistical analysis device showed a window with the average value used in IOL calculation of each case (see Fig 1). Corneal power was also assessed using one or more of the following methods: the NIDEK OPD-Scan wavefront aberrometer (NIDEK Co Ltd, Gamagori, Ja-pan), the IOLMaster (Carl Zeiss, Jena, Germany), the effective refractive power (EffRP, from the Holladay
Diagnostic Summary),41 the Sim-K obtained from the
Orbscan II or the EyeSys Videokeratographer (EyeSys, Houston, Tex), and the Orbscan II 4-mm–diameter total-optical power. The aim was to observe whether a fl atter corneal power would be obtained by any of these methods and to assist the surgeon in the fi nal decision of the corneal power for the calculation of IOL power. No statistical comparative analysis was performed. Each institution used its usual biometric method and biometer.
JRSonlineARCE_Jan15.indd 2
3
Journal of Refractive Surgery Volume XX Month 200X
All surgeries were uncomplicated with placement of the IOLs inside the capsular bag by a single surgeon from each institution (E.S.S., R.W.W., S.M.H.). Each surgeon was free to choose the surgical phacoemulsi-fi cation technique and unit, IOL formula, and poste-rior chamber IOL model. The group from São Paulo used only MA30AC AcrySof IOLs (Alcon Laboratories Inc, Ft Worth, Tex) with the SRK-T formula. The group from New York used only LI61U IOLs (Bausch & Lomb, Rochester, NY) with either the SRK-T or Holladay I for-mula. The group from Atlanta used MA60AC, SA30AT, SA60AT or SN60WF AcrySof IOLs (Alcon Laborato-ries Inc) with mainly the SRK-T; however, Holladay, Hoffer-Q, and Haigis formulas were also used.
This study was designed as an observational case series. Patients were not age- or gender-matched. No separate control was used. All refraction data were converted and expressed with negative cylinder. As
recommended elsewhere,18 compound names of
Orb-scan II maps use a hyphen. The difference from the calculated refraction in diopters was defi ned as the spherical equivalent of fi nal refraction minus the ex-pected refractive outcome for each formula used. Pear-son correlation was calculated between the achieved postoperative spherical equivalent and the calculated refraction for all cases together and for each group clas-sifi ed by the type of previous refractive surgery. The
two-tailed paired t test was used for comparison of
both variables in all cases and in each group. The two-tailed Wilcoxon signed ranks test was also used for groups with less than 20 cases (myopic PRK, hyperopic LASIK, RK and LASIK, and RK and other surgeries). Analysis of variance (ANOVA) and Tukey tests were used for comparison among groups. An alpha risk of 0.05 was established. Unless otherwise indicated, data
are expressed as mean⫾standard deviation.
RESULTS
Individual results from each institution are summa-rized in Tables 1, 2, and 3. Final postoperative best spectacle-corrected visual acuity (BSCVA) of all eyes from the three groups was 20/30 or better. The average
of the Orbscan II central 2-mm–diameter total-mean power was always applied in the IOL calculation al-though a fl atter corneal power was found in two cases using the clinical history method, in two cases using the Orbscan II Sim-K, and in one case using the aver-age of the Orbscan II central 4-mm–diameter total-opti-cal power. All other corneal powers assessed by other methods and equipments were steeper.
The overall calculated refraction (⫺0.64⫾0.93 D) with
the SRK-T formula was not different (P=.27) than the
overall achieved spherical equivalent (⫺0.52⫾0.79 D)
(Table 4, Fig 2). Both variables were not different in
cases with previous RK or RK with AK (P=.70),
my-opic PRK (P=.96), and myopic LASIK (P=.34). Both
variables were signifi cantly different in cases with RK
followed by LASIK (P=.03) and with hyperopic LASIK
(P=.005).
The achieved spherical equivalent refraction was
within⫾0.25 D in 18 (23%) of 77 eyes, ⫾0.50 D in 41
(53%) ,⫾1.00 D in 60 (78%), ⫾1.50 D in 70 (90%), and
⫾2.00 D in 76 (99%). Analysis of variance test showed
that the achieved spherical equivalent refraction ob-tained with the SRK-T formula was not different
among groups (P=.82). Tukey multiple comparisons
confi rmed no difference among groups (P⭓.89).
The overall difference between the calculated re-fraction with the SRK-T formula and the achieved spherical equivalent refraction had a negative
corre-lation with such expected refraction (Pearson=⫺0.61)
but a positive correlation with the achieved spherical equivalent refraction (Pearson=0.40). The correlation between the overall expected refraction and the fi nal result was 0.43. This correlation was 0.37 in cases with RK or RK with AK, 0.43 in RK with LASIK, and 0.58 in myopic and 0.87 in hyperopic LASIK. Despite good fi nal results, there was no correlation in cases with myopic PRK (Pearson=0.06).
The difference between the calculated refraction with SRK-T formula and the achieved spherical
equiva-lent refraction (Table 4) in all 77 eyes was 0.12⫾0.93 D
with a 95% confi dence interval from ⫺0.09 to 0.33 (Fig
2). This difference was within ⫾0.25 D in 17 (22%) of
Figure 1. Total-mean map rotated (small arrows) to the pupil showing the area ana-lyzed (arrow at left) with 1-mm radius. The average value (at right inside oval) shown at the window data was applied to IOL calcula-tion in eyes with previous refractive surgery.
JRSonlineARCE_Jan15.indd 3
journalofrefractivesurgery.com
4
77 eyes, ⫾0.50 D in 30 (39%), ⫾1.00 D in 59 (77%), and
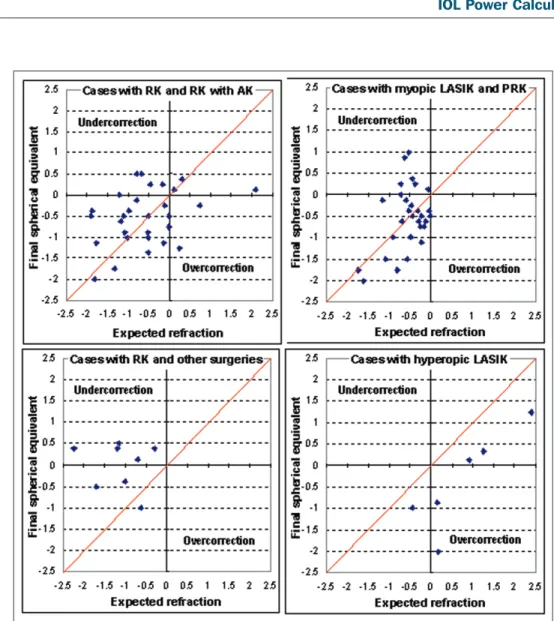
⫾2.00 D in 74 (96%) eyes. The largest difference was
found in cases with hyperopic LASIK and RK followed by LASIK or with other surgeries. Figures 3 and 4 suggest a trend to positive deviation in RK with subsequent sur-geries and to negative deviation after hyperopic LASIK. Analysis of variance test showed that the difference be-tween the calculated refraction with the SRK-T formula and the achieved spherical equivalent refraction was
not the same among groups (P=.001). Tukey multiple
comparisons confi rmed this fi nding among cases with
hyperopic LASIK and with RK (P=.01), myopic LASIK
(P=.009), myopic PRK (P=.03), or RK followed by LASIK
(P=.0002). There was no difference among cases with
RK and myopic LASIK (P=.995), myopic PRK (P=.999),
or RK with LASIK (P=.07); among cases with myopic
LASIK and with myopic PRK (P=1.00), or RK with
LASIK (P=.15); and among cases with myopic PRK and
with RK and LASIK (P=.22).
The difference between the calculated refraction with the Holladay formula and the achieved
spheri-cal equivalent refraction in 64 eyes was 0.04⫾0.96 D
(range: ⫺1.97 to 2.55 D) and within ⫾0.25 D in 13 (20%)
of 64 eyes, ⫾0.50 D in 26 (41%), ⫾1.00 D in 47 (73%),
and ⫾2.00 D in 62 (97%) eyes. The difference between
the calculated refraction with the Hoffer Q formula and the achieved spherical equivalent refraction in 35 eyes
was ⫺0.44⫾0.79 D (range: ⫺1.55 to 1.68 D) and within
⫾0.25 D in 10 (29%) of 35 eyes, ⫾0.50 D in 13 (37%),
⫾1.00 D in 25 (71%), and ⫾2.00 D in 35 (100%) eyes.
The difference between the calculated refraction with the Haigis formula and the achieved spherical
equiva-lent refraction in 35 eyes was ⫺0.90⫾0.82 D (range:
⫺2.16 to 1.05 D) and within⫾0.25 D in 3 of 35 (9%)
eyes, ⫾0.50 D in 11 (31%), ⫾1.00 D in 18 (51%), and
⫾2.00 D in 32 (91%) eyes.
DISCUSSION
This is the fi rst and largest prospective application
of the method developed by Sónego-Krone et al18
us-ing the Orbscan II in the calculation of IOL power in eyes with previous myopic or hyperopic refractive
surgery. Topography41,42 and Orbscan II18,19,43-50 have
been recommended for better corneal power assess-ment in IOL calculation. Orbscan II supplies several corneal power or curvature maps named according to the mathematic method used to achieve the value in
diopters.18,19,22,43,51
TABLE 1
Eyes With Previous Refractive Surgery That Underwent Phacoemulsification With
IOL Implantation at the Federal University of São Paulo
Previous Refractive Surgery Orbscan II 2-mm Total-mean Power IOL for Emmetropia IOL Implanted (D) Calculated Refraction With SRK-T Achieved Refraction Final Spherical Equivalent Difference With SRK-T RK 31.53 20.16 21.50 ⫺1.10 ⫹0.50 ⫺2.00 ⫻ 90º ⫺0.50 ⫹0.60 RK 37.84 19.64 21.00 ⫺1.02 ⫺2.00 ⫻ 90º ⫺1.00 ⫹0.02 RK 35.67 23.31 25.00 1.33 ⫺0.50 –2.50 ⫻ 80º ⫺1.75 ⫺0.42 RK 35.38 19.11 20.50 ⫺1.08 ⫺1.75 ⫻ 135º ⫺0.875 ⫹0.205 RK 33.52 18.83 19.00 ⫺0.14 ⫺2.25 ⫻ 100º ⫺1.125 ⫺0.985 RK 40.60 13.24 14.00 ⫺0.53 ⫺0.50 –0.75 ⫻ 90º ⫺0.875 ⫺0.345 RK 38.78 9.98 10.00 ⫺0.02 ⫺0.75 ⫺0.75 ⫺0.73 M-PRK 33.36 20.20 20.50 ⫺0.30 ⫺0.25 –0.75 ⫻ 90° ⫺0.625 ⫺0.325 M-LASIK 33.36 21.67 22.00 ⫺0.26 ⫺0.75 ⫺0.75 ⫺0.49 M-LASIK 36.44 1.15 22.00 ⫺0.58 ⫺1.00 –1.00 ⫻ 175º ⫺1.50 ⫺0.92 M-LASIK 43.60 20.27 20.50 ⫺0.23 ⫺0.50 ⫺0.50 ⫺0.27 M-LASIK 33.36 18.55 19.00 ⫺0.45 ⫹1.25 –1.75 ⫻180° ⫹0.375 ⫹0.825 M-LASIK 30.71 20.61 21.00 ⫺0.39 ⫹1.0 –1.50 ⫻ 170° ⫹0.25 ⫹0.64 Mean 35.56 18.98 19.69 ⫺0.57 ⫺0.74 ⫺0.17 SD 3.60 3.56 3.82 0.42 0.59 0.59 Maximum 43.60 23.31 25.00 ⫺0.02 ⫹0.38 ⫹0.83 Minimum 30.71 9.98 10.00 ⫺1.33 ⫺1.75 ⫺0.99
IOL = intraocular lens, difference = final spherical equivalent minus calculated refraction, RK = radial keratotomy, M⫺LASIK = myopic LASIK, SD = standard deviation
JRSonlineARCE_Jan15.indd 4
5
Journal of Refractive Surgery Volume XX Month 200X
According to the refractive index ap-plied and the analyzed portion of the cornea, maps may be keratometric, ante-rior, posteante-rior, total, or thickness power maps. Keratometric maps represent an assumed whole corneal curvature de-rived from the anterior surface by using a fi ctitious refraction index of 1.3375. Methods that use maps derived only from the anterior surface data may be inadequate for IOL calculation because they do not evaluate the entire corneal optical system or may assume values
for the posterior surface curvature.37 In
fact, keratometric values such as Sim-K tend to underestimate the change after myopic LASIK, even when the central
point is assessed.18 On the other hand,
anterior, posterior, and total maps are calculated using physiologic refraction indices of air (1.0), cornea (1.376), and aqueous humor (1.336). Axial (saggital) and tangential (meridional or instanta-neous) Orbscan II maps may be derived either from the Placido or elevation data. Orbscan II seems to have the ability to combine both Placido and elevation data
to better display these last two maps.51
Although this apparent integration was effective through the tools menu and surface rotation device, no information from the manufacturer was available to explain how it happens. Mean power maps represent the spherical equivalent of each point in all meridians from each corneal surface. Total-mean maps are the addition of the anterior-mean, pos-terior-mean, and thickness-mean maps. Optical power maps, also called refrac-tive or Snell maps, represent the focal properties of the cornea. Total-optical maps consider the ray tracing of light
through the whole cornea.18,20,23,43,51
The corneal power applied in this study is the average of all points con-tained within the 2-mm–diameter cen-tral zone of Orbscan II total-mean maps centered on the pupil, as measured di-rectly from corneas with previous refrac-tive surgery. This value was not chosen arbitrarily among the corneal powers as-sessed. The methods used had the pur-pose to verify which one provides the
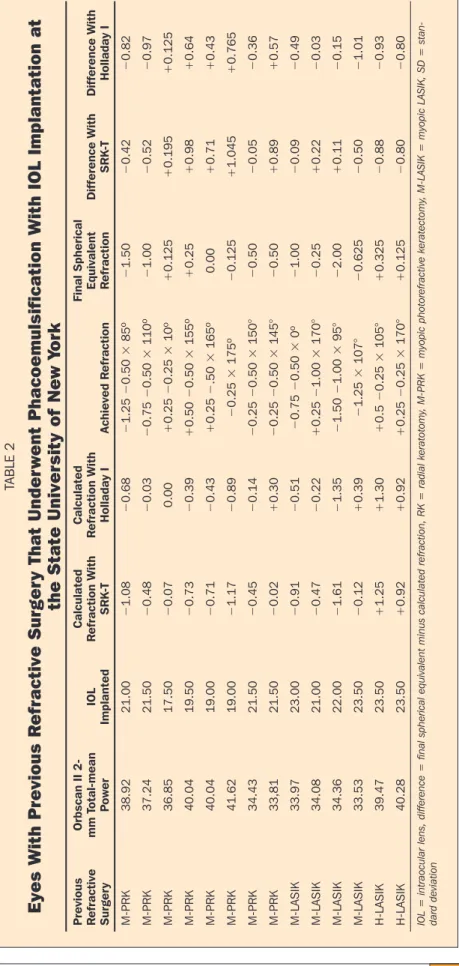
TABLE 2
Eyes With Previous R
efractive Surger
y That Under
went Phacoemulsification With IOL Implantation at
the State University of New Y
ork
Previous Refractive Surger
y Orbscan II 2- mm T otal-mean Power IOL Implanted Calculated R efraction With S R K-T Calculated R
efraction With Holladay I
Achieved R
efraction
Final Spherical Equivalent R
efraction Difference With S R K-T Difference With Holladay I M-PRK 38.92 21.00 ⫺ 1.08 ⫺ 0.68 ⫺ 1.25 ⫺ 0.50 ⫻ 85º ⫺ 1.50 ⫺ 0.42 ⫺ 0.82 M-PRK 37.24 21.50 ⫺ 0.48 ⫺ 0.03 ⫺ 0.75 ⫺ 0.50 ⫻ 110º ⫺ 1.00 ⫺ 0.52 ⫺ 0.97 M-PRK 36.85 17.50 ⫺ 0.07 0.00 ⫹ 0.25 ⫺ 0.25 ⫻ 10º ⫹ 0.125 ⫹ 0.195 ⫹ 0.125 M-PRK 40.04 19.50 ⫺ 0.73 ⫺ 0.39 ⫹ 0.50 ⫺ 0.50 ⫻ 155º ⫹ 0.25 ⫹ 0.98 ⫹ 0.64 M-PRK 40.04 19.00 ⫺ 0.71 ⫺ 0.43 ⫹ 0.25 ⫺ .50 ⫻ 165º 0.00 ⫹ 0.71 ⫹ 0.43 M-PRK 41.62 19.00 ⫺ 1.17 ⫺ 0.89 ⫺ 0.25 ⫻ 175º ⫺ 0.125 ⫹ 1.045 ⫹ 0.765 M-PRK 34.43 21.50 ⫺ 0.45 ⫺ 0.14 ⫺ 0.25 ⫺ 0.50 ⫻ 150° ⫺ 0.50 ⫺ 0.05 ⫺ 0.36 M-PRK 33,81 21.50 ⫺ 0.02 ⫹ 0.30 ⫺ 0.25 ⫺ 0.50 ⫻ 145° ⫺ 0.50 ⫹ 0.89 ⫹ 0.57 M-LASIK 33.97 23.00 ⫺ 0.91 ⫺ 0.51 ⫺ 0.75 ⫺ 0.50 ⫻ 0º ⫺ 1.00 ⫺ 0.09 ⫺ 0.49 M-LASIK 34.08 21.00 ⫺ 0.47 ⫺ 0.22 ⫹ 0.25 ⫺ 1.00 ⫻ 170° ⫺ 0.25 ⫹ 0.22 ⫺ 0.03 M-LASIK 34.36 22.00 ⫺ 1.61 ⫺ 1.35 ⫺ 1.50 ⫺ 1.00 ⫻ 95° ⫺ 2.00 ⫹ 0.11 ⫺ 0.15 M-LASIK 33.53 23.50 ⫺ 0.12 ⫹ 0.39 ⫺ 1.25 ⫻ 107° ⫺ 0.625 ⫺ 0.50 ⫺ 1.01 H-LASIK 39.47 23.50 ⫹ 1.25 ⫹ 1.30 ⫹ 0.5 ⫺ 0.25 ⫻ 105° ⫹ 0.325 ⫺ 0.88 ⫺ 0.93 H-LASIK 40.28 23.50 ⫹ 0.92 ⫹ 0.92 ⫹ 0.25 ⫺ 0.25 ⫻ 170° ⫹ 0.125 ⫺ 0.80 ⫺ 0.80
IOL = intraocular lens, difference = final spherical equivalent minus calculated refraction, RK = radial keratotomy
, M-PRK = my
opic photorefractive keratectomy
, M-LASIK = myopic LASIK, SD =
stan-dard deviation
JRSonlineARCE_Jan15.indd 5
journalofrefractivesurgery.com
6
fl attest corneal power as it was recommended
else-where.15 It is important to
realize that the average di-optric values obtained by quantitative area topogra-phy vary according to the size and shape (circle or ring) of the assessed zone, type of previous refrac-tive surgery, amount of laser energy, and ablation
depth shape.18,43 Thus, the
deeper ablation at the cen-ter produces a fl atcen-ter value at the central point that tends to overestimate the dioptric change after myo-pic LASIK or PRK. This average becomes steeper, closer to the preoperative original value, and tends to underestimate the re-fractive change when more peripheral points are
included in larger zones.18
The diameter of 2 mm es-tablished the area where both trends cross each oth-er in the total-mean maps
after myopic LASIK.18
Presently, no one has yet verifi ed how the size of the assessed zones affects the Orbscan II total corne-al powers after hyperopic surgeries. Our recommen-dation to center maps by means of the Orbscan II surface rotation device to the same reference used in previous refractive sur-geries (ie, pupil or line of sight) becomes more im-portant when small zones
are assessed.43,51 After RK,
a 2-mm central zone con-centric to the pupil would have more probabilities to be within the 3-mm central incision-free area usually used in such pro-cedures whereas a larger
TABLE 2 CONTINUED
Eyes With Previous R
efractive Surger
y That Under
went Phacoemulsification With IOL Implantation
at the State University of New Y
ork
Previous Refractive Surger
y Orbscan II 2- mm total-mean power IOL Implanted Calculated R efraction With S R K-T Calculated R
efraction With Holladay I Achieved Refraction Final Spherical Equivalent Refraction Difference With S R K-T Difference With Holladay I RK 40.21 22.00 ⫺ 0.17 ⫹ 0.15 ⫹ 0.50 ⫺ 0.50 ⫻ 135º ⫹ 0.25 ⫹ 0.42 ⫹ 0.10 RK 32.81 19.50 ⫺ 0.47 ⫺ 0.38 ⫹ 0.50 ⫺ 0.50 ⫻ 135º ⫹ 0.25 ⫹ 0.72 ⫹ 0.63 RK 36.83 16.00 ⫺ 0.97 ⫺ 1.08 ⫺ 0.75 ⫻ 145º ⫺ 0.375 ⫹ 0.595 ⫹ 0.705 RK 36.56 16.50 ⫺ 0.50 ⫺ 0.65 ⫺ 0.50 ⫺ 1.75 ⫻ 150º ⫺ 1.375 ⫺ 0.875 ⫺ 0.725 RK 34.80 21.00 ⫺ 0.11 ⫺ 0.40 ⫺ 0.50 ⫻ 15º ⫺ 0.25 ⫺ 0.14 ⫹ 0.15 RK 34.99 21.50 ⫺ 0.79 0.48 ⫹ 0.25 ⫺ 0.75 ⫻ 0º ⫺ 0.125 ⫹ 0.665 ⫹ 0.355 RK 34.70 18.50 ⫹ 0.12 ⫺ 0.03 ⫹ 0.75 ⫺ 1.25 ⫻ 0º ⫹ 0.125 ⫹ 0.005 ⫹ 0.155 RK 33.81 21.50 ⫺ 0.02 ⫹ 0.30 ⫺ 0.25 ⫺ 0.50 ⫻ 145° ⫺ 0.50 ⫹ 0.89 ⫹ 0.57 RK 42.88 20.00 ⫺ 1.87 ⫺ 1.70 ⫺ 0.75 ⫻ 167° ⫺ 0.375 ⫹ 1.5 ⫹ 1.33 RK 40.16 21.50 ⫺ 1.16 ⫹ 0.75 ⫺ 0.50 ⫺ 0.25 ⫻ 166° ⫺ 0.625 ⫹ 0.54 ⫺ 1.37 RK 44.28 13.00 ⫹ 2.09 ⫹ 2.09 ⫹ 0.50 ⫺ 0.75 ⫻ 130° ⫹ 0.125 ⫺ 1.97 ⫺ 1.97 RK 42.23 19.00 ⫹ 0.73 ⫹ 0.62 ⫺ 0.25 ⫺ 0.25 ⫺ 0.98 ⫺ 0.87 RK 34.69 19.00 ⫺ 0.50 ⫺ 0.70 ⫺ 0.75 ⫺ 0.50 ⫻ 96° ⫺ 1.00 ⫺ 0.50 ⫺ 0.30 RK 34.98 19.50 ⫺ 0.79 ⫺ 0.87 ⫹ 1.00 ⫺ 1.00 ⫻ 0° ⫹ 0.50 ⫹ 1.29 ⫹ 1.37 RK 32.70 21.00 ⫹ 0.31 ⫹ 0.37 ⫹ 0.75 ⫺ 0.75 ⫻ 50° ⫹ 0.375 ⫹ 0.06 0.00 Mean 37.00 20.04 ⫺ 0.34 ⫺ 0.13 ⫺ 0.34 ⫹ 0.11 ⫺ 0.10 SD 3.50 2.24 0.84 0.80 0.61 0.79 0.80 Maximum 44.28 23.50 ⫹ 2.09 ⫹ 2.09 ⫹ 0.50 ⫹ 1.50 ⫹ 1.37 Minimum 32.7 13.00 ⫺ 1.87 ⫺ 1.70 ⫺ 2.00 ⫺ 1.97 ⫺ 1.97
IOL = intraocular lens, difference = final spherical equivalent minus calculated refraction, RK = radial keratotomy
, M-PRK = my
opic photorefractive keratectomy
, M-LASIK = myopic LASIK, SD = standard deviation
JRSonlineARCE_Jan15.indd 6
7
Journal of Refractive Surgery Volume XX Month 200X
diameter (ie, 4 mm) may increase the risk or error including the beginning of
incisions.43
Different Orbscan II maps require zones of analysis with different sizes to better refl ect the refractive change at the corneal plane after myopic LASIK because the cor-neal curvature and power are calculated by different
mathematic methods.43,51
In addition to the central 2-mm zone of the Orb-scan II total-mean map, the average power from the central 4-mm zone of the total-optical map also refl ected accurately the re-fractive change after
myo-pic LASIK,18,52 and it has
been already suggested as a good option for IOL cal-culation after myopic PRK
and LASIK.53 The central
5-mm zone of the total-ax-ial map not centered on a
common reference mark45
and the paracentral 1.5- to 2-mm ring zones of the
to-tal-optical map48 have also
produced good results. Anterior and posterior curvature maps of the Pen-tacam (Oculus Optikgeräte GmbH, Wetzlar, Germany) are mathematically de-rived from elevation data obtained from Scheimpfl ug slit images of the anterior segment of the eye. The Pentacam’s true net power is basically the addition of both corneal curvatures by means of the Gaussian op-tics formula. However, we did not fi nd in the man-ufacturer’s information whether the equivalent K readings suggested for IOL calculation result from
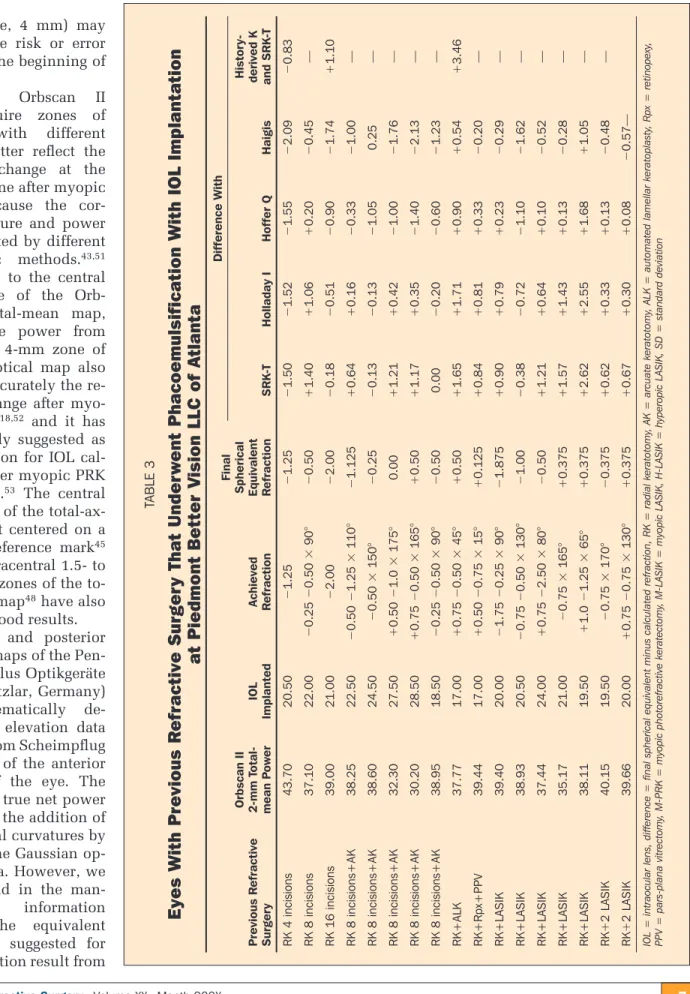
TABLE 3
Eyes With Previous R
efractive Surger
y That Under
went Phacoemulsification With IOL Implantation
at Piedmont Better V
ision LLC of A
tlanta
Final
Spherical Equivalent Refraction
Difference With Previous R efractive Surger y Orbscan II 2-mm T otal-mean P ower IOL Implanted Achieved Refraction SRK -T Holladay I Hoffer Q Haigis Histor y-derived K and SRK -T RK 4 incisions 43.70 20.50 ⫺ 1.25 ⫺ 1.25 ⫺ 1.50 ⫺ 1.52 ⫺ 1.55 ⫺ 2.09 ⫺ 0.83 RK 8 incisions 37.10 22.00 ⫺ 0.25 ⫺ 0.50 ⫻ 90° ⫺ 0.50 ⫹ 1.40 ⫹ 1.06 ⫹ 0.20 ⫺ 0.45 — RK 16 incisions 39.00 21.00 ⫺ 2.00 ⫺ 2.00 ⫺ 0.18 ⫺ 0.51 ⫺ 0.90 ⫺ 1.74 ⫹ 1.10 RK 8 incisions+AK 38.25 22.50 ⫺ 0.50 ⫺ 1.25 ⫻ 110° ⫺ 1.125 ⫹ 0.64 ⫹ 0.16 ⫺ 0.33 ⫺ 1.00 — RK 8 incisions+AK 38.60 24.50 ⫺ 0.50 ⫻ 150° ⫺ 0.25 ⫺ 0.13 ⫺ 0.13 ⫺ 1.05 0.25 — RK 8 incisions+AK 32.30 27.50 ⫹ 0.50 ⫺ 1.0 ⫻ 175° 0.00 ⫹ 1.21 ⫹ 0.42 ⫺ 1.00 ⫺ 1.76 — RK 8 incisions+AK 30.20 28.50 ⫹ 0.75 ⫺ 0.50 ⫻ 165° ⫹ 0.50 ⫹ 1.17 ⫹ 0.35 ⫺ 1.40 ⫺ 2.13 — RK 8 incisions+AK 38.95 18.50 ⫺ 0.25 ⫺ 0.50 ⫻ 90° ⫺ 0.50 0.00 ⫺ 0.20 ⫺ 0.60 ⫺ 1.23 — RK+ALK 37.77 17.00 ⫹ 0.75 ⫺ 0.50 ⫻ 45° ⫹ 0.50 ⫹ 1.65 ⫹ 1.71 ⫹ 0.90 ⫹ 0.54 ⫹ 3.46 RK+Rpx+PPV 39.44 17.00 ⫹ 0.50 ⫺ 0.75 ⫻ 15° ⫹ 0.125 ⫹ 0.84 ⫹ 0.81 ⫹ 0.33 ⫺ 0.20 — RK+LASIK 39.40 20.00 ⫺ 1.75 ⫺ 0.25 ⫻ 90° ⫺ 1.875 ⫹ 0.90 ⫹ 0.79 ⫹ 0.23 ⫺ 0.29 — RK+LASIK 38.93 20.50 ⫺ 0.75 ⫺ 0.50 ⫻ 130° ⫺ 1.00 ⫺ 0.38 ⫺ 0.72 ⫺ 1.10 ⫺ 1.62 — RK+LASIK 37.44 24.00 ⫹ 0.75 ⫺ 2.50 ⫻ 80° ⫺ 0.50 ⫹ 1.21 ⫹ 0.64 ⫹ 0.10 ⫺ 0.52 — RK+LASIK 35.17 21.00 ⫺ 0.75 ⫻ 165° ⫹ 0.375 ⫹ 1.57 ⫹ 1.43 ⫹ 0.13 ⫺ 0.28 — RK+LASIK 38.11 19.50 ⫹ 1.0 ⫺ 1.25 ⫻ 65° ⫹ 0.375 ⫹ 2.62 ⫹ 2.55 ⫹ 1.68 ⫹ 1.05 — RK ⫹ 2 LASIK 40.15 19.50 ⫺ 0.75 ⫻ 170° ⫺ 0.375 ⫹ 0.62 ⫹ 0.33 ⫹ 0.13 ⫺ 0.48 — RK ⫹ 2 LASIK 39.66 20.00 ⫹ 0.75 ⫺ 0.75 ⫻ 130° ⫹ 0.375 ⫹ 0.67 ⫹ 0.30 ⫹ 0.08 ⫺ 0.57—
IOL = intraocular lens, difference = final spherical equivalent minus calculated refraction, RK = radial keratotomy
, AK = arcua
te keratotomy
, ALK = automated lamellar keratoplasty
, Rpx = retinopexy
,
PPV = pars-plana vitrectomy
, M-PRK = myopic photorefractive keratectomy
, M-LASIK = myopic LASIK, H-LASIK = hyperopic LASIK, SD
= standard deviation
JRSonlineARCE_Jan15.indd 7
journalofrefractivesurgery.com
8
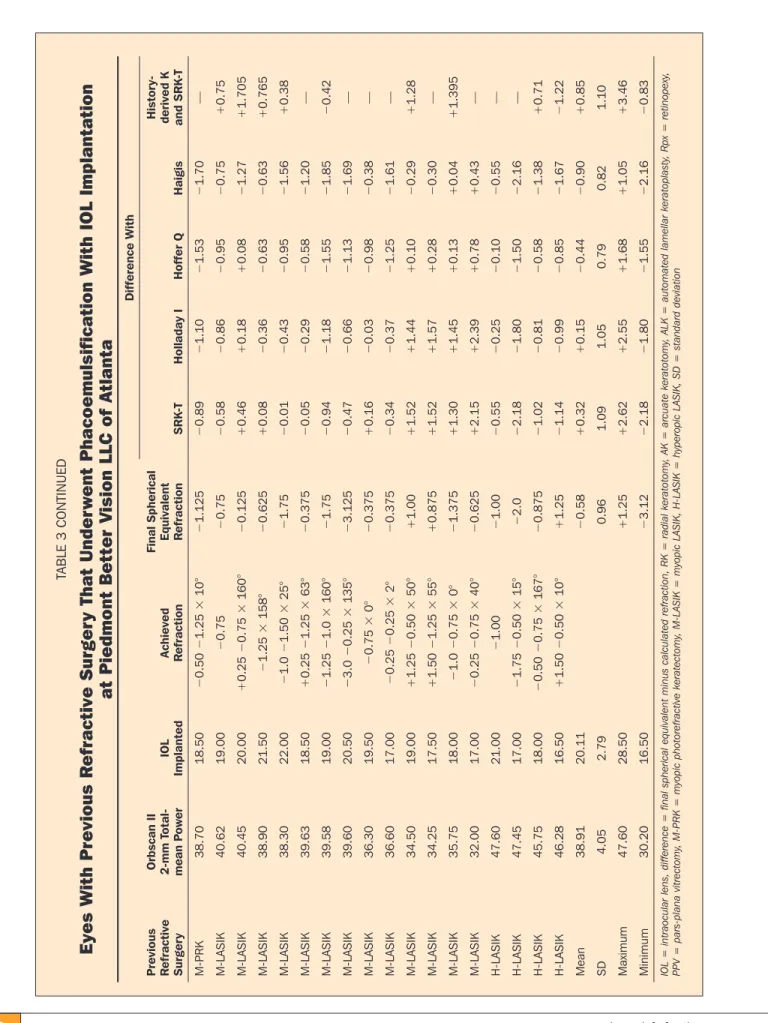
TABLE 3 CONTINUED
Eyes With Previous R
efractive Surger
y That Under
went Phacoemulsification With IOL Implantation
at Piedmont Better V
ision LLC of A
tlanta
Final Spherical Equivalent R
efraction
Difference With
Previous Refractive Surger
y Orbscan II 2-mm T otal-mean P ower IOL Implanted Achieved Refraction SRK -T Holladay I Hoffer Q Haigis Histor y-derived K and SRK -T M-PRK 38.70 18.50 ⫺ 0.50 ⫺ 1.25 ⫻ 10° ⫺ 1.125 ⫺ 0.89 ⫺ 1.10 ⫺ 1.53 ⫺ 1.70 — M-LASIK 40.62 19.00 ⫺ 0.75 ⫺ 0.75 ⫺ 0.58 ⫺ 0.86 ⫺ 0.95 ⫺ 0.75 ⫹ 0.75 M-LASIK 40.45 20.00 ⫹ 0.25 ⫺ 0.75 ⫻ 160° ⫺ 0.125 ⫹ 0.46 ⫹ 0.18 ⫹ 0.08 ⫺ 1.27 ⫹ 1.705 M-LASIK 38.90 21.50 ⫺ 1.25 ⫻ 158° ⫺ 0.625 ⫹ 0.08 ⫺ 0.36 ⫺ 0.63 ⫺ 0.63 ⫹ 0.765 M-LASIK 38.30 22.00 ⫺ 1.0 ⫺ 1.50 ⫻ 25° ⫺ 1.75 ⫺ 0.01 ⫺ 0.43 ⫺ 0.95 ⫺ 1.56 ⫹ 0.38 M-LASIK 39.63 18.50 ⫹ 0.25 ⫺ 1.25 ⫻ 63° ⫺ 0.375 ⫺ 0.05 ⫺ 0.29 ⫺ 0.58 ⫺ 1.20 — M-LASIK 39.58 19.00 ⫺ 1.25 ⫺ 1.0 ⫻ 160° ⫺ 1.75 ⫺ 0.94 ⫺ 1.18 ⫺ 1.55 ⫺ 1.85 ⫺ 0.42 M-LASIK 39.60 20.50 ⫺ 3.0 ⫺ 0.25 ⫻ 135° ⫺ 3.125 ⫺ 0.47 ⫺ 0.66 ⫺ 1.13 ⫺ 1.69 — M-LASIK 36.30 19.50 ⫺ 0.75 ⫻ 0° ⫺ 0.375 ⫹ 0.16 ⫺ 0.03 ⫺ 0.98 ⫺ 0.38 — M-LASIK 36.60 17.00 ⫺ 0.25 ⫺ 0.25 ⫻ 2° ⫺ 0.375 ⫺ 0.34 ⫺ 0.37 ⫺ 1.25 ⫺ 1.61 — M-LASIK 34.50 19.00 ⫹ 1.25 ⫺ 0.50 ⫻ 50° ⫹ 1.00 ⫹ 1.52 ⫹ 1.44 ⫹ 0.10 ⫺ 0.29 ⫹ 1.28 M-LASIK 34.25 17.50 ⫹ 1.50 ⫺ 1.25 ⫻ 55° ⫹ 0.875 ⫹ 1.52 ⫹ 1.57 ⫹ 0.28 ⫺ 0.30 — M-LASIK 35.75 18.00 ⫺ 1.0 ⫺ 0.75 ⫻ 0° ⫺ 1.375 ⫹ 1.30 ⫹ 1.45 ⫹ 0.13 ⫹ 0.04 ⫹ 1.395 M-LASIK 32.00 17.00 ⫺ 0.25 ⫺ 0.75 ⫻ 40° ⫺ 0.625 ⫹ 2.15 ⫹ 2.39 ⫹ 0.78 ⫹ 0.43 — H-LASIK 47.60 21.00 ⫺ 1.00 ⫺ 1.00 ⫺ 0.55 ⫺ 0.25 ⫺ 0.10 ⫺ 0.55 — H-LASIK 47.45 17.00 ⫺ 1.75 ⫺ 0.50 ⫻ 15° ⫺ 2.0 ⫺ 2.18 ⫺ 1.80 ⫺ 1.50 ⫺ 2.16 — H-LASIK 45.75 18.00 ⫺ 0.50 ⫺ 0.75 ⫻ 167° ⫺ 0.875 ⫺ 1.02 ⫺ 0.81 ⫺ 0.58 ⫺ 1.38 ⫹ 0.71 H-LASIK 46.28 16.50 ⫹ 1.50 ⫺ 0.50 ⫻ 10° ⫹ 1.25 ⫺ 1.14 ⫺ 0.99 ⫺ 0.85 ⫺ 1.67 ⫺ 1.22 Mean 38.91 20.11 ⫺ 0.58 ⫹ 0.32 ⫹ 0.15 ⫺ 0.44 ⫺ 0.90 ⫹ 0.85 SD 4.05 2.79 0.96 1.09 1.05 0.79 0.82 1.10 Maximum 47.60 28.50 ⫹ 1.25 ⫹ 2.62 ⫹ 2.55 ⫹ 1.68 ⫹ 1.05 ⫹ 3.46 Minimum 30.20 16.50 ⫺ 3.12 ⫺ 2.18 ⫺ 1.80 ⫺ 1.55 ⫺ 2.16 ⫺ 0.83
IOL = intraocular lens, difference = final spherical equivalent minus calculated refraction, RK = radial keratotomy
, AK = arcua
te keratotomy
, ALK = automated lamellar keratoplasty
, Rpx = retinopexy
,
PPV = pars-plana vitrectomy
, M-PRK = myopic photorefractive keratectomy
, M-LASIK = myopic LASIK, H-LASIK = hyperopic LASIK, SD
= standard deviation
JRSonlineARCE_Jan15.indd 8
9
Journal of Refractive Surgery Volume XX Month 200X
all points or from only the maximum and minimum values inside an assessed zone. Although larger areas with a 4.0- or 4.5-mm diameter have been suggested
with this Pentacam’s application, a recent study54
veri-fi ed that the 2-mm zone would be the best for IOL cal-culation. This is in agreement with our fi ndings and
previous fi ndings using the Orbscan II.18
The Galilei (Ziemer Ophthalmic Group, Port, Swit-zerland) is another topographic system that combines a double Scheimpfl ug camera with a double Placido ring analysis. This device may show the anterior sur-face curvature as well as the total corneal powers re-sultant from the thick lens formula and ray tracing.
Similar to the Orbscan II total-optical power,18,52 the
Galilei uses a 4-mm diameter central zone for the
to-tal corneal power derived from ray tracing. To assess the anterior curvature and the Gaussian total corneal power, it uses an annular area with 0.5-mm internal radius and 2-mm external radius. The Galilei presently does not use a 2-mm diameter zone for the Gaussian to-tal corneal power. These differences of size and zones shape probably affected the preliminary results on IOL
calculation using this device.55
By using an adapted thick-lens Gaussian optics for-mula with values derived from elevation data assessed from a central 5-mm zone of the anterior surface and
a 10-mm zone of the posterior surface, Cheng et al44,49
found that the central 2-mm total-mean postoperative
power was 0.74⫾0.68 D fl atter than the keratometric
value derived by the clinical history method and that
TABLE 4
Calculated Refraction With SRK-T IOL Formula Using the Average of the Orbscan II
Central 2-mm Total-mean Power and Achieved Spherical Equivalent Refraction
in 77 Eyes With Previous Refractive Surgery That Underwent Uneventful
Phacoemulsification in Three Eye Institutions
Previous Refractive Surgery
No. of
Eyes Refraction Mean⫾SD (D) Minimum (D) Maximum (D) 95% CI P Value
RK or RK + AK 30 Calculated ⫺0.57⫾0.85 ⫺1.90 2.09 Achieved ⫺0.51⫾0.64 ⫺2.00 0.50 Difference 0.06⫾0.86 ⫺1.97 1.50 ⫺0.38/0.26 .704 RK + LASIK 7 Calculated ⫺1.41⫾0.89 ⫺2.78 ⫺0.30 Achieved ⫺0.38⫾0.85 ⫺1.88 0.38 Difference 1.03⫾0.93 ⫺0.38 2.62 0.26/2.10 .028 RK + other surgeries 2 Calculated ⫺0.93⫾0.31 ⫺1.15 ⫺0.72 Achieved 0.31⫾0.27 0.12 0.5 Difference 1.25⫾0.57 0.84 1.65 — .179 M-PRK 10 Calculated ⫺0.53⫾0.40 ⫺1.17 -0.02 Achieved ⫺0.50⫾0.58 ⫺1.50 0.25 Difference 0.03⫾0.68 ⫺0.89 1.05 ⫺0.47/0.59 .96 M-LASIK 22 Calculated ⫺0.87⫾0.85 ⫺2.78 ⫺0.04 Achieved ⫺0.70⫾0.96 ⫺3.12 1.0 Difference 0.17⫾0.84 ⫺0.94 2.15 ⫺0.55/0.20 .343 H-LASIK 6 Calculated 0.74⫾1.01 ⫺0.45 2.39 Achieved ⫺0.36⫾1.15 ⫺2.00 1.25 Difference ⫺1.10⫾0.57 ⫺2.18 ⫺0.55 ⫺3.20/⫺1.10 .028
All eyes 77 Calculated ⫺0.63⫾0.92 ⫺2.78 2.39 ⫺0.84/0.42
Achieved ⫺0.52⫾0.79 ⫺3.12 1.25 ⫺0.70/⫺0.34
Difference 0.12⫾0.93 ⫺2.18 2.62 ⫺0.09/0.33 .273
95% CI = 95% confidence interval, RK = radial keratotomy, AK = arcuate keratotomy, M-PRK = myopic photorefractive keratectomy, M-LASIK = myopic LASIK, H-LASIK = hyperopic LASIK, IOL = intraocular lens, calculated refraction = expected refraction with SRK-T formula, achieved refraction = final spherical equivalent achieved, difference = difference between calculated and achieved refraction
JRSonlineARCE_Jan15.indd 9
journalofrefractivesurgery.com
10
the central 4-mm total-optical power was 0.32⫾0.77
D steeper. However, from a previous study,23 it was
shown that the Orbscan total-mean power and the equivalent corneal power (thick-lens formula using the thickness, anterior-mean, and posterior-mean cur-vatures) were not different if both are assessed from central zones with the same size. Therefore, the larger
variability found by Cheng et al44,49 may be due to
dif-ferences in methods. Furthermore, they calculated the refractive change at the spectacle plane, whereas
oth-ers18,23 used the corneal plane because the Orbscan II maps represent powers from the cornea and not from spectacles.
The use of the average value from the 2-mm cen-tral zone of Orbscan II total-mean postoperative maps in IOL calculation provided a reasonable postopera-tive cataract refracpostopera-tive outcome in the absence of re-liable data from the previous refractive surgery. The achieved overall spherical equivalent refraction with
SRK-T formula was within ⫾1.50 D in 90% of eyes.
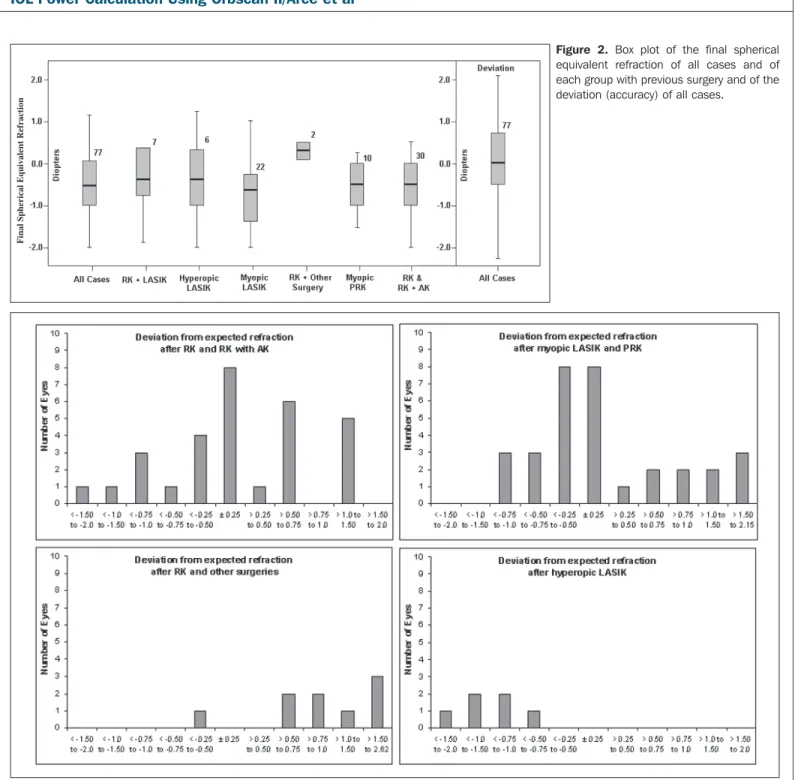
Figure 2. Box plot of the final spherical equivalent refraction of all cases and of each group with previous surgery and of the deviation (accuracy) of all cases.
Final Spherical Equi
v
a
lent Refraction
Figure 3. Difference between the calculated refraction and achieved spherical equivalent refraction (accuracy) with the SRK-T IOL formula according to previous refractive surgery.
JRSonlineARCE_Jan15.indd 10
11
Journal of Refractive Surgery Volume XX Month 200X
The overall difference between the achieved refraction
and the calculated refraction was within ⫾1.00 D in
77% of eyes with the SRK-T formula, 73% with the Holladay formula, 71% with the Hoffer-Q formula, and 51% with the Haigis formula. Myopic RK, PRK, or LASIK had better results than hyperopic LASIK or RK followed by LASIK and other surgeries. The difference between the achieved refraction and the calculated
re-fraction with the SRK-T formula was within ⫾1.00 D
in 23 (77%) of 30 eyes with RK, and in 27 (90%) of 32 eyes with myopic LASIK or PRK. Even with these reasonably good refractive results, the predictability of this method should be improved especially for eyes with previous myopic PRK. Further study should con-fi rm whether this method is in fact independent of the IOL formula, IOL model, surgeon, and biometric and surgical techniques. The effect of other factors such as corneal astigmatism and thickness before cataract sur-gery, optimized A constant, location of clear corneal
incisions, and effective lens position should also be ana-lyzed in the future.
Our fi ndings suggest that the type of refractive treat-ment before cataract surgery may affect the predictability of the fi nal refractive result. We did not fi nd a difference be-tween the achieved refractive outcome and the expected re-fraction in eyes with RK or RK with AK, myopic LASIK, and myopic PRK, but this differ-ence was signifi cant in cases with hyperopic LASIK or RK followed by LASIK. Although eyes with RK and subsequent surgeries seem to trend toward a positive deviation (myopic postoperative cataract refrac-tive error), eyes with hyperopic LASIK seem to trend toward a negative deviation (hyperopic postoperative cataract refrac-tive error). Caution in these complex cases is recommend-ed as more research is nerecommend-edrecommend-ed to understand why they were less accurate. Although not tested in this study, there is a reasonable proposal that the average of the 4-mm total-op-tical power might be better in cases with hyperopic refractive surgery because it was almost always a little steeper than the 2-mm total-mean power and it will measure part of the paracentral cornea that is treated in hyperopic LASIK or PRK.
Myopic eyes with longer axial lengths can lead to
hyperopic refractive errors in IOL calculation.55,56 A
separate analysis21 with the fi rst 26 eyes (11 eyes with
RK, 7 with PRK, and 8 with LASIK) from the New York and Atlanta groups showed that the effect of axial length was V-shape non-linear and signifi cant for the
Holladay (P⬍.05) and Hoffer-Q (P⬍.005) formulas but
not for the SRK-T formula (P⬎.05). The SRK-T formula
had similar accuracy in the three axial length groups studied. The Holladay formula was more accurate for eyes shorter than 26 mm. The Hoffer-Q formula had higher error in eyes between 26 and 27 mm.
As the number of patients who undergo cataract sur-gery after refractive procedures increases, the need for an accurate method of producing emmetropia in these
Figure 4. Scattergrams of the final achieved spherical equivalent refraction and calculated expected refraction with the SRK-T IOL formula according to previous refractive surgery.
JRSonlineARCE_Jan15.indd 11
journalofrefractivesurgery.com
12
pseudophakic eyes will grow and will largely depend on the accurate assessment of the corneal power and the IOL calculation formula. Whereas IOL calculation in eyes with refractive surgeries remains challenging due to the diffi culties in determining a true total power in modifi ed corneas, biometric errors in eyes with RK,
PRK, or LASIK have led to inaccuracies of IOL power.
5-17 The traditional corneal curvature obtained by
kera-tometry has been replaced by an effective refractive
power41 derived from Placido corneal
videokeratogra-phy. However, this approach tended to underestimate the change after myopic refractive surgery because it uses data from only the anterior surface and an
as-sumed keratometric refractive index.18 Intraocular lens
formulas that assume a single corneal spherical surface miss the oblate anterior surface achieved after myopic refractive surgery and the postoperative modifi cation on the spatial variation of thickness and curvature of both corneal surfaces.
Presently, the typical keratometric value applied in postoperative refractive surgical IOL calculation is the effective corneal power derived by the clinical history
method.11-13 However, because many patients with
fractive surgery lack reliable information about their re-fractive history, numerous methods to determine
appro-priate values have been devised.6-18,25-41 Furthermore, the
K derived by the history method11-13 is a value that may
still create errors due to a wrong effective lens position derived from incorrectly estimated anterior chamber
depth.36 To solve this problem, it has been suggested to
include the keratometric value before refractive surgery
(double-K method) in the IOL formulas.36 Because the
history-derived keratometry and the corneal power we used in this study theoretically have equivalent values, the anterior chamber depth variable probably induced a similar error in our cases. Nevertheless, we found that the average of the Orbscan II 2-mm total-mean had a bet-ter result than the history-derived keratometry in 8 of 12 eyes. Quantitative area topography is presently be-ing tested to recover the preoperative 2-mm diameter central power that corneas had before undergoing myo-pic PRK or LASIK directly from the same postoperative
total-mean map we used in this study.58 The aim is to
further improve the accuracy of IOL calculation by
us-ing a modifi ed double-K method.36
Throughout our research we followed the pragmatic thinking that it is better to understand the cause of an error and to avoid it instead of adapting factors to com-pensate for it. Despite its limitations, this study con-fi rmed that the method developed by Sónego-Krone
et al18 and used to determine the total corneal power
directly from eyes with varied refractive surgeries is a valuable tool for IOL calculation.
REFERENCES
1. Victor G, Diniz CH, Nosé W. Considerações econômicas da cirurgia refrativa. In: Alves MR, Chamon W, Nosé W, es. Cirurgia Refrativa. Rio de Janeiro, Brazil: Cultura Médica; 2003:500-511. 2. Leaming DV. Practice styles and preferences of ASCRS
mem-bers-2003 survey. J Cataract Refract Surg. 2004;30:892-900. 3. Duffey RJ, Leaming D. Trends in refractive surgery in the
Unit-ed States. J Cataract Refract Surg. 2004; 30:1781-1785.
4. Victor G, Urbano A, Marçal S, Porto R, Francesconi CM, Forseto Ados S, Barth B, Alves MR, Nosé W. First Brazilian refractive sur-gery survey [Portuguese]. Arq Bras Oftalmol. 2005;68:727-733. 5. Koch DD. New options for IOL calculations after refractive
sur-gery. J Cataract Refract Surg. 2006;32:371-372.
6. Rosa N, Capasso L, Lanza M. IOL calculations after refractive surgery. J Cataract Refract Surg. 2006;32:1984.
7. Chokshi AR, Latkany RA, Speaker MG. IOL calculations after refractive surgery. J Cataract Refract Surg. 2006;32:1984. 8. Seitz B, Langenbucher A. Intraocular lens calculations
sta-tus after corneal refractive surgery. Curr Opin Ophthalmol. 2000;11:35-46.
9. Gimbel HV, Sun R. Accuracy and predictability of intraocular lens power calculation after laser in situ keratomileusis. J Cataract Refract Surg. 2001; 27:571-576.
10. Speicher L. Intra-ocular lens calculation status after corneal re-fractive surgery. Curr Opin Ophthalmol. 2001;12:17-29. 11. Odenthal MT, Eggink CA, Melles G, Pameyer JH, Geerards AJ,
Beekhuis WH. Clinical and theoretical results of intraocular lens power calculation for cataract surgery after photorefractive keratectomy for myopia. Arch Ophthalmol. 2002;120:431-438. 12. Randleman, JB, Loupe DN, Song CD, Waring GO III, Stulting
RD. Intraocular lens power calculations after laser in situ ker-atomileusis. Cornea. 2002;21:751-755.
13. Hamilton DR, Hardten DR. Cataract surgery in patients with prior refractive surgery. Curr Opin Ophthalmol. 2003;14:44-53. 14. Ferrara G, Cennamo G, Marotta G, Loffredo E. New formula to
calculate corneal power after refractive surgery. J Refract Surg. 2004;20:465-471.
15. Latkany RA, Chokshi AR, Speaker MG, Abramson J, Soloway BD, Yu G. Intraocular lens calculations after refractive surgery.
J Cataract Refract Surg. 2005;31:562-570.
16. Chan CC, Hodge C, Lawless M. Calculation of intraocular lens power after corneal refractive surgery. Clin Experiment Oph-thalmol. 2006;34:640-644.
17. Savini G, Barboni P, Zanini M. Intraocular lens power calcula-tion after myopic refractive surgery: theoretical comparison of different methods. Ophthalmology. 2006;113:1271-1282. 18. Sónego-Krone S, López-Moreno G, Beaujon-Balbi O, Arce CG,
Schor P, Campos M. A direct method to measure the power of the central cornea after myopic laser in situ keratomileusis.
Arch Ophthalmol. 2004;122:159-166.
19. Arce CG, Schor P, Campos M. Corneal power measurement after laser in situ keratomileusis. Arch Ophthalmol. 2005;123:410-411.
20. Arce CG, Rocha KM, Soriano ES. O futuro: Orbscan no cálculo da lente intraocular. In: Centurion V, ed. Excelência em Biome-tria. Rio de Janeiro, Brazil; Cultura Médica; 2006:313-320. 21. Vadrevu VL, Weisenthal RW, Hamilton SM, Arce CG. Effect of
axial length on the predictive accuracy of IOL power formulas in cataract surgery after refractive surgery. Poster presentation: American Academy of Ophthalmology annual meeting; No-vember 11-14, 2006; Las Vegas, Nev.
22. Arce CG, Alzamora JB, Stilittano I, Schor P, Campos M.
Quanti-JRSonlineARCE_Jan15.indd 12
13
Journal of Refractive Surgery Volume XX Month 200X
tative area topography. A new concept applied to study normal and pathologic corneas. Poster presentation: Association for Re-search in Vision and Ophthalmology meeting; April 30 – May 4, 2006; Ft Lauderdale, Fla.
23. Canarin de Oliveira EC, Arce CG, Campos MSQ, Schor P. O cálculo do poder das lentes intra-oculares e o Orbscan II. Parte 1: O poder óptico da córnea normal. Arq Bras Oftalmol. 2003;66:567-574. 24. Patel S, Alio JL, Pérez-Santonja JJ. A model to explain the
dif-ference between changes in refraction and central ocular sur-face power after laser in situ keratomileusis. J Refract Surg. 2000;16:330-335.
25. Camellin M, Calossi A. A new formula for intraocular lens pow-er calculation aftpow-er refractive corneal surgpow-ery. J Refract Surg. 2006;22:187-199.
26. Holladay JT. Standardizing constants for ultrasonic biometry, keratometry, and intraocular lens power calculations. J Cata-ract RefCata-ract Surg. 1997;23:1356-1370.
27. Hugger P, Kohnen T, La Rosa FA, Holladay JT, Koch DD. Comparison of changes in manifest refraction and corneal power after photorefractive keratectomy. Am J Ophthalmol. 2000;129:68-75.
28. Zeh WG, Koch DD. Comparison of contact lens overrefrac-tion and standard keratometry for measuring corneal curva-ture in eyes with lenticular opacity. J Cataract Refract Surg. 1999;25:898-903.
29. Kim JH, Lee DH, Joo CK. Measuring corneal power for intraocu-lar lens power calculation after refractive surgery: comparison of methods. J Cataract Refract Surg. 2002;28:1932-1938. 30. Haigis W. Corneal power after refractive surgery for myopia:
con-tact lens method. J Cataract Refract Surg. 2003;29:1397-1411. 31. Ianchulev T, Salz J, Hoffer K, Albini T, Hsu H, Labree L.
Intra-operative optical refractive biometry for intraocular lens power estimation without axial length and keratometry measurements.
J Cataract Refract Surg. 2005;31:1530-1536.
32. Mackool RJ, Ko W, Mackool R. Intraocular lens power calcula-tion after laser in situ keratomileusis: Aphakic refraccalcula-tion tech-nique. J Cataract Refract Surg. 2006;32:435-437.
33. Hoffer KJ. Intraocular lens power calculation for eyes after re-fractive keratotomy. J Refract Surg. 1995;11:490-493.
34. Kalski RS, Danjoux JP, Fraenkel GE, Lawless MA, Rogers C. Intraocular lens power calculation for cataract surgery after photorefractive keratectomy for high myopia. J Refract Surg. 1997;13:362-366.
35. Wang L, Jackson DW, Koch DD. Methods of estimating corneal refractive power after hyperopic laser in situ keratomileusis.
J Cataract Refract Surg. 2002;28:954-961.
36. Aramberri J. Intraocular lens power calculation after corneal refractive surgery: double-K method. J Cataract Refract Surg. 2003;29:2063-2068.
37. Wang L, Booth MA, Koch DD. Comparison of intraocular lens power calculation methods in eyes that have undergone LASIK.
Ophthalmology. 2004;111:1825-1831.
38. Walter KA, Gagnon MR, Hoopes PC, Dickinson PJ. Accurate in-traocular lens power calculation after myopic laser in situ ker-atomileusis, bypassing corneal power. J Cataract Refract Surg. 2006; 32:425-429.
39. Feiz V, Mannis MJ, Garcia-Ferrer F, Kandavel G, Darlington JK, Kim E, Caspar J, Wang JL, Wang W. Intraocular lens power calculation after laser in situ keratomileusis for myopia and hy-peropia: a standardized approach. Cornea. 2001;20:792-797. 40. Rosa N, Capasso L, Romano A. A new method of calculating
in-traocular lens power after photorefractive keratectomy. J Refract Surg. 2002;18:720-724.
41. Holladay JT. Corneal topography using the Holladay Diagnostic Summary. J Cataract Refract Surg. 1997;23:209-221.
42. Preussner P-R, Wahl J, Weitzel D. Topography-based intraocular lens power selection. J Cataract Refract Surg. 2005;31:525-533. 43. Arce CG, Campos M, Schor P. Determining corneal power using
Orbscan II videokeratography for intraocular lens calculation after excimer laser surgery for myopia. J Cataract Refract Surg. 2007;33:1348-1349.
44. Cheng ACK, Lam DSC. Keratometry for intraocular lens power calculation using Orbscan II in eyes with laser in situ keratomi-leusis. J Refract Surg. 2005;21:365-368.
45. Qazi MA, Cua IY, Roberts CJ, Pepose JS. Determining corneal power using Orbscan II videokeratography for intraocular lens calculation after excimer laser surgery for myopia. J Cataract Refract Surg. 2007;33:21-30.
46. Leyland M. Validation of Orbscan II posterior corneal curva-ture measurement for intraocular lens power calculation. Eye. 2004;18:357-360.
47. Han ES, Lee JH. Intraocular lens power calculation in high myopic eyes with previous radial keratotomy. J Refract Surg. 2006;22:713-716.
48. Gelender H. Orbscan II-assisted intraocular lens power calcu-lation for cataract surgery following myopic laser in situ ker-atomileusis (an American Ophthalmological Society thesis).
Trans Am Ophthalmol Soc. 2006;104:402-413.
49. Cheng AC, Rao SS, Lau S, Wong A, Lam DS. Comparison of tech-niques for corneal power assessment after myopic LASIK without the use of preoperative data. J Refract Surg. 2008;24:539-543. 50. Aramberri J. Corneal power after refractive surgery using
avail-able anterior/posterior ratio. Presented at: XXIV Congress of the European Society of Cataract and Refractive Surgery; Septem-ber 9-13, 2006; London, United Kingdom.
51. Arce CG, Francesconi CM. Características do Orbscan (Bausch & Lomb). In: Vieira Netto M, Ambrosio R Jr, Schor P, Chalita MR, Chamon W, eds. Wavefront, Topografi a e Tomografi a da Córnea e Segmento Anterior. Rio de Janeiro, Brazil: Editora Cul-tura Médica Ltda; 2006:123-139.
52. Srivannaboon S, Reinstein DZ, Sutton HF, Holland SP. Accu-racy of Orbscan total-optical power maps in detecting refractive change after myopic laser in situ keratomileusis. J Cataract Re-fract Surg. 1999;25:1596-1599.
53. Mc Cormick GJ, Aquavella JV, MacRae SM. Use of the Orbscan II for IOL power calculation after laser refractive surgery. Pre-sented at: American Society of Cataract and Refractive Surgery annual meeting; April 28 – May 2, 2007; San Diego Calif. 54. Savini G, Barboni P, Profazio V, Zanini M, Hoffer KJ. Corneal
power measurements with the Pentacam Scheimpfl ug camera after myopic excimer laser surgery. J Cataract Refract Surg. 2008;34:809-813.
55. Koch DD, Wang L. Corneal power measurements by the Gali-lei of post-LASIK/PRK eyes. Presented at: American Society of Cataract and Refractive Surgery, Galilei User’s Meeting; April 4-9, 2008; Chicago, Ill.
56. Tsang CS, Chong GS, Yiu EP, Ho CK Intraocular lens power calculation formulas in Chinese eyes with high axial myopia. J Cataract Refract Surg. 2003;29:1358-1364.
57. Lacava AC, Centurion V. Biometry in high myopic eyes: the previsibility of three formulas [Portuguese]. Rev Bras Oftalmol. 2006;65:224-228.
58. Maidana E et al. Método para determinar cual era el poder central de la córnea antes de la cirugía refractiva de miopía. Presented at: XXV Pan American Congress of Ophthalmology; March 18-21, 2005; Santiago, Chile.
JRSonlineARCE_Jan15.indd 13
journalofrefractivesurgery.com
14
AUTHOR QUERIES
In the Abstract, Results, please indicate the percentage of eyes with ⫾0.50 D, and include the range of
out-comes for both methods for all eyes.
Please clarify the numbers, as 27/32 is 85%, not 90%
The difference between the achieved refraction and the calculated refraction with the SRK-T formula was
within ⫾1.00 D in 23 (77%) of 30 eyes with RK, and in 27 (90%) of 32 eyes with myopic LASIK or PRK.
Regarding the references, all parenthetical citations from meetings were added to the reference list per AMA style and all references were renumbered accordingly.
Please verify the authors listed for reference 19, as the authors on PubMed were Jin, Crandall, and Lyle. Reference 23 could not be found on PubMed. Please verify the authors.
Please verify the title of reference 57. What is meant by “previsibility”? Was the title translated from Portu-guese?
Please provide all authors for reference 58.
JRSonlineARCE_Jan15.indd 14